The Latest USDJPY Update From the Savvy Trader This is the latest update from a long time, highly respected Global-View member who called the top at USDJPY 162. I thus nicknamed him the savvy trader who...
Cart
To use Cart please install WooCommerce plugin
Return to previous page
Page 2
Weekly FX Chart Outlook EURUSD DAILY CHART – WEEKLY OUTLOOK Trend is up 1.1047 recent high is now key resistance blocking 1.1137. Use 1.1050 as well. The weekly close above 1.10 is bullish but only a break/close...
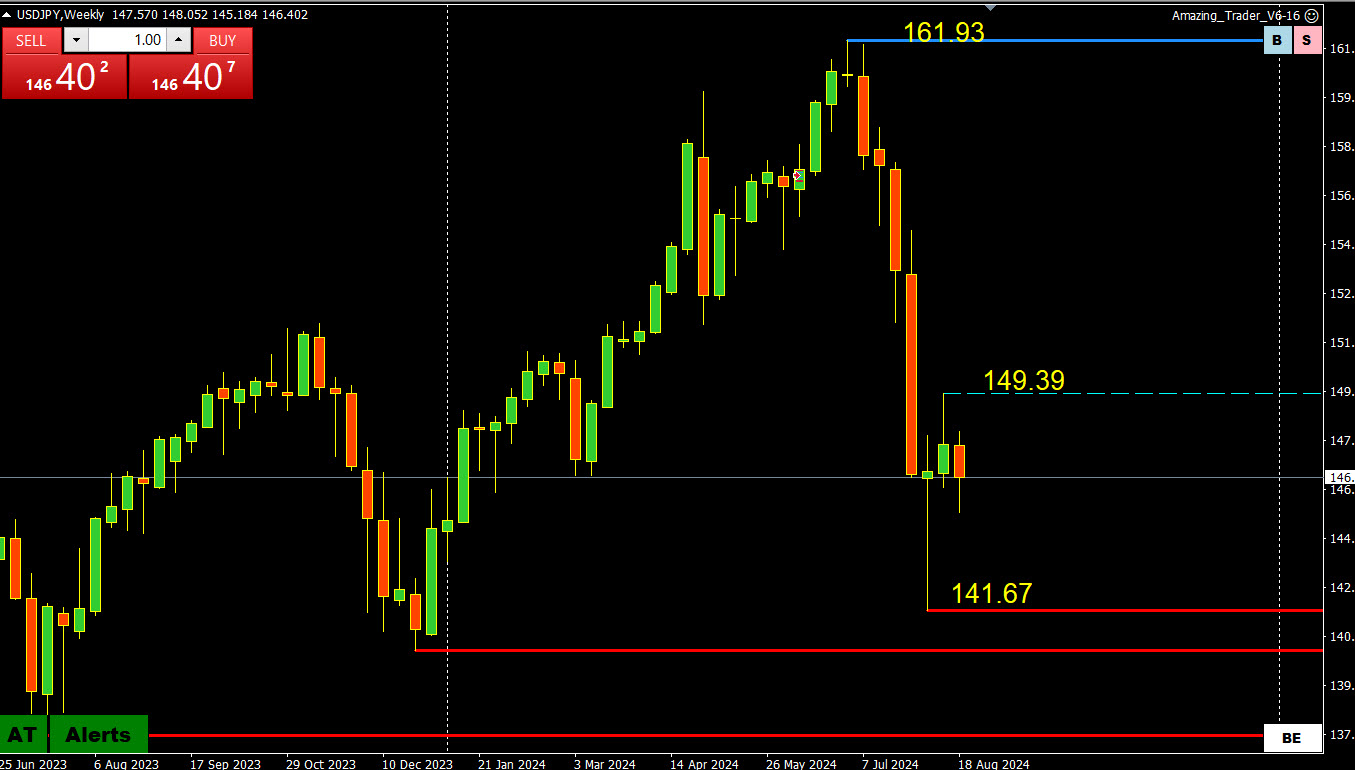
Weekly Charts Analysis USDJPY DAILY CHART – Time to take a breather? USDJPY pattern is 5 down weeks in a row. To break this pattern, 147.90 would need to be broken. Otherwise, there could be an inside week....

Newsquawk.com Week Ahead12th-16th August 2024: Highlights include US CPI and Retail Sales; UK CPI, Jobs and Retail Sales; Aussie Jobs; RBNZ; China activity data and Japan GDP MON: OPEC Monthly Oil Market Report; Japanese Market Holiday (Mountain...

Forex Trading Glossary I-K Importers/Exporters Produce a regular flow of trading volume in the FX market. Impulse Wave (Elliott Wave) Impulse waves are those that define the main direction of the trending move. They are...
Newsquawk.com Week Ahead 5th-9th August: Highlights include ISM Services PMI, RBA, BoJ SoO, BoC Minutes, and Chinese inflation MON: Canadian Market Holiday (Civic Day), Chinese Caixin Services PMI Final (Jul), UK/EZ/US Services & Composite PMI Final (Jul),...
Forex Trading Glossary E-F Economic Indicator Measures the strength or weakness of all or part of a country’s economy. EMA See Exponential Moving Average Engulfing – Bullish and Bearish (Candlestick Reversal Pattern) The first bar of the...
Forex Trading Glossary C-D Cable Nickname for the Great Britain Pound. Candlestick Charts This is a form of price presentation similar to bar charts which is used to identify localized price patterns that represent market psychology that...
Forex Trading Glossary A-B ABC Wave A term used in Elliott Wave that describes a simple correction after a trending move. It is comprised of three-wave (waves A, B and C) forming a corrective or countertrend price...
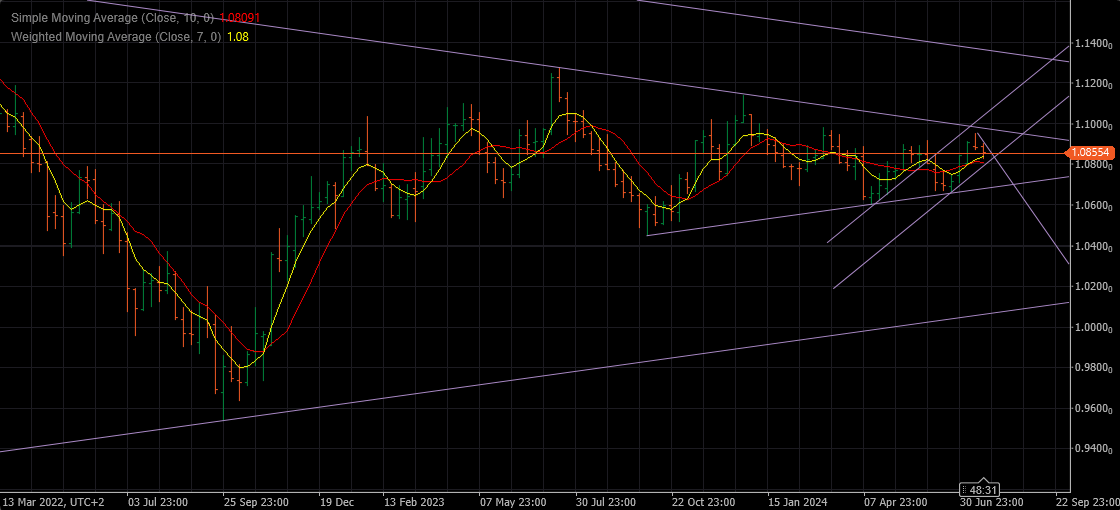
Weekly Charts 28.07. – 02.08. EURUSD Weekly Chart Resistances at : 1.08600 , 1.09500 & 1.09700 Supports at : 1.08350 , 1.08050 & 1.07450 Major Support comes at 1.06800 Major Resistance at : 1.09700 Pattern...
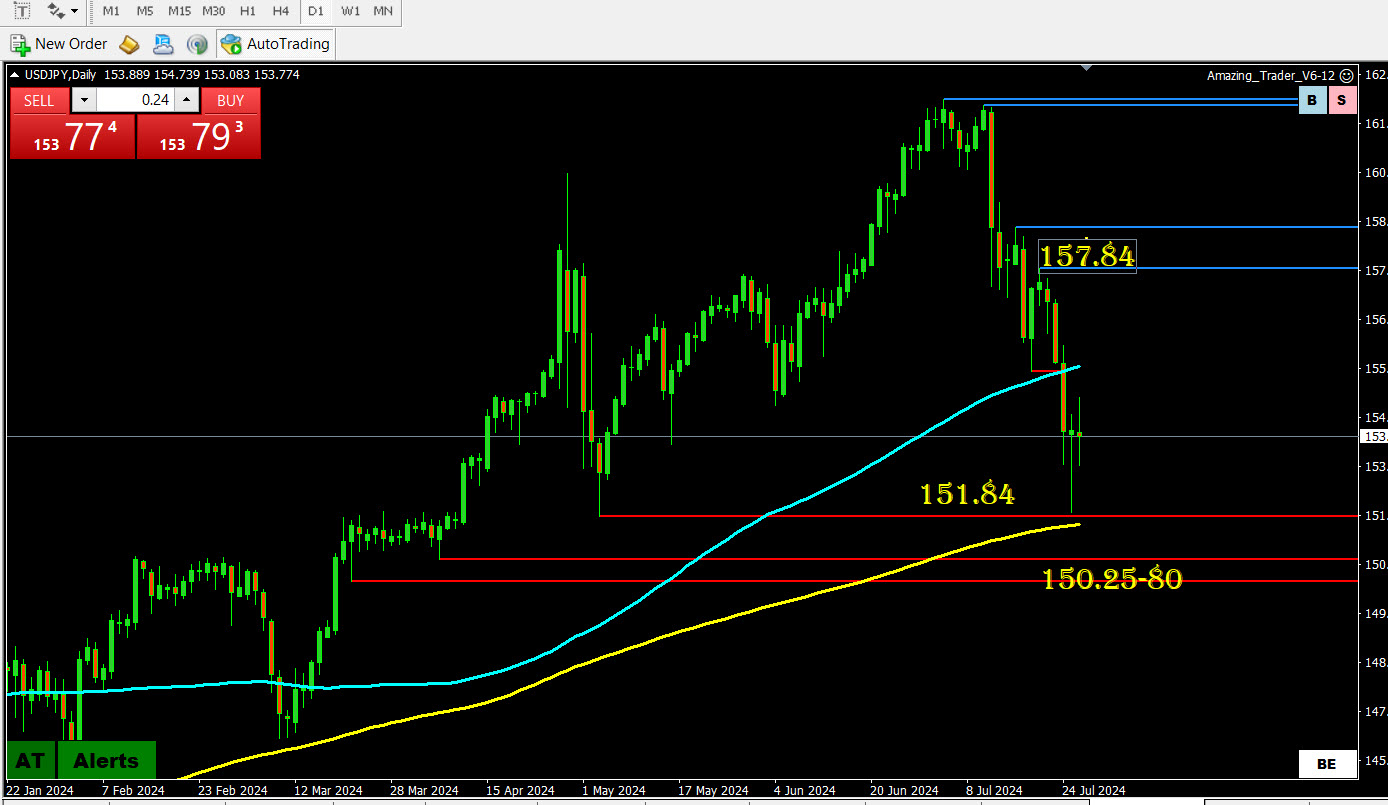
WEEKLY CHARTS July 28th-August 4th USDJPY Daily Chart The retreat from 161.93 has seen broad unwinding of short JPY position before a pause on Friday. Watch AUDJPY, which has been a leader. 151.84 tested (double...

How to Calculate Heikin Ashi A new trader may look at the Heikin Ashi chart and think that it looks just like the candlesticks that one will see on a regular chart, but they are NOT...
Showing 13–24 of 33 posts