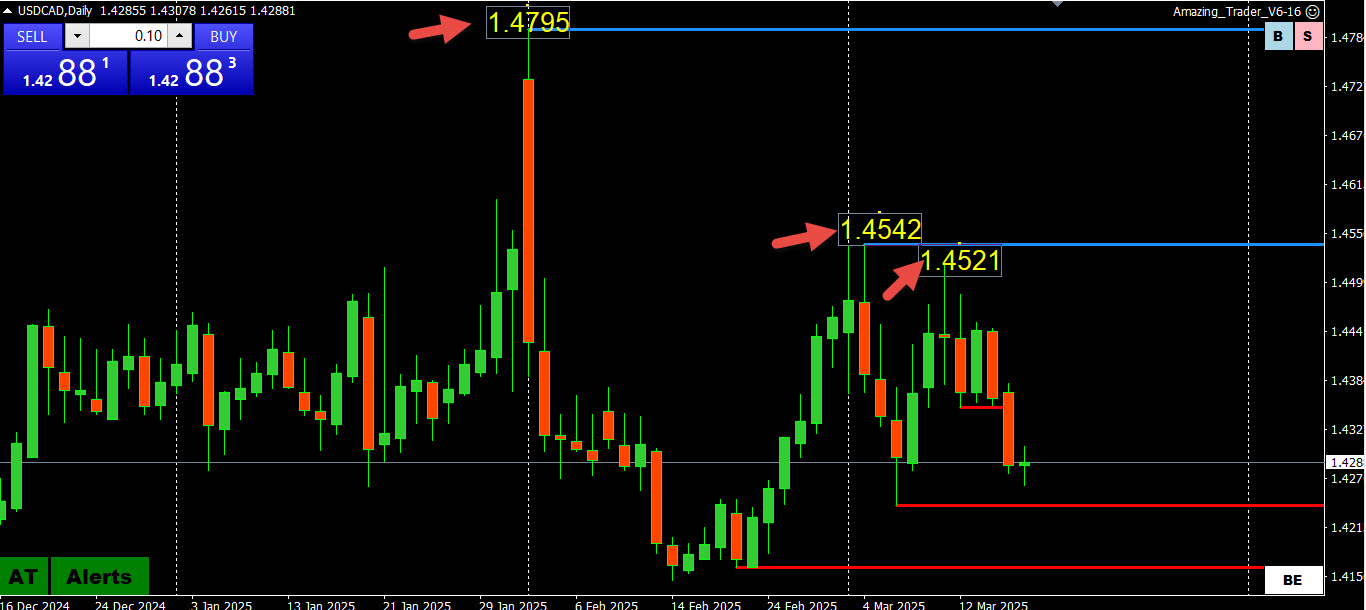
What is this USDCAD chart telling us about tariffs? Looking at a USDCAD daily chart Shows there have been three spikes higher, each lower than the previous one (1.4795, 1.4542, 1.45.21). USDCAD DAILY CHART What each spike...
Cart
To use Cart please install WooCommerce plugin
Return to previous page
Tag: charting
Forex Trading Glossary – P Par The principal amount of an investment instrument (e.g. 100) or where price equals the original value. Parabolic Stop Wells Wilder introduced the Parabolic Indicator, whose shape resembles the curve...
Forex Trading Glossary I-K Importers/Exporters Produce a regular flow of trading volume in the FX market. Impulse Wave (Elliott Wave) Impulse waves are those that define the main direction of the trending move. They are...
Forex Trading Glossary C-D Cable Nickname for the Great Britain Pound. Candlestick Charts This is a form of price presentation similar to bar charts which is used to identify localized price patterns that represent market psychology that...

Risk Management All of life is the management of risk — not its elimination. WALTER WRISTON 21 MANAGE YOUR POSITION AND PORTFOLIO SIZE Never take an arbitrary position size. Every trade that you take should...

What are Trend Lines in Trading? Trend lines are probably the most familiar and most used basic charting technique for technical analysis in trading. They are fundamental to technical analysis and about as accurate as any other...