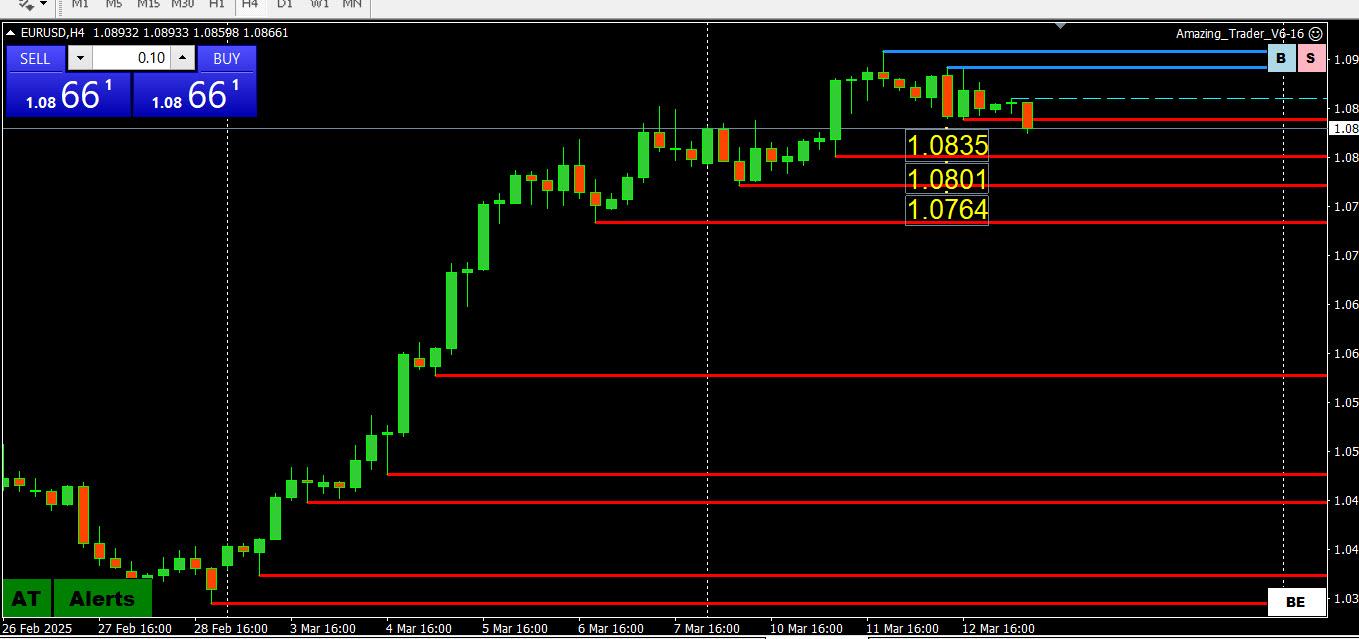
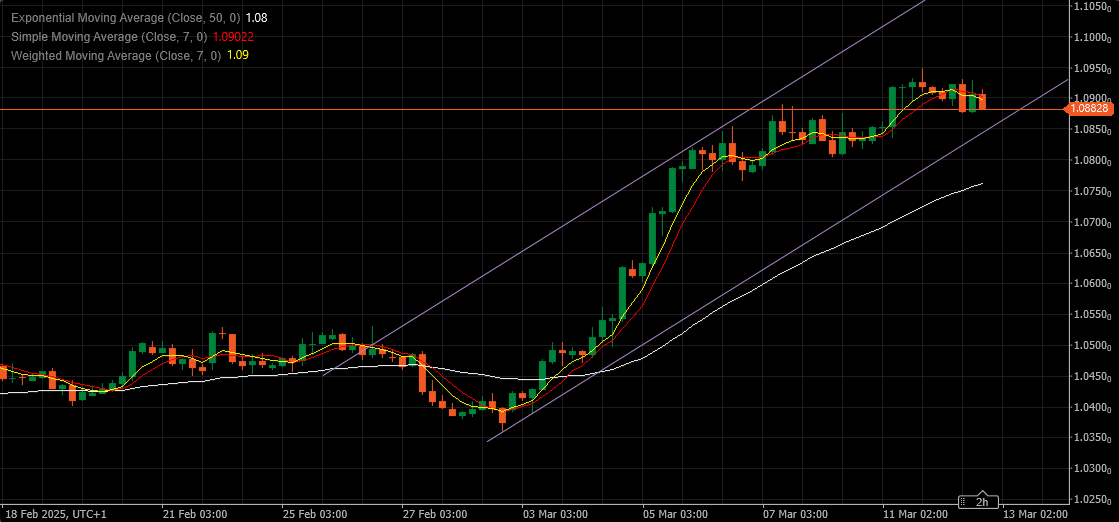
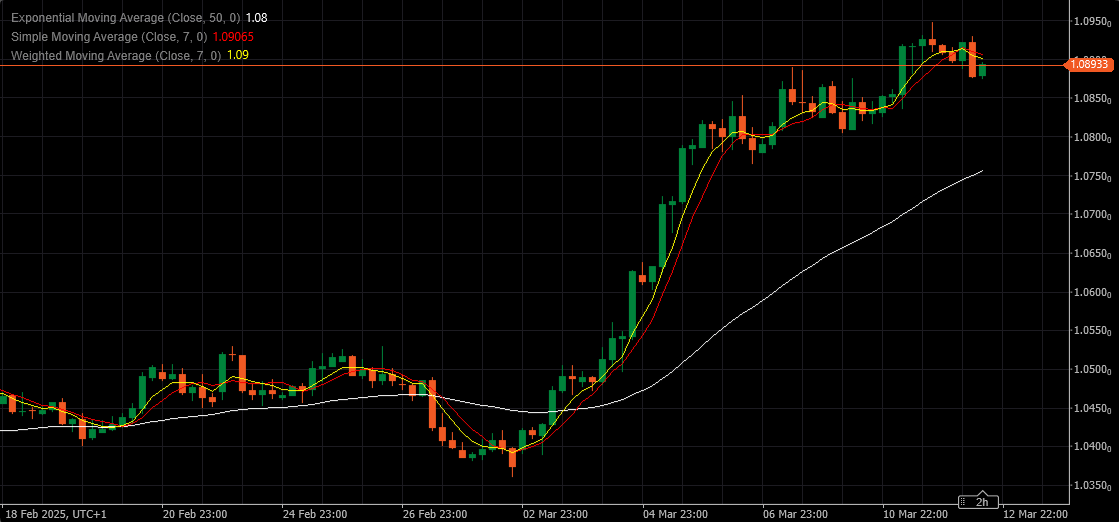
What caught my eye is the failure to trade above 1.09 (high 1.0897) after past two days testing above it.
This chart shows a classic AT (Amazing Trader) down ladder pattern (falling blue lines) with a risk for 1.0800-35 while below 1,0875. BUT would have to first get through the pivotal 1.050 level first.
Back above 1.09 would be needed to restore the BID.
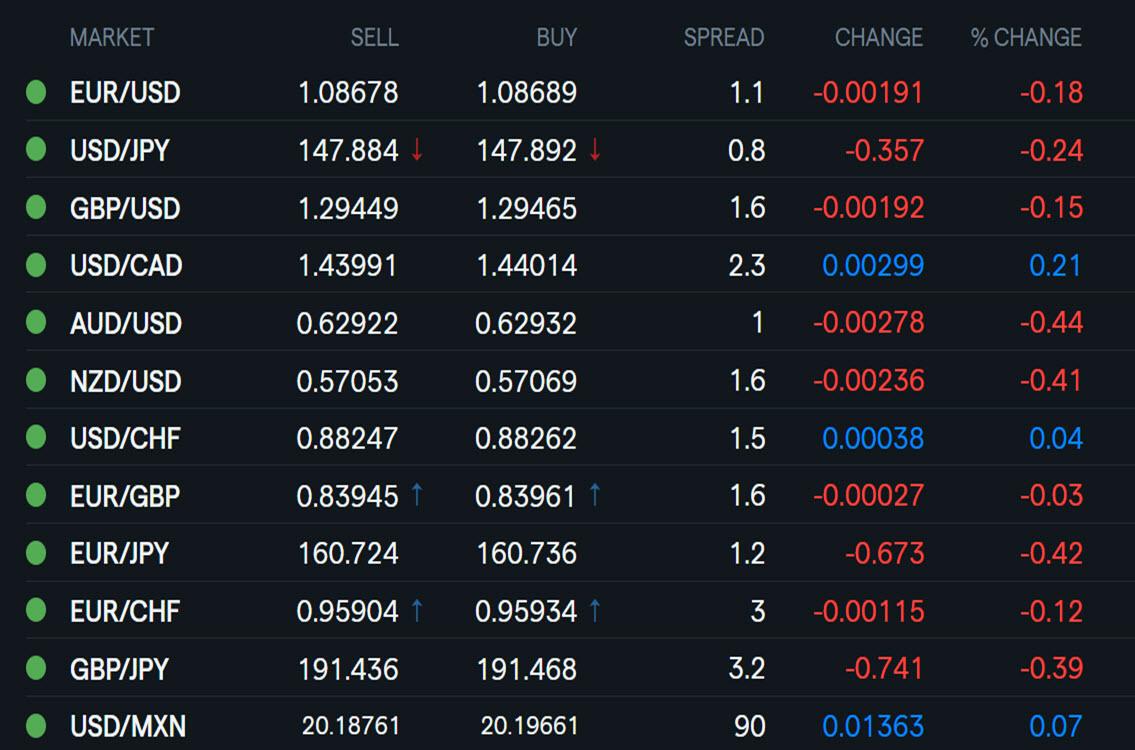
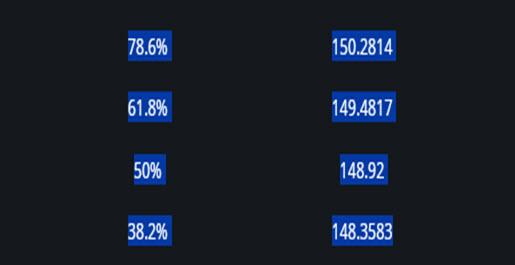
With stocks bouncing from the lows, bond yields following, the FX market is not sure whAT PATH TO FOLLOW while USDJPY remains well of the 149+ high but still up on the day above 148.
EURUSD is back to about unchanged on the day in what seems to be setting up to be an FX range afternoon with the focus mainly on US rquities.
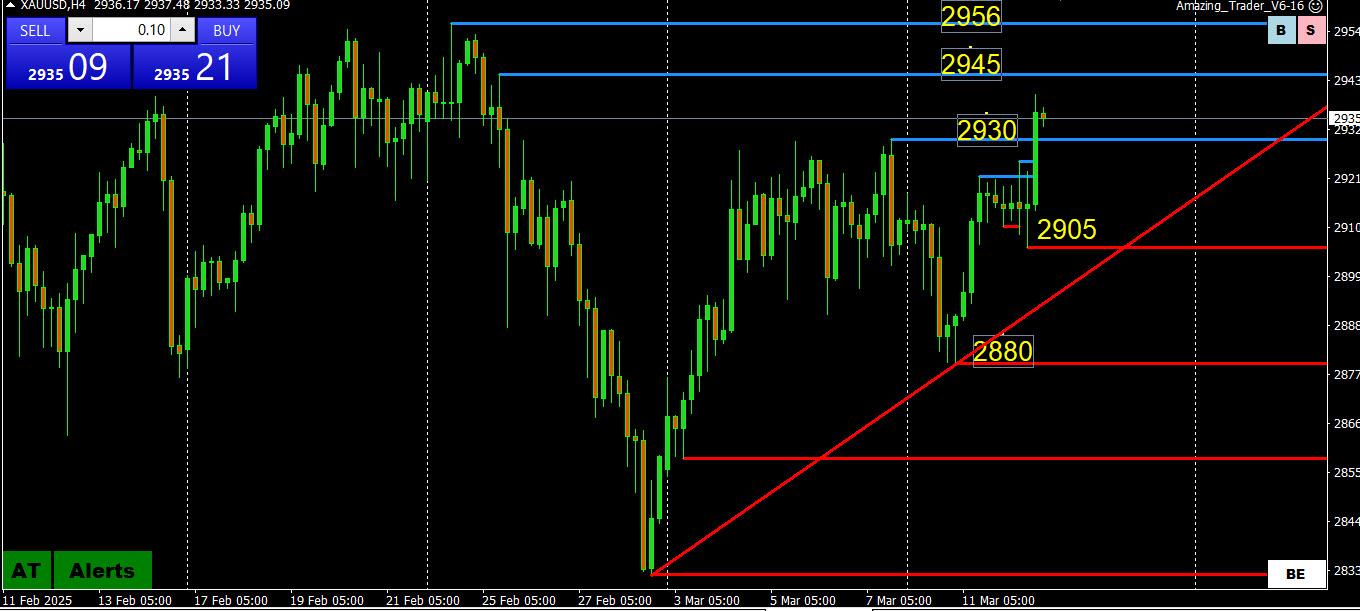
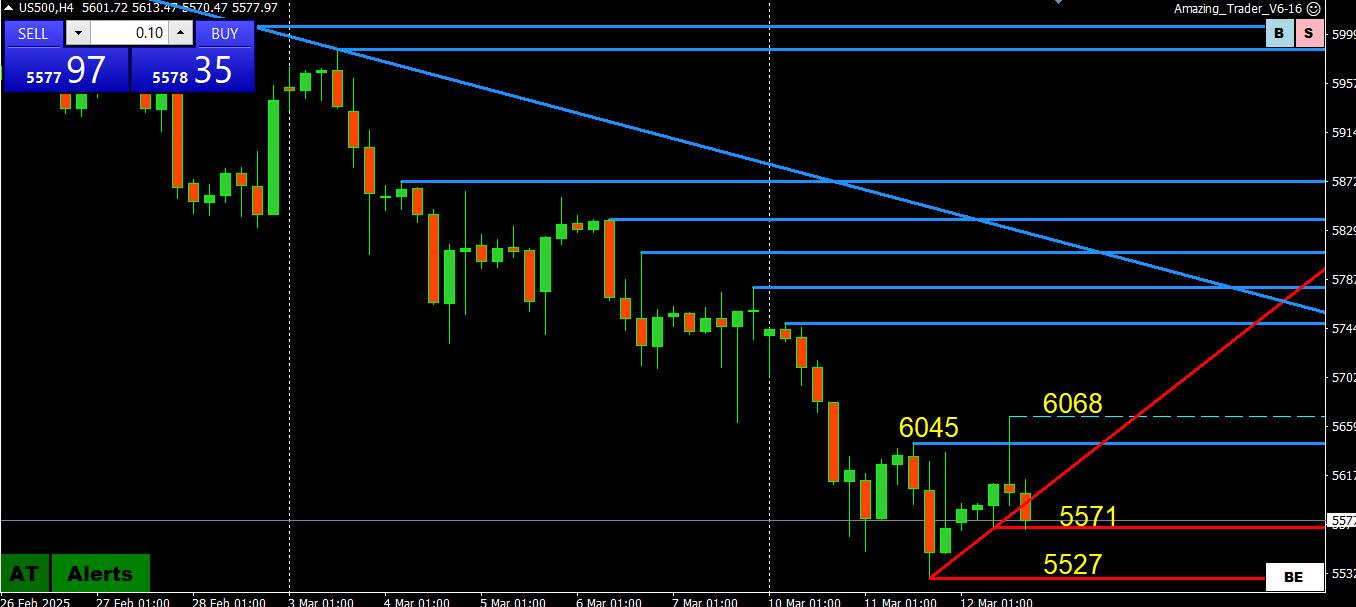
When in a strong trend, there often needs to be a correction to shakeout the weak longs (or shorts), which in turn sets up a run at a new high (or low) as the market has less capacity (fewer longs or shorts) to absorb fresh buying (or selling).
See if this proves to be the case after the earlier stock market shakeout.