European stocks steady while U.S. futures tick up, Turkish assets tumble
· European stocks little changed, U.S. futures up
· Investors focused on tariff and growth concerns
· Turkish assets drop after arrest of Erdogan rival
European shares struggled for direction on Wednesday while U.S. futures ticked up after a selloff on Wall Street, as investors waited for the Federal Reserve rates decision later in the day.
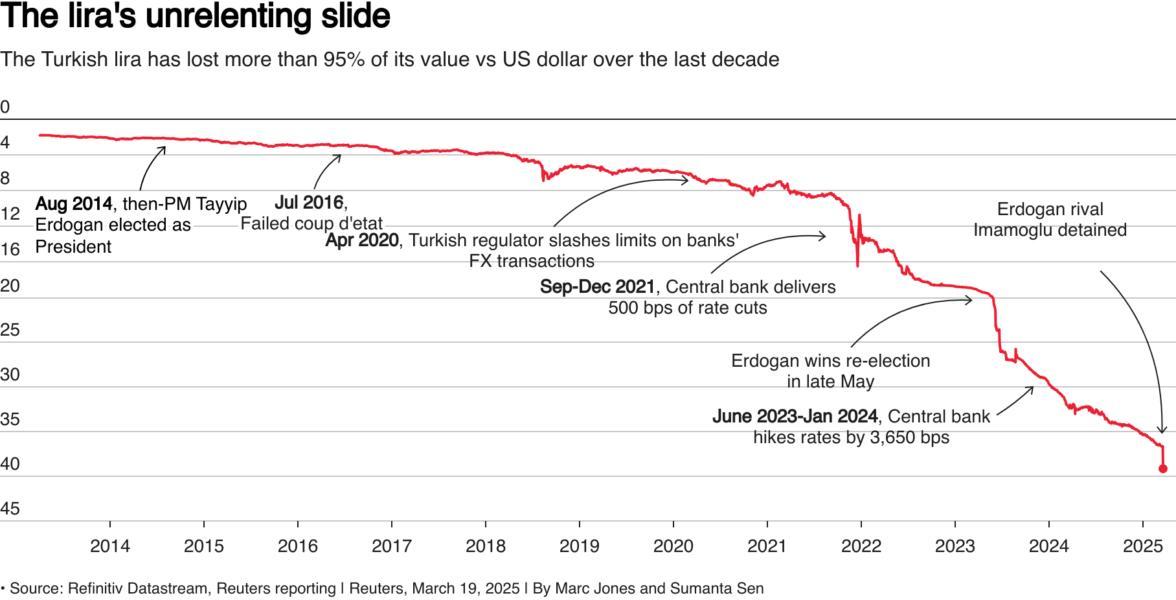
Meanwhile, Turkish stocks, bonds and the lira all slid, helping boost the safe-haven U.S. dollar, after authorities detained President Tayyip Erdogan’s main political rival on Wednesday.
TURKISH SELL-OFF
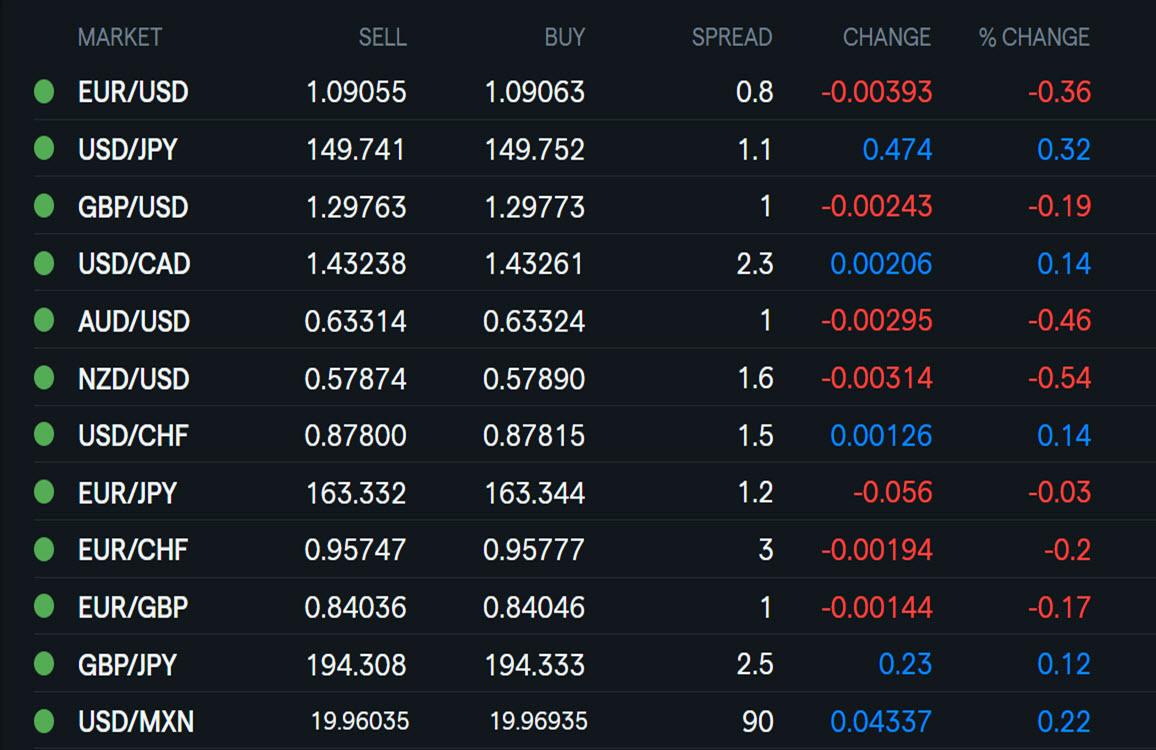
The Turkish lira slid in its biggest daily fall since the peak of the country’s most recent currency crisis in June 2023 and last traded at around 38 per dollar, down around 4% USDTRY.
Investors ditched Turkish assets after authorities detained Ekrem Imamoglu, the Istanbul mayor, on Wednesday on charges including corruption and aiding a terrorist group. The main opposition party called the arrest “a coup against our next president”.
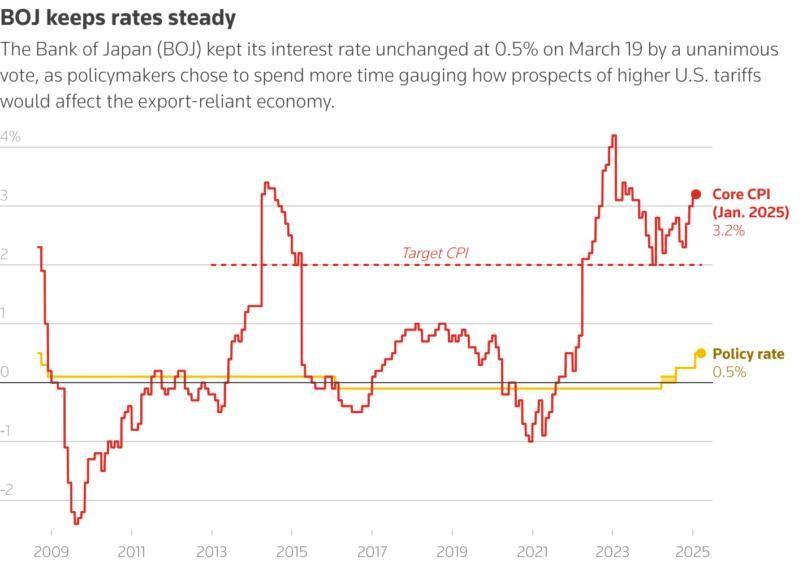
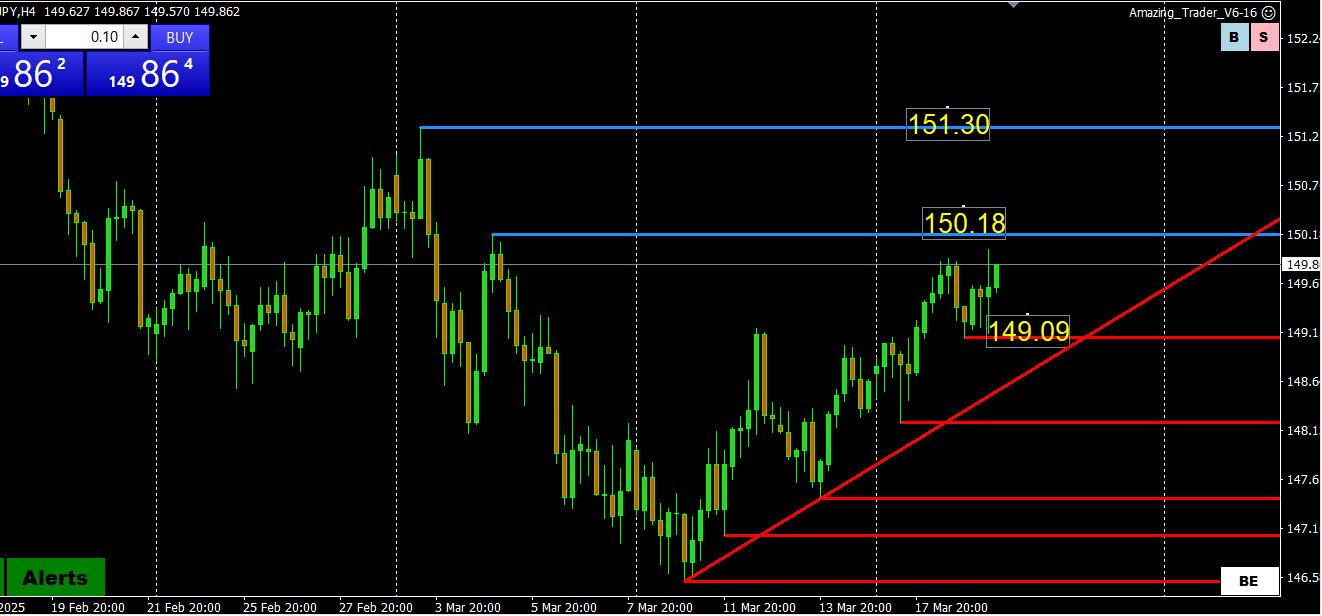
The yen weakened against the dollar, which rose 0.3% to 149.805 in volatile trade as investors mulled the BOJ decision to hold rates steady and comments from Governor Kazuo Ueda
he widely expected BOJ decision underscored policymakers’ preference to spend more time gauging how mounting global economic risks from higher U.S. tariffs could affect Japan’s fragile recovery.
“The decision to leave monetary policy unchanged itself is not a surprise, so its impact on exchange rates is limited. However, the earlier-than-usual timing of the announcement seems to have led financial markets to initially interpret that the BOJ (did not consider) bringing forward a rate hike,” said Hirofumi Suzuki, chief FX strategist at SMBC.
Dollar rises ahead of Fed; Turkish lira drop reins in G10 currencies
Key points:
· Dollar up, Fed decision key for markets on Wednesday
· Safe haven currencies rise after Turkey lira plunges
· Yen up after BOJ stands pat on rates
· Euro stays near five-month peak on German fiscal reform
The dollar rallied on Wednesday ahead of the Federal Reserve’s decision on interest rates, but retreated from the day’s highs after markets stabilised from an early shock caused by the detention of Turkish President Tayyip Erdogan’s main rival.
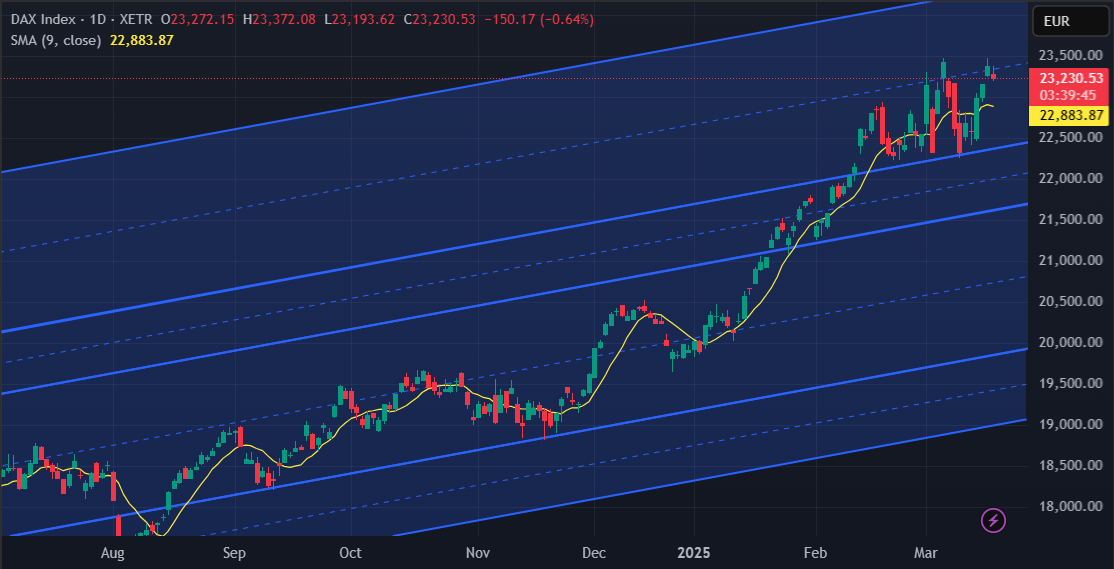
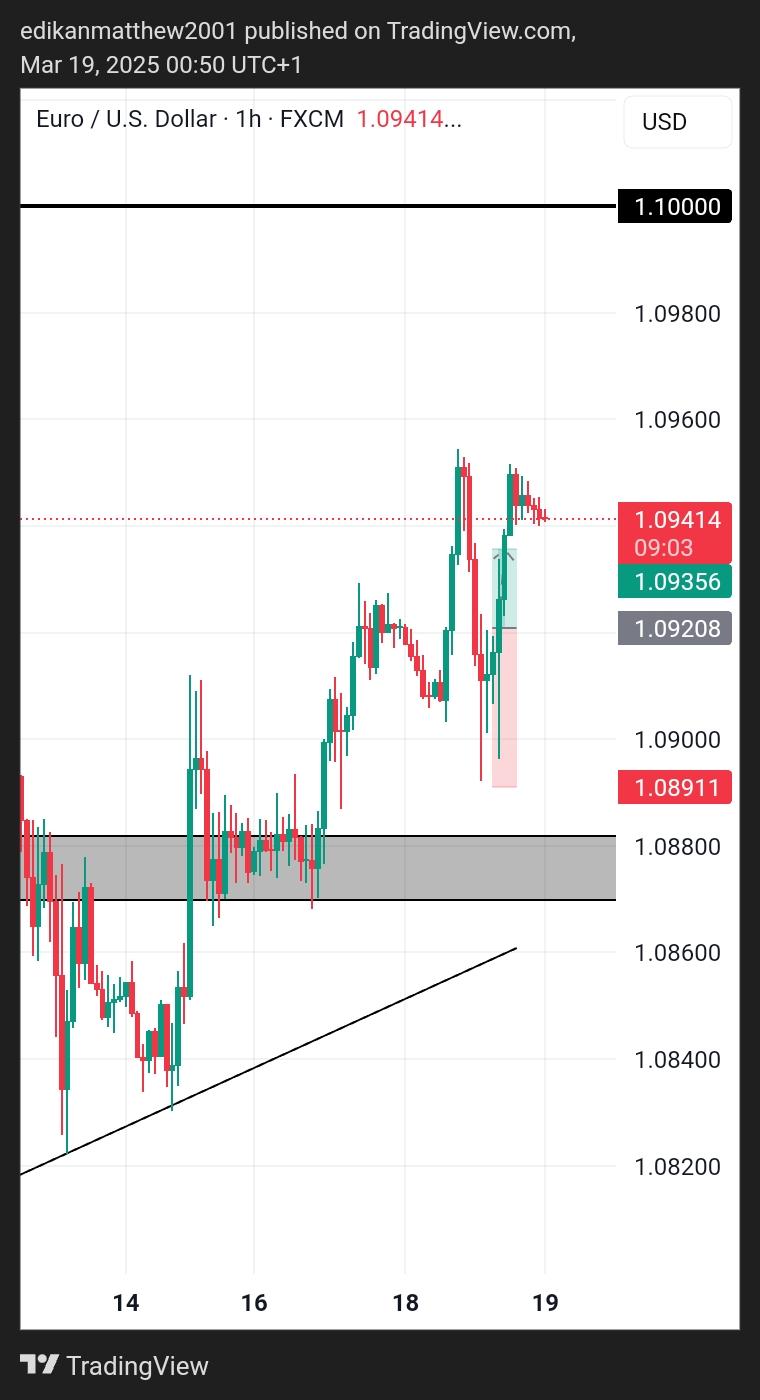
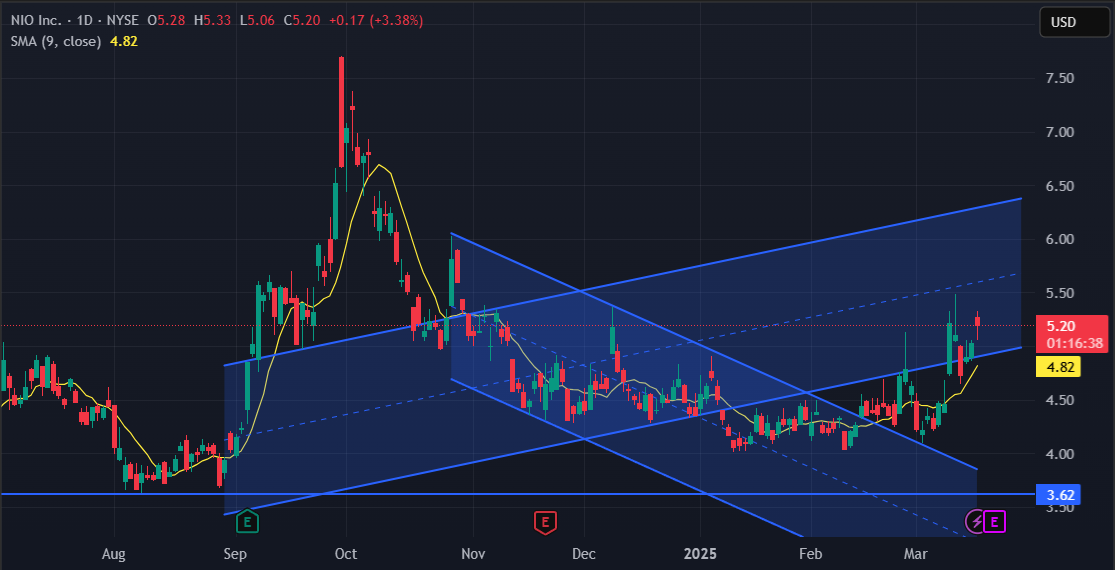
Pattern wise: I don’t like that it didn’t reach a new high in this bar, and even it does look very Bullish – ALL EYES on those resistances – it can fail.
USD firmer, EUR and GBP hit by JPY-action on Ueda’s press conference, US futures a touch firmer ahead of FOMC
Good morning USA traders, hope your day is off to a great start! Here are the top 5 things you need to know for today’s market.
5 Things You Need to Know
European bourses began the session on the backfoot with the risk tone dented as a few potential factors influenced, US futures modestly firmer pre-Fed
USD firmer, EUR and GBP hit by JPY-action on Ueda’s press conference; BoJ itself was as expected, Ueda began balanced but had some hawkish points in his presser
Fixed income initially benefited on the slip in the risk tone but has since eased off best with USTs now slightly softer into the FOMC
Crude remains pressured after Tuesday’s geopolitical developments while Gas has picked up as strikes on energy infrastructure seemingly continue
Ukraine’s Zelensky to speak with US’ Trump on Wednesday and hopes a ceasefire will eventually be implemented
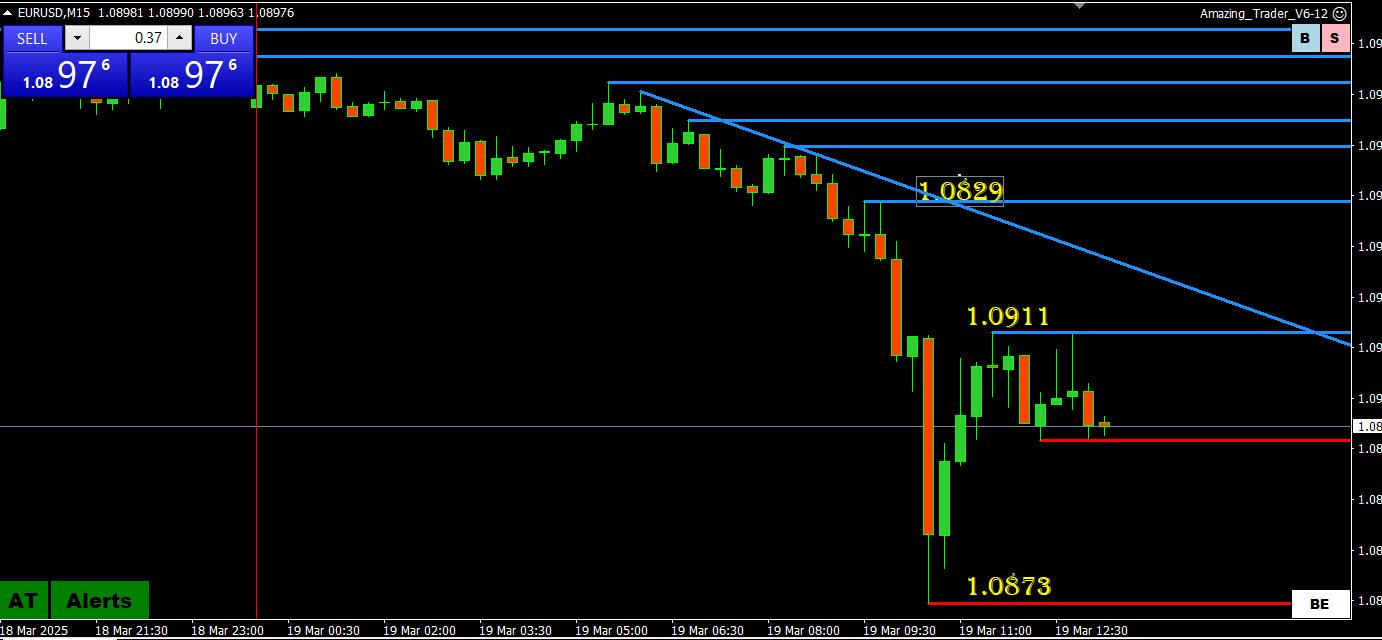
EURUSD back to 1.09 for the 7th day in a row after running stops to a low at 1.0873. Note a failure again to make a serious run above 1.0950 (this time paused below it).
Perhaps some disappointment the Trump-Putin call did not result in a full ceasefire
USDJPY 150 briefly tested (high 150.02) after the BoJ kept policy steady
Turkish lira smashed following arrest of chief political rival
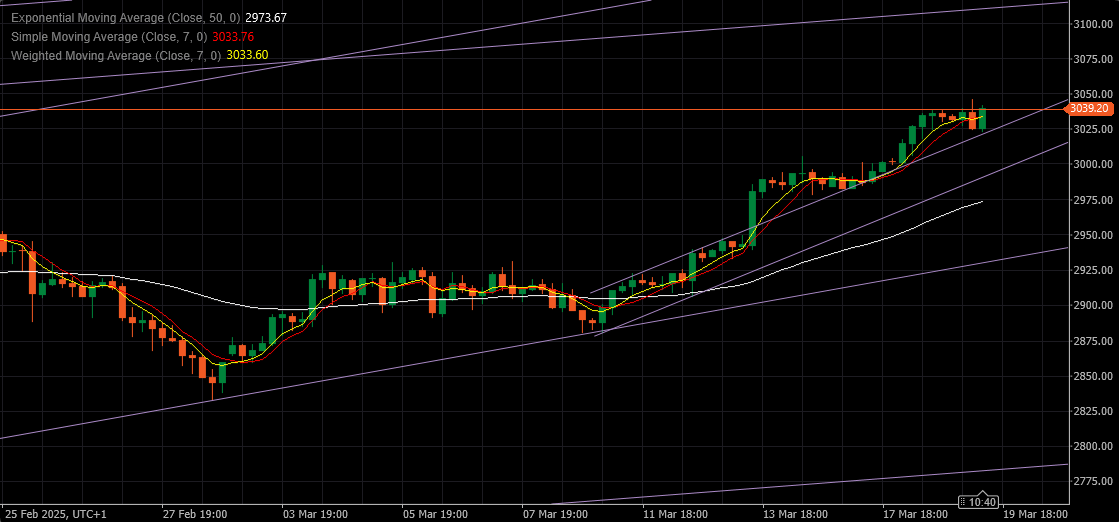
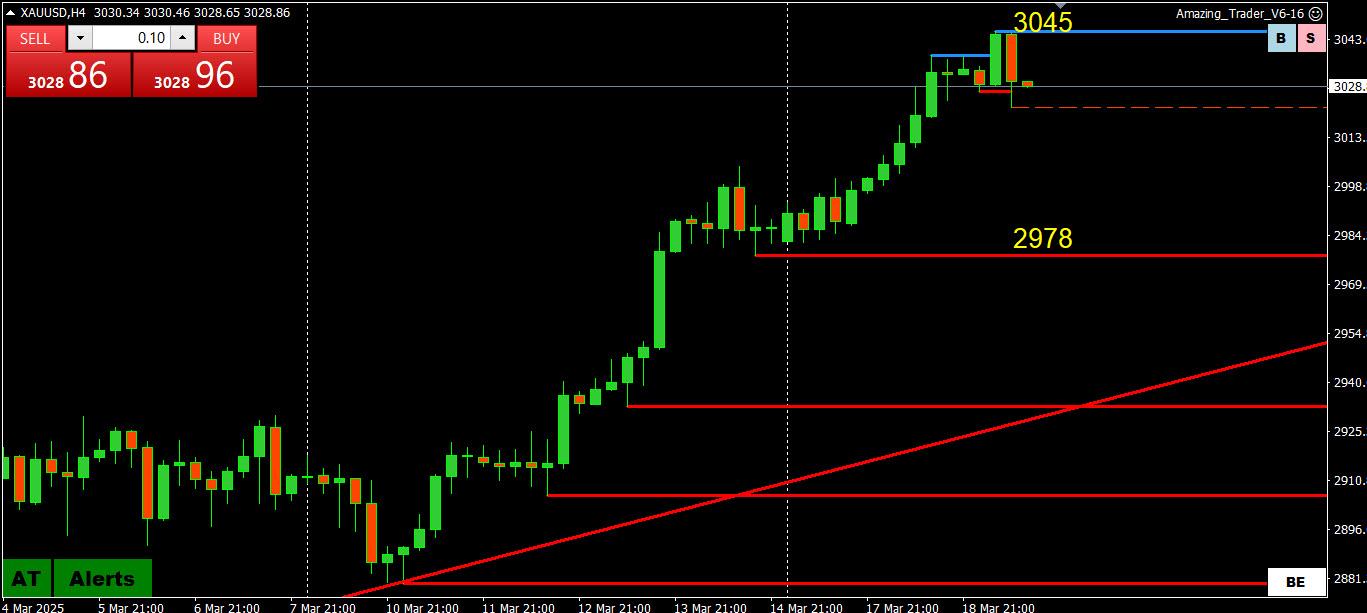
XAUUSD consolidating after surging to another record high yesterday
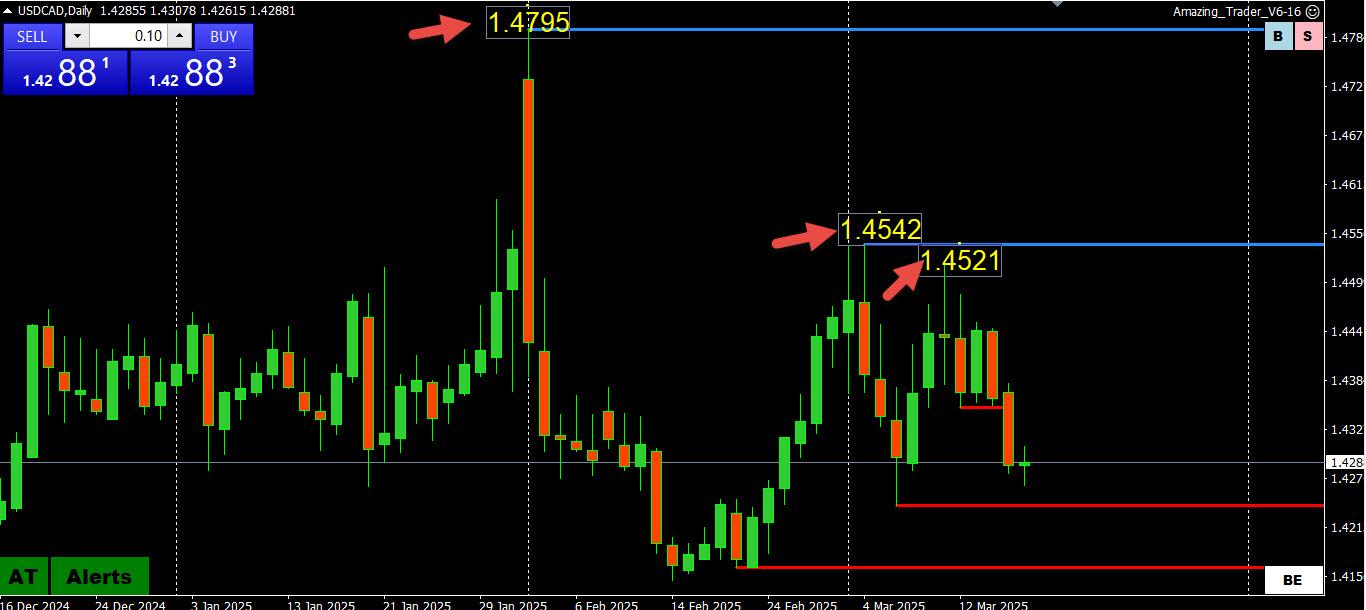
USDCAD 1.4297 as I type
after the inflation thinggie washed a few earlier today, I suggest that the BoC has already forgotten about it and is already twisting its bifocals to focus on tariffs game’s possible effects not just around April 2 but even some months further out.
—–
… “Mr. Bessent’s comments on Tuesday suggest the U.S. administration is leaning towards using one tariff rate for each country, and that it’s open to negotiation.
“What’s going to happen on April 2, each country will receive a number that we believe represents their tariffs. So for some countries, it could be quite low, for some countries it could be quite high,” Mr. Bessent said in an interview on Fox News.
He said that the number will include both tariffs other countries put on U.S. goods, and other measures that the administration believes disadvantage U.S. companies.
“We are going to go to them and say, ‘Look, here’s where we think the tariff levels are, non-tariff barriers, currency manipulation, unfair funding, labour suppression, and if you will stop this, we will not put up the tariff wall.’” …/..