USDJPY 4 HOUR CHART – Â Back above 148
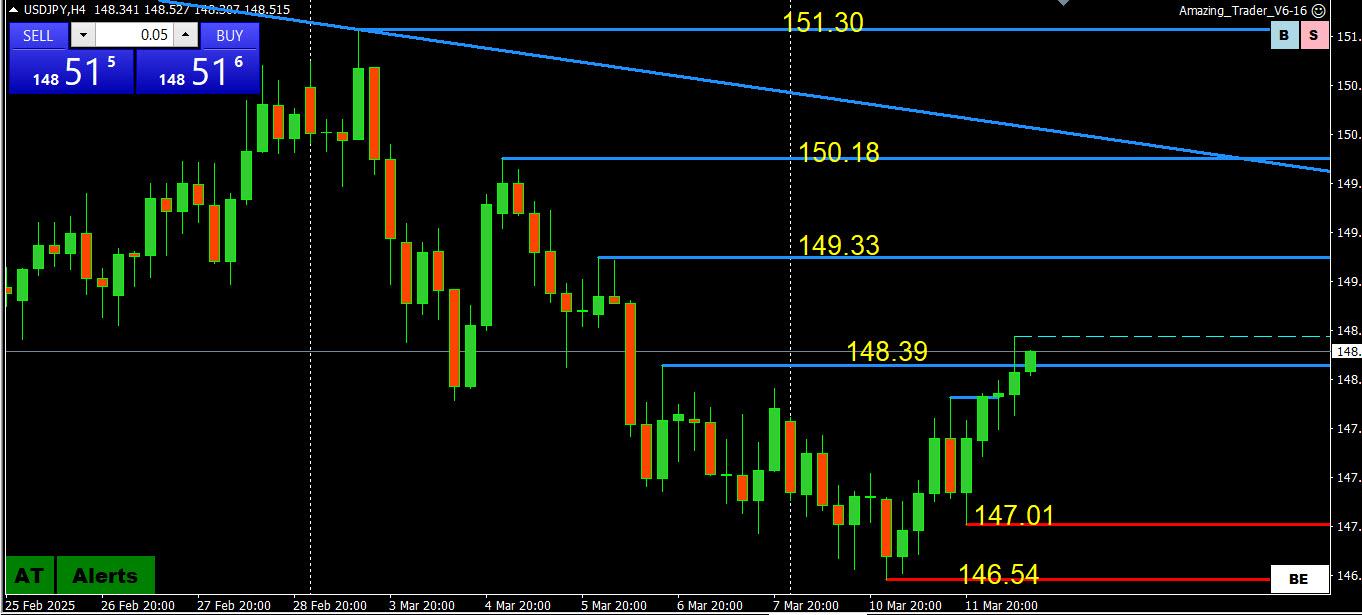
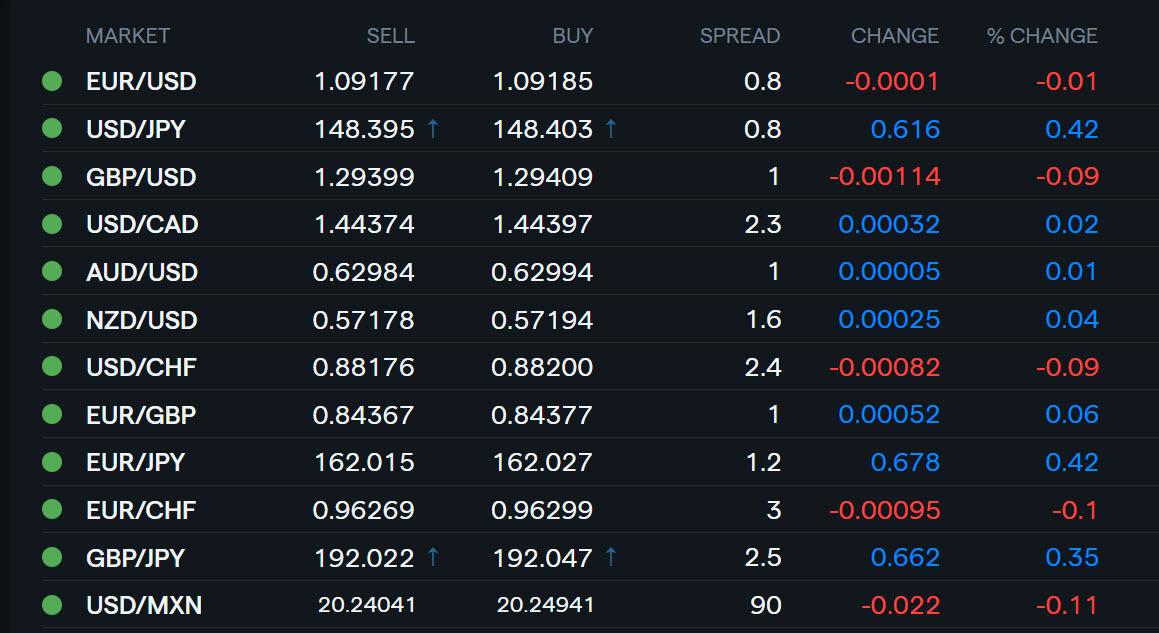
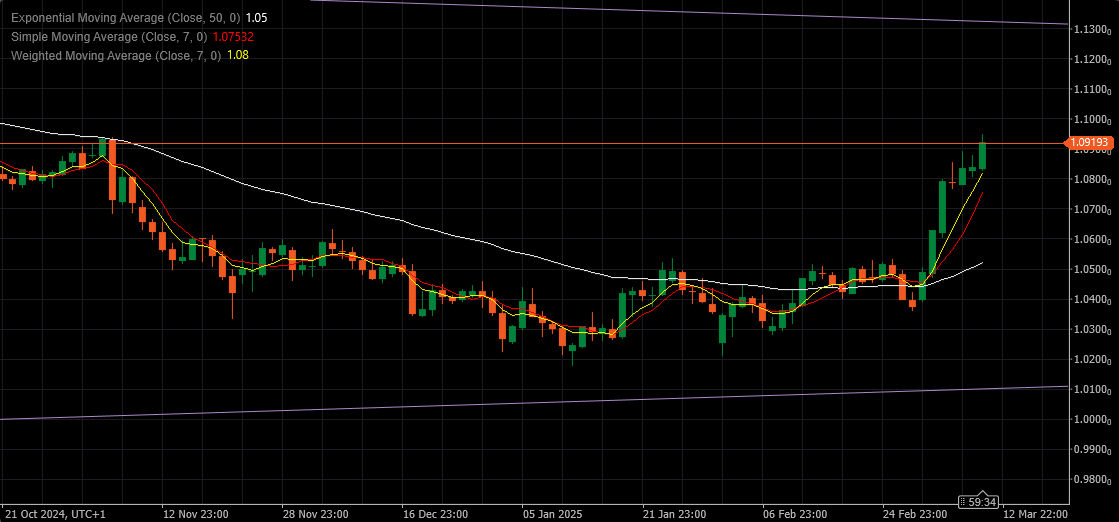
It is hard to fight real money flows that seem to be driven by JPY crosses, such ad EURJPY, which is building on yesterday’s breakout above 161.27 and helping to pull USDJPY above 148.
While damage is not fatal (i.e. it would need to move above 151.30 for an outside week), the solid move through 148.00-40 has broken the downward momentum
So, expect support if 148+ holds bit would need to get through 150.00-20 to suggest anything more than a retracement.
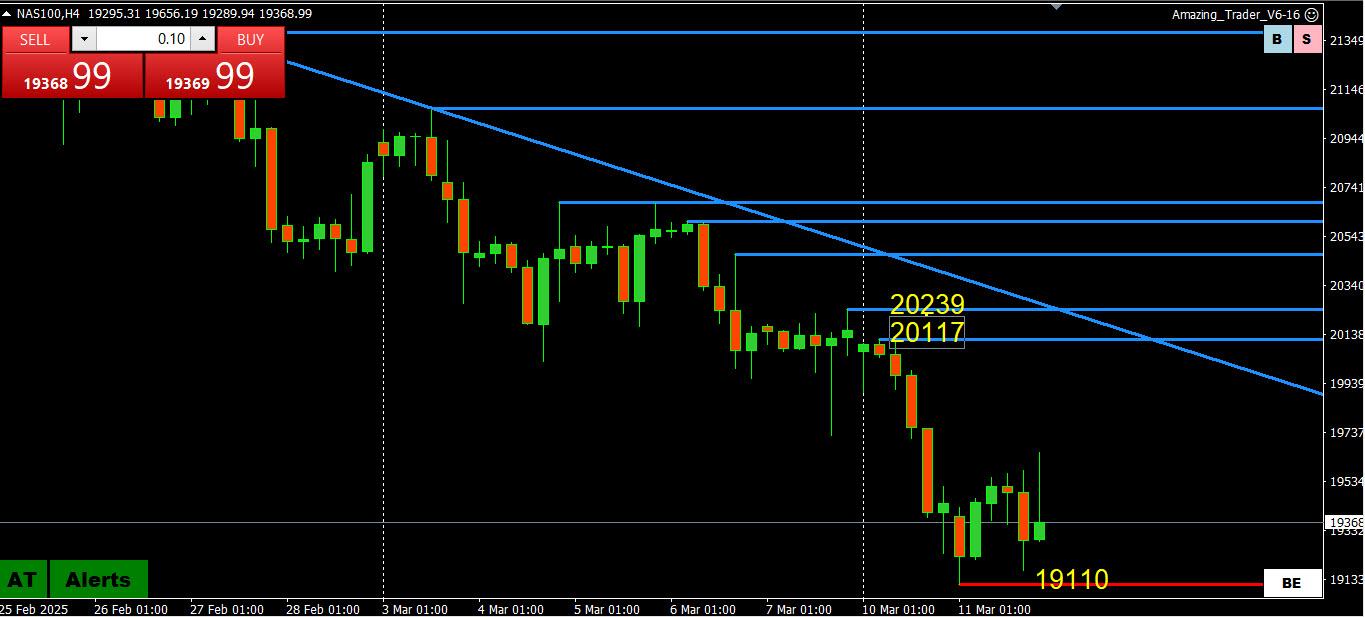
Watch the risk on/off mood as the former seems to be a factor today.
–
Using my platform as a HEATMAP shows
The dollar around unchanged except vs. a weaker JPY, which is also dowm on its crosses
Will have to see if this foreshadows a better showing for stocks, which are currently up, as it faces headwinds from….
— 25% steel and aluminum tariffs taking effect today
— Risk of retaliation (e.g. EU to Impose $28 bln in counter tariffs on US goods)
In the U.S. news programs have been leading with reports on the sharp falls in stocks
Looking ahead (see detailed previews)
US CPI, Bank of Canada rate decision
NAS100 4 HOUR CHART – Faint hope
Faint hope for a pause with support (and a higher low) above 19000 holding but ONLY firmly back above 20000 would slow/neutralize the risk.
As I noted,
As I have told our Amazing Trader (AT) subscribers many times, there is no reason to guess at a bottom (or top) until AT tells you to do so.
BTCUSD
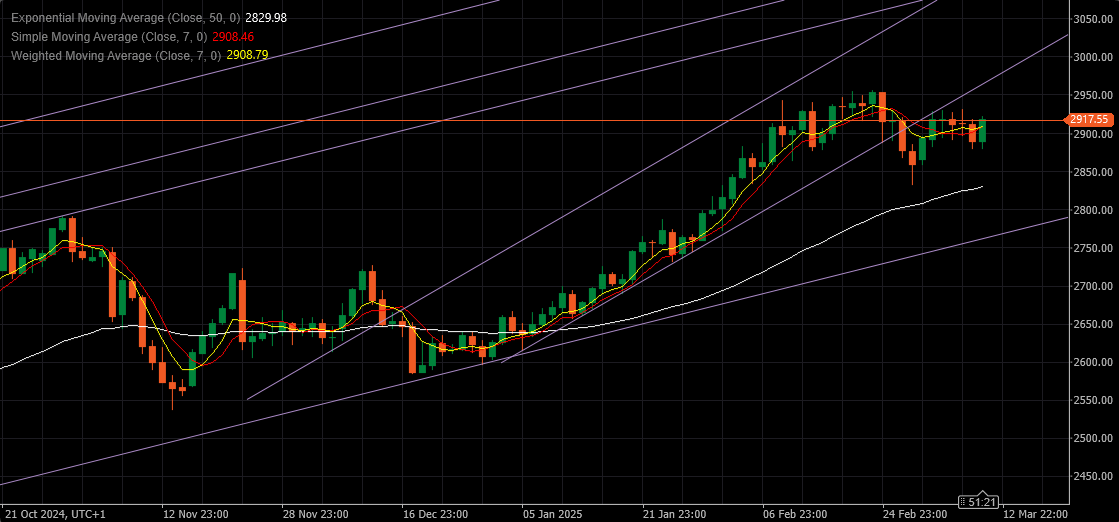
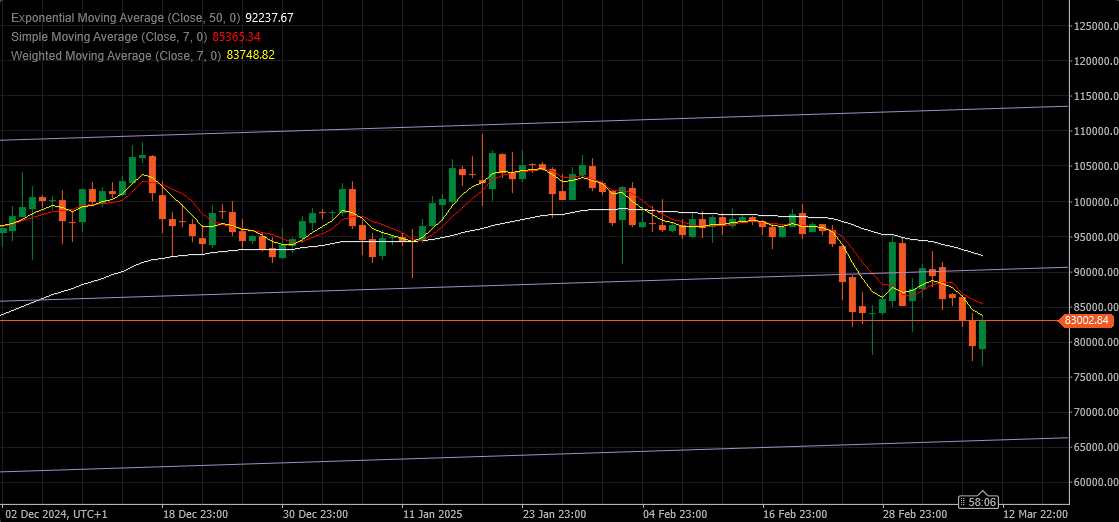
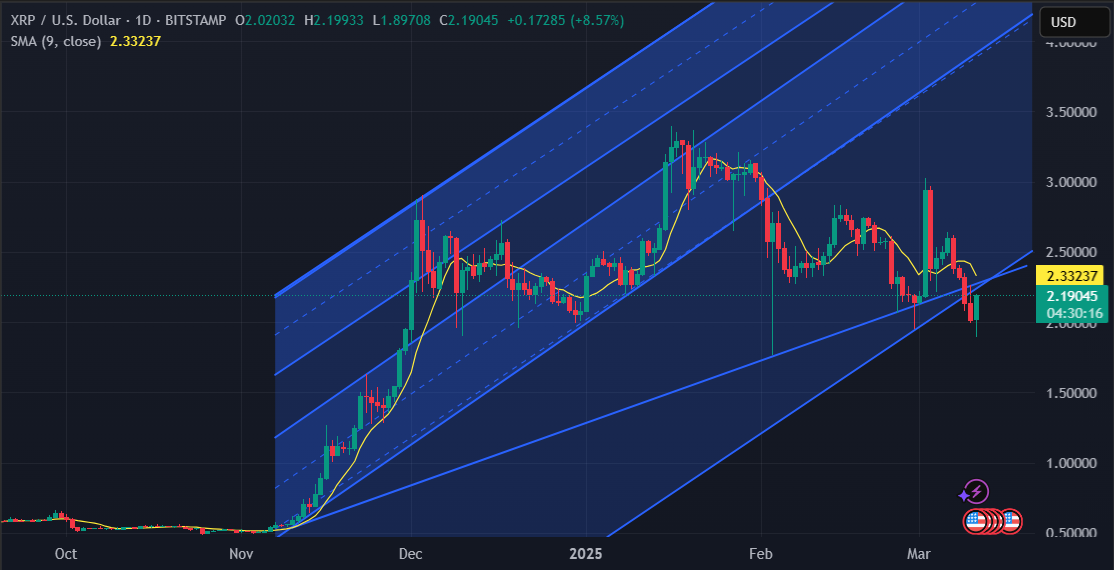
Bitcoin is trying to avoid the date with that 65K level, but has to take lots of it to do so.
Resistances at : 83.600, 84.750 & 90K.
One crazy thought – if BTC makes it above 90K…this week…we might even see 110K…had to say it….crazy or not, it would be in line with Bitcoins behaviour.
However, more probable is to see it between 65 & 75K.
NIO Inc.
And this is the first time that I feel relieved that my prediction didn’t come through 😀
NIO opened today with about 8% Gap to the Upside and broke back up above that line…
With high at 5.33 it came very close to the next barrier at 5.36.
I would like to see it above it for levels above 6.00
EURUSD may have gotten a lift from Ukraine news (stocks popped as well).
Posted in our blog
The stars seem to be lining up for a weaker USDJPYÂ but the move down has not been a straight line..
US500 DAILY CHART – WHERE WILL IT PAUSE?
As I have told our Amazing Trader (AT) subscribers many times, there is no reason to guess at a bottom (or top) until AT tells you to do so.
This is certainly the case with US500 as any attempts at a pause proving to be short-lived.
With that said, 5500 looks like an inviting target that has potential for a pause (note  the word potential). .
Otherwise, to slow the onslaught, big figures like 5600, 5700, 5800 would need to be regained and become support.
More trade war sabre rattling… USDCAD dips back below 1.45 (if I was the BoC I would be lurking above 1.45 but have no proof).
USDCAD DAILY CHART – TRADE WAR
With Trump’s battle with Canada turning into a trade war (scroll below), USDCAD is back above 1.45
This is clearly the pivotal level with key resistance at 1,4548 (use 1.4550) the last barrier to the major 2025 high at 1.4793.
Logic says no one wins in a trade war (why pickon Canada?) but so far logic has not won out in the new Trump era.
How to trade it? Just keep an eye on headlines and the market’s reaction to the latest news for clues..
BoC rate decision tomorrow…
© 2024 Global View