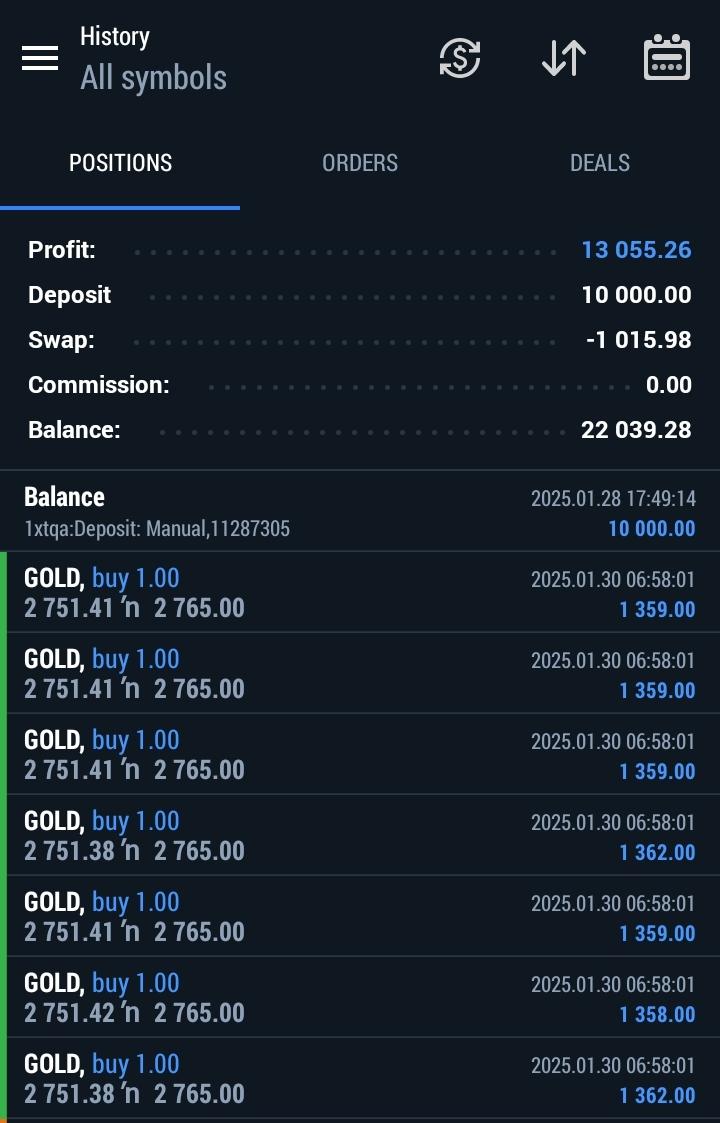
It seems to be a buy bias for the xau/usd (GOLD) pair. as it has conssistently climbed upwards since whenever. I just looked at the monthly chart of the Gold and I discovered that it has actually been climbing since 1996. This is an upward move of almost 30 years.
The market opened overnight at 2785 and immediately went on a sell. Hours later it retraced and went long from the lowest point at 2772. It has consistently gone long from then till now at 2814. My analysis is that it will still pull up to the price area of 2818 at least. This has to be because of the strong buy candle on the 15′ chart ,further confirmed on the 30′ these 2 are strong to determine what happens on the hourly chart.
We are gonna be in for a long buy bias on the Metal Gold this week. Gold might buy all the wat with little retracements.
REMEBER THIS IS NFP WEEK. Tread carefully, do not overtrade. A little 2-5% of your capital is good risk Management.
USD surges and stocks dip after post-Trump actions; RTY underperforms
Good morning USA traders, hope your day is off to a great start! Here are the top 5 things you need to know for today’s market.
5 Things You Need to Know
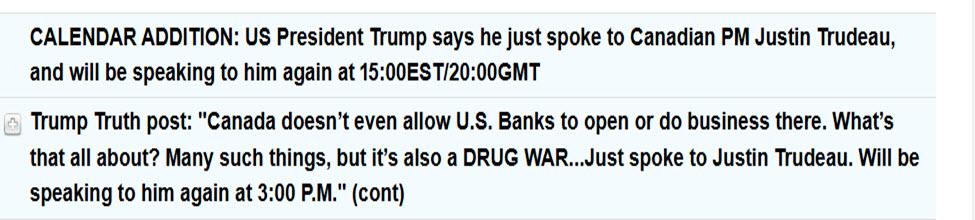
Trump signed a tariff order that confirms 25% tariffs on Mexico and Canada (with the exception of 10% on Canadian energy products) and 10% additional tariffs on top of existing levies for China.
Canada has announced retaliatory action, Mexico is expected to announce its measures later today, China is to challenge tariffs at the WTO.
European bourses sink as markets react to Trump tariffs and threatens the EU; RTY underperforms.
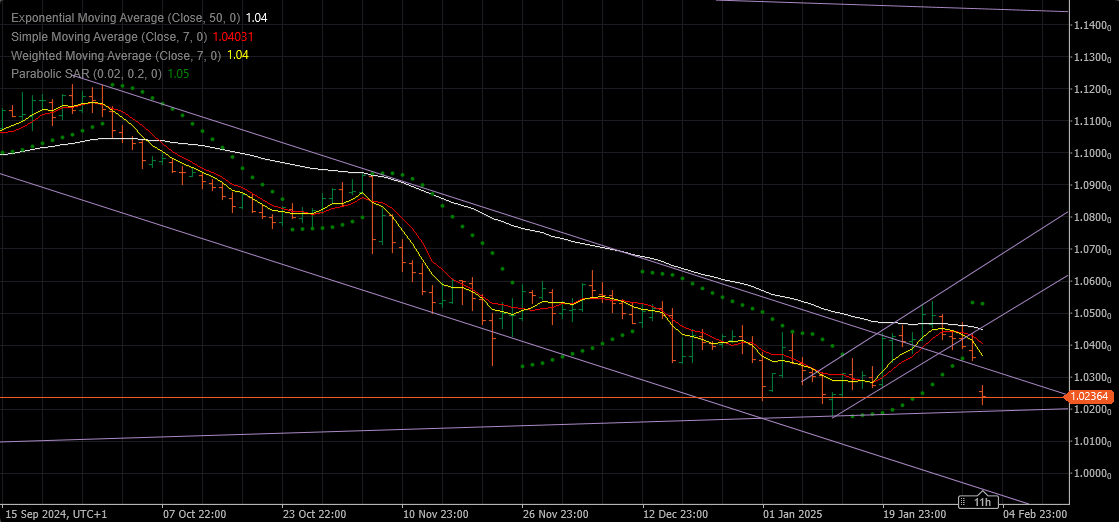
USD surges and Bonds gain post-Trump tariff actions, JPY bolstered by safe-haven appeal, EUR/USD sits on a 1.02 handle.
Crude firmer, precious metals subdued, but base metals slip on tariffs and Chinese PMI miss.
GVI 10:23 / and when they stop bending as you say and start to not just rebel but try to counter-bite donald just might double down. folks , here in canada, and especially of the libtard and trump hater types (cnn adherents) still do not appreciate how things will turn from gentle goading to an all-out war.
there d be a load of profit opps if canada starts to see job losses in excess of half a million and go towards a million +
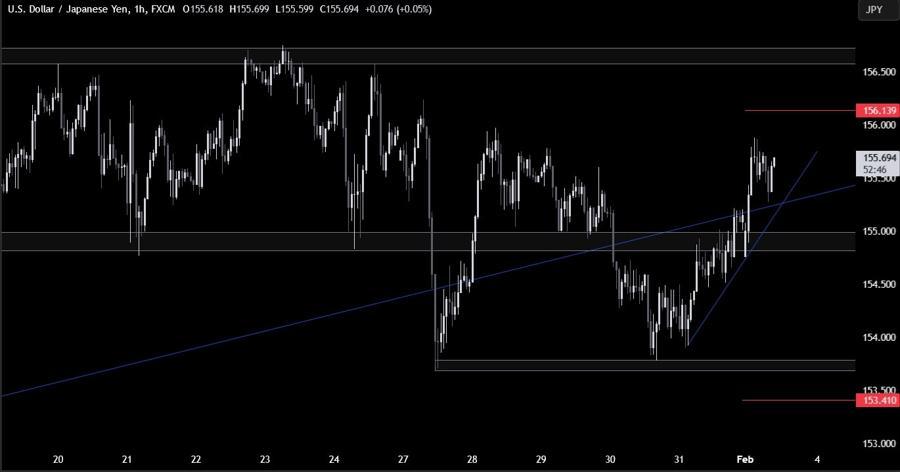
1 hour chart, we can see that we have a minor upward trendline defining the current bullish momentum. The buyers will likely continue to lean on the trendline to push into new highs, while the sellers will want to see the price breaking lower to start targeting new lows. The red lines define the average daily range for today.
LONDON (Reuters) – A look at the day ahead in U.S. and global markets by Alun John, EMEA breaking news correspondent, finance and markets.
Investors fled from stocks and rushed to dollars in Monday trading in Europe and Asia, as they scrambled to process the consequences of President Donald Trump putting larger-than-expected tariffs on top U.S. trading partners.
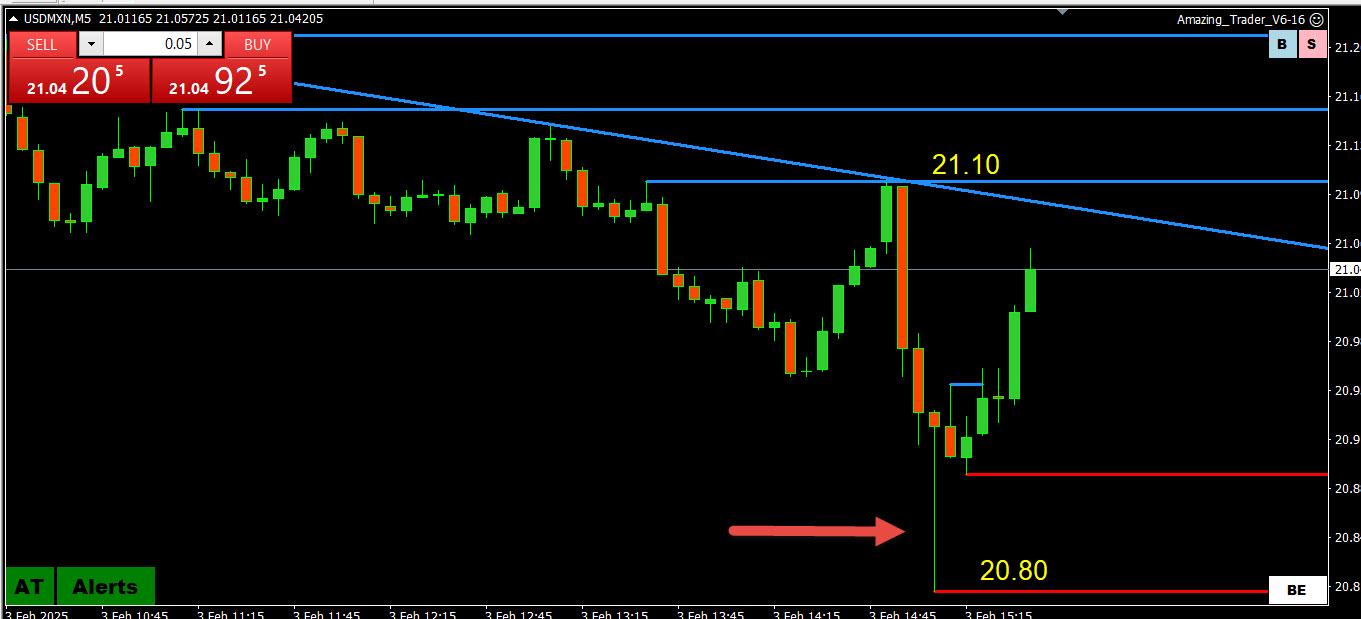
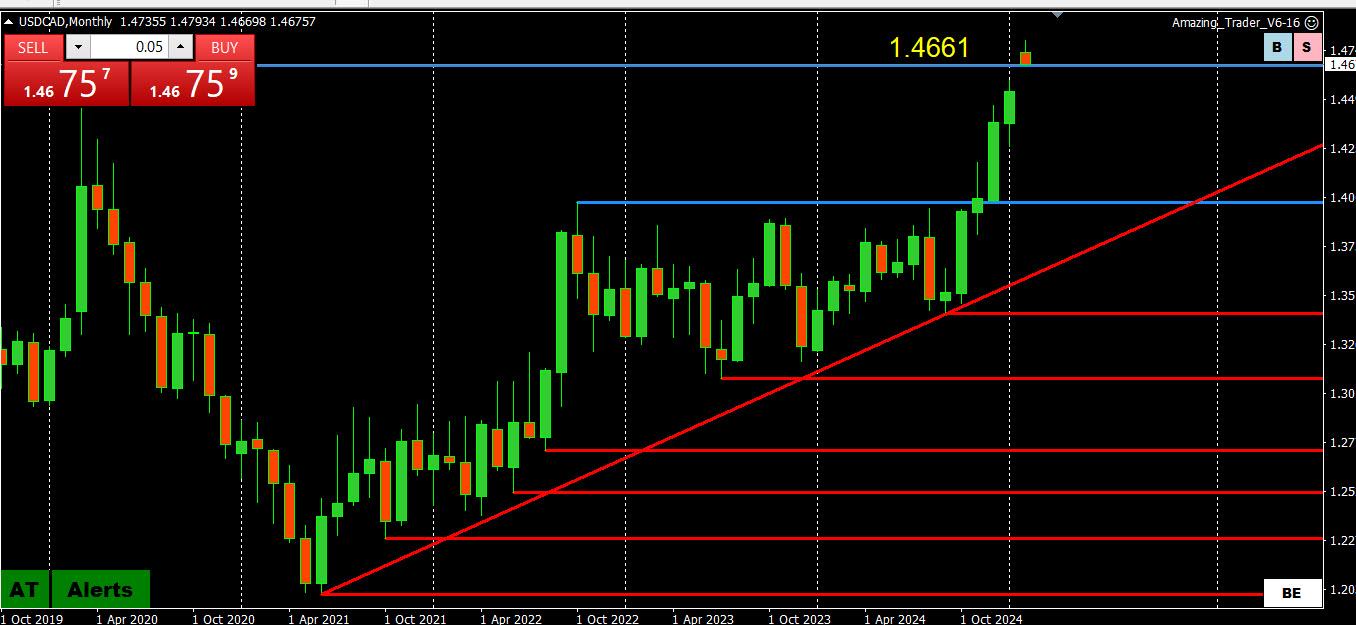
Welcome to Febryary Traders, we all saw the loop (big leap) in the markets across all currency pairs. Market is gonna be very volatile this week, remember it’s Non Farm Payroll (NFP) week. This is 12noon and all currencies are moving in different directions but USD/CAD catches my eye.
This currency closed last weelk at 1.4555, and opened very high this week, there is a big jump on the chart to price 1.4702, from where it climbed (bullish trend) to an all high price of 1.4792 before its sudden decline to price 1.4666. I see a further decline (sell) in price, which is to cover the gap it created. Again from my price action knowledge, the last 2 hourly candles that closed on the CAD pairs are sell candles, signalling a further decline in price.
I see price falling to the price area of 1.4555 at least. Today is Monday and we should take things very slow. Market is just returning from a break and it is not yet at full capacity so don’t over Leverage your Account. Risking 2-5% of your Account is ideal to secure your capital.
This one you need Jay to answer to you – my approach is very different ,and even we both come to similar results most of the time I wouldn’t recommend combining them without proper study.