Investing.com — President Donald Trump said the United States would impose 25% on tariffs on imported goods from Canada and Mexico as soon as Saturday.
The president flagged a trio of issues including inadequate border control to stem the flow of illegal immigration as well as fentanyl drugs coming into the country and the large U.S. trade deficits with both countries.
Trump also said he would decide on Thursday night whether oil imported from both countries would be subject to the tariffs.
GOOD NIGHT BOBBY
ACORDING TO THIS TECNICAL ADVICE I SHOULD BE LOOKING FOR ENTRY AFTER MAJOR LOW OR HIGH WAS SWEEP AND BUT SOMETIMES WILL MIS ENTRY ,WAS THERE TIME TO WATCH OUT FOR OR ANY FORMATION TO AVOID BEEN VICTIM OF GETTING STOP OUT
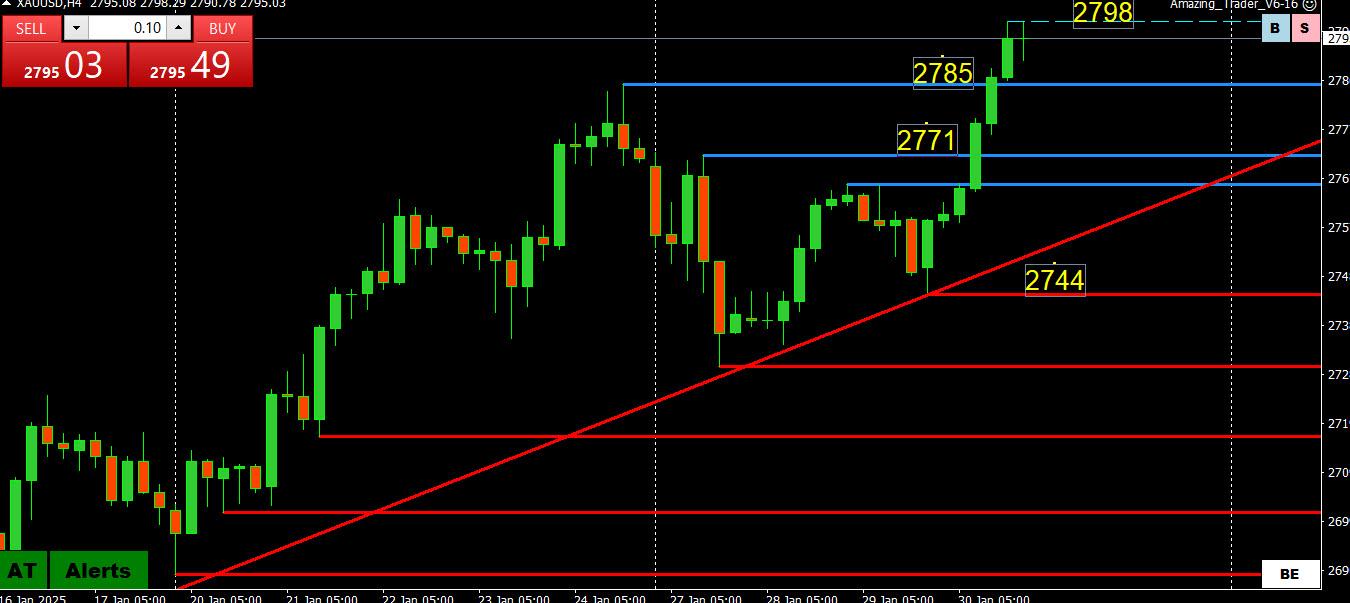
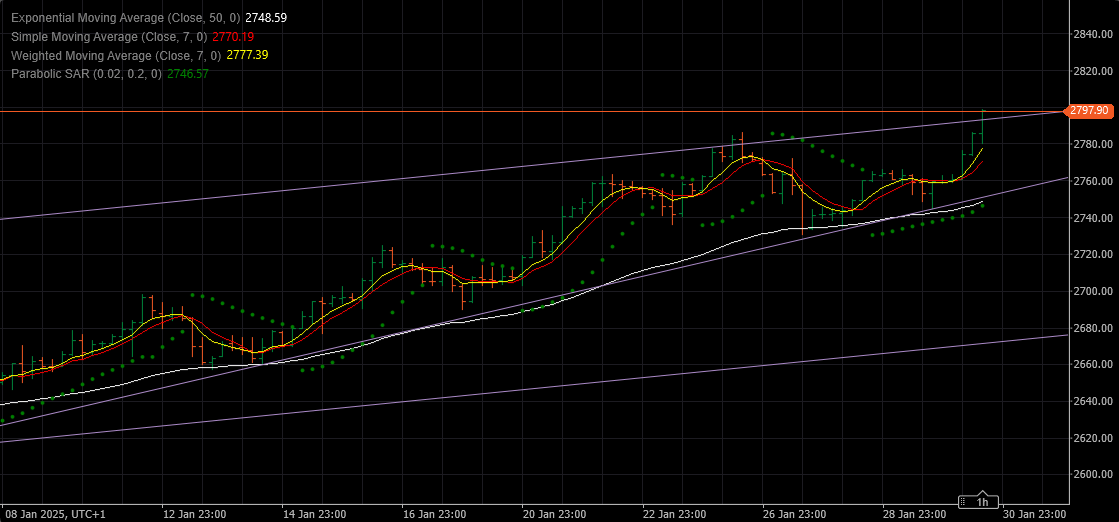
Break of 2790 sets a new record high that needs to hold 2865-90 as support to target 2800 (a key pivotal level and potential obstacle)) and potentially above.
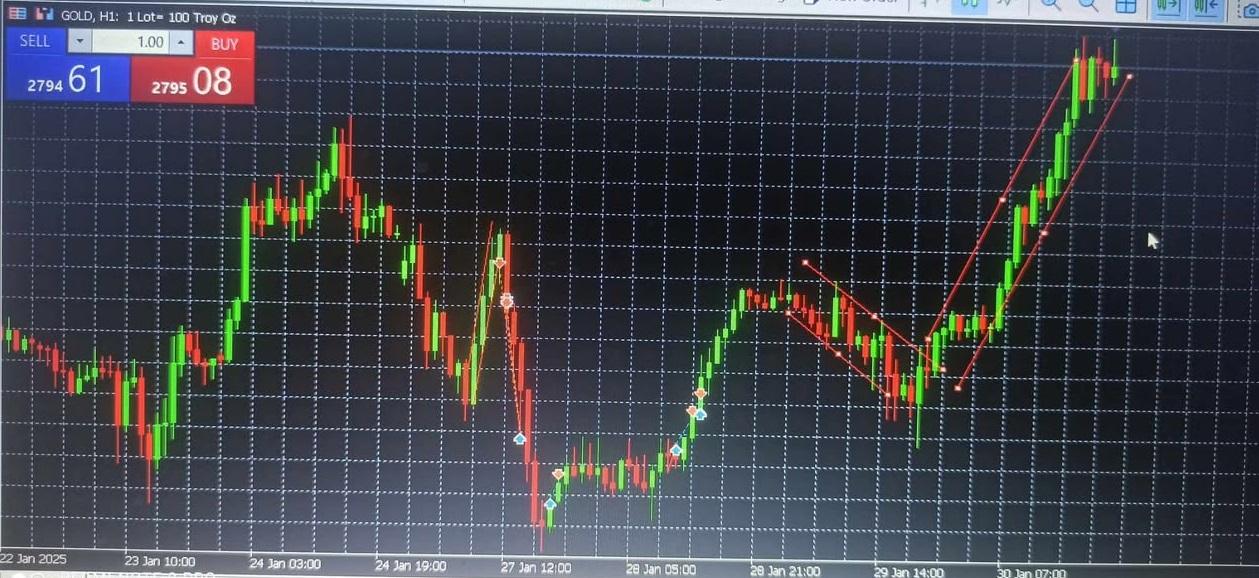
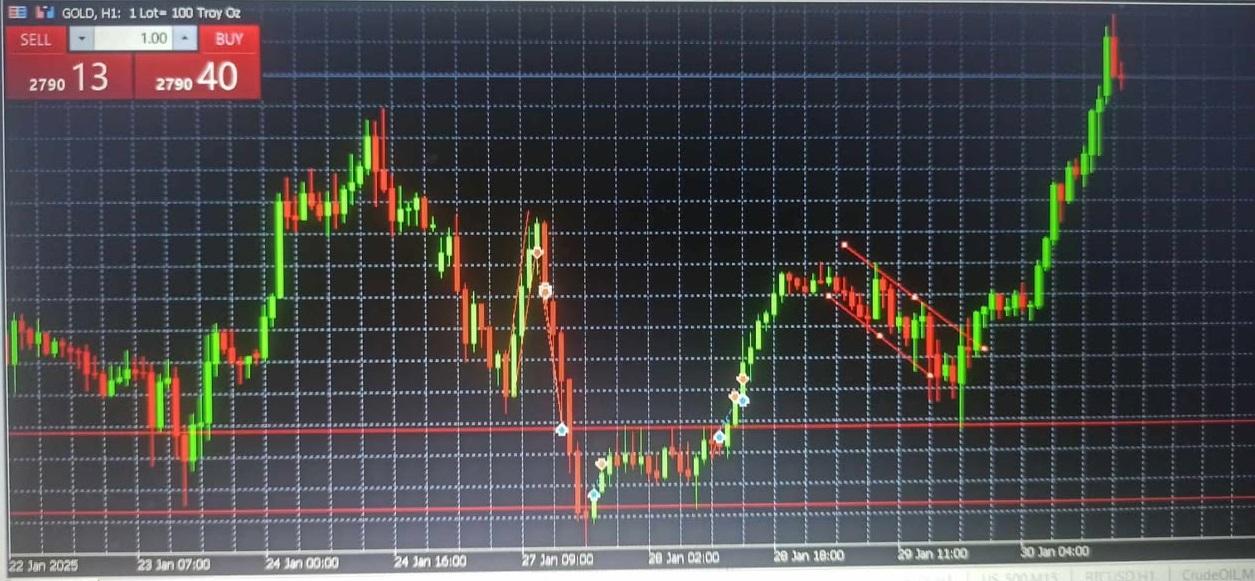
This is perfectly 7pm Nigerian time, and the gold (xau/usd) has just spoken. This is another buy. Looking at the hourly chart. the candles are well set for a buy. the just formed candle is heading long while the candle that formed an hour before then (5pm) closed at 2788. Now as I said, the direction of the last candle dictates where the trend is going.
The 7pm candle was a buy candle and suggests continuing buy bias. I think the gold will hit 2797 at least before retracing. It has begun going long as i speak so a few pips is good and I will be exiting at 2797. Do not be greedy. A little pip at a time is good. Don’t risk more than 2-5% of your capital at a time. I will see you soon. This is my analysis.
Thanks,
TOPNINE.
Trading Tip 7: Why You Should Drill Down on Your Charts
As I have noted many times, identifying the side to trade is more than half the battle in putting on successful trades. In this regard, one way to do this is by drilling down on your charts as I will explain in the following:
The term “drilling down” means starting at longer time frame charts and then moving down to shorter time frames to find opportunities to trade on what I call the “strong side” of the market.
In this article I will show how I drill down using my Amazing Trader (AT) charting algo
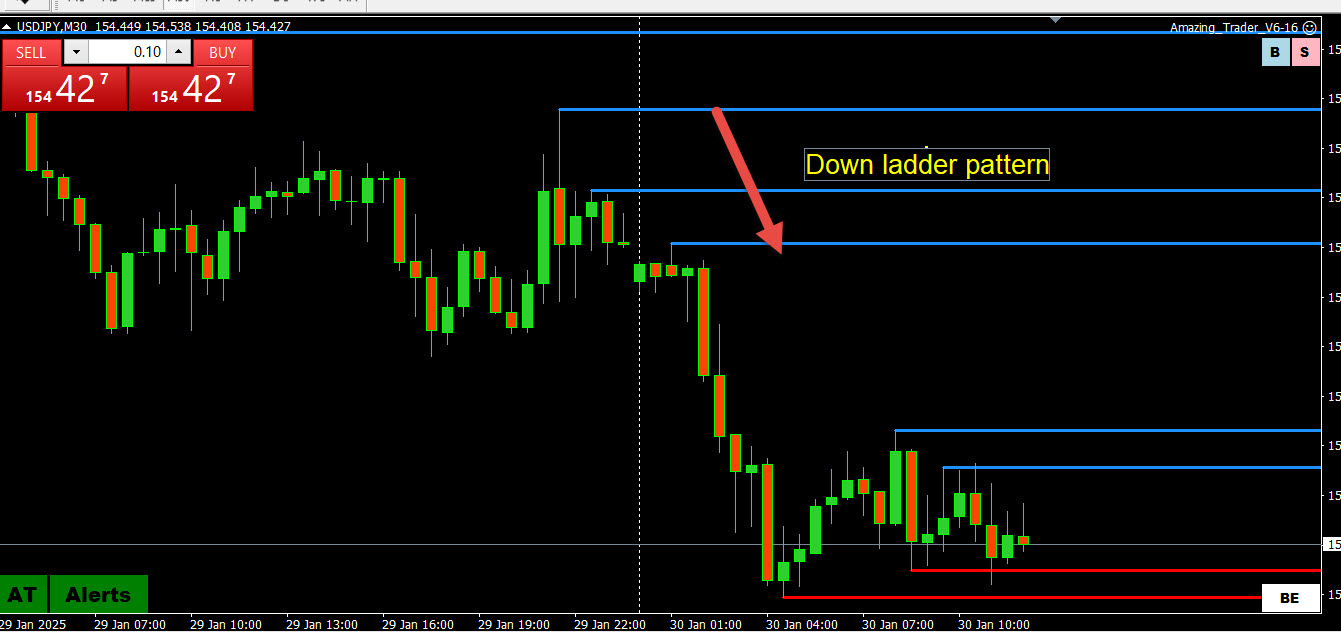
The process is designed to look for confirmation of a trend or episode on multiple time frames, and then find an AT ladder pattern to trade. Note, an AT ladder pattern is characterized by rising red lines (uptrend) or falling blue lines (downtrend)
Down AT Ladder Pattern: USDJPY 30 minite chart
Drilling down time frames:
Daily => 4 hour => 1 hour => 30 minute > 15 minute => 5 minute depending on what time frame you prefer to trade.
If you see AT ladders building in the same direction on say daily, 4 hour and 1 hour charts, you can assume there is an imbalance tilted in that direction
What the means for trading is that the institutional type traders who trade larger size and use longer term time frames will be looking to buy dips (ladder up) or sell blips (ladder down).
What this means for you is when multiple longer-term time frames confirm each other (I.e. AT ladders pointed in the same direction), you can identify the side to trade from, which is where big money traders are looking to do the same.
You then drill down time frames until you see an AT ladder pattern on the time frame you prefer to trade (e.g. 30, 15, 5 minute) and employ the ladder strategy to trade (explained in detail when you subscribe).
Here is an illustration from a video I created awhile ago with insights that have stood the test of time.
NOTE, you don’t trade blindly as you need to be aware of any levels, especially on longer term time frame charts, that would dampen or reverse the current episode.
Get more tips like this when you Join GTA – for FREE – CLICK HERE
This is 5pm Nigerian time and GOLD (XAU/USD) is having a swell time climbing high. Shat started as a slow climb early this mornig at price 2758.62 has slowly and consistently climbed to the all high 2796.59 currently and will still go higher.
the cascading and upward alignment of the last 6 candles on the 30′ chart shows the buying power is muuch and will continue in that direction for a while. price will get to at least 2802.51 before it retraces in my opinion. A culmiation of NEWS since yesterday plus today’s monetary policy statememt at 2;15PM WITH THE unemployment claims that was released at 2:30pm has directed the gold in the same direction.
I forsee stronger buys at least in the interim. I will take a buy from its current position and exit at 2802 for a few pips.