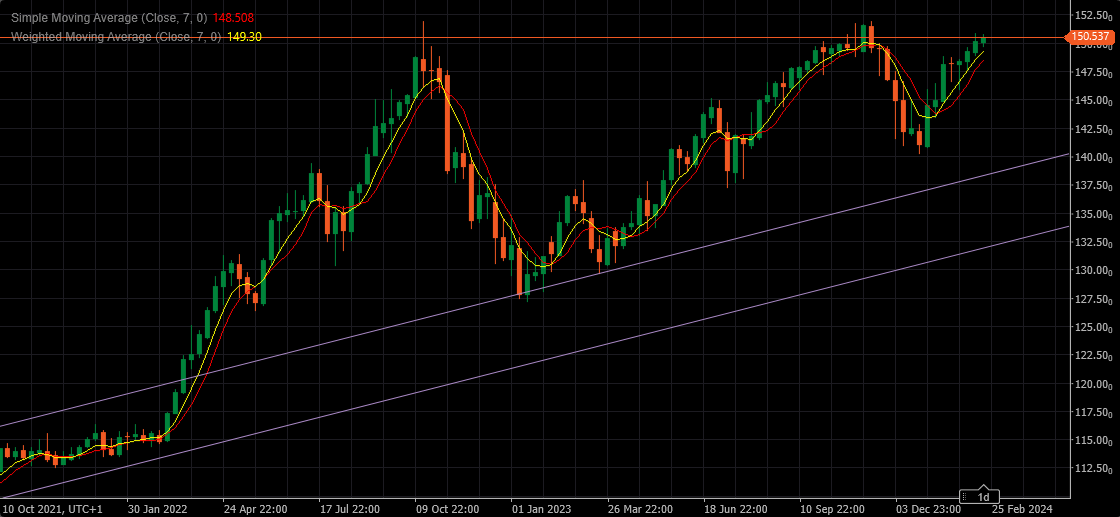
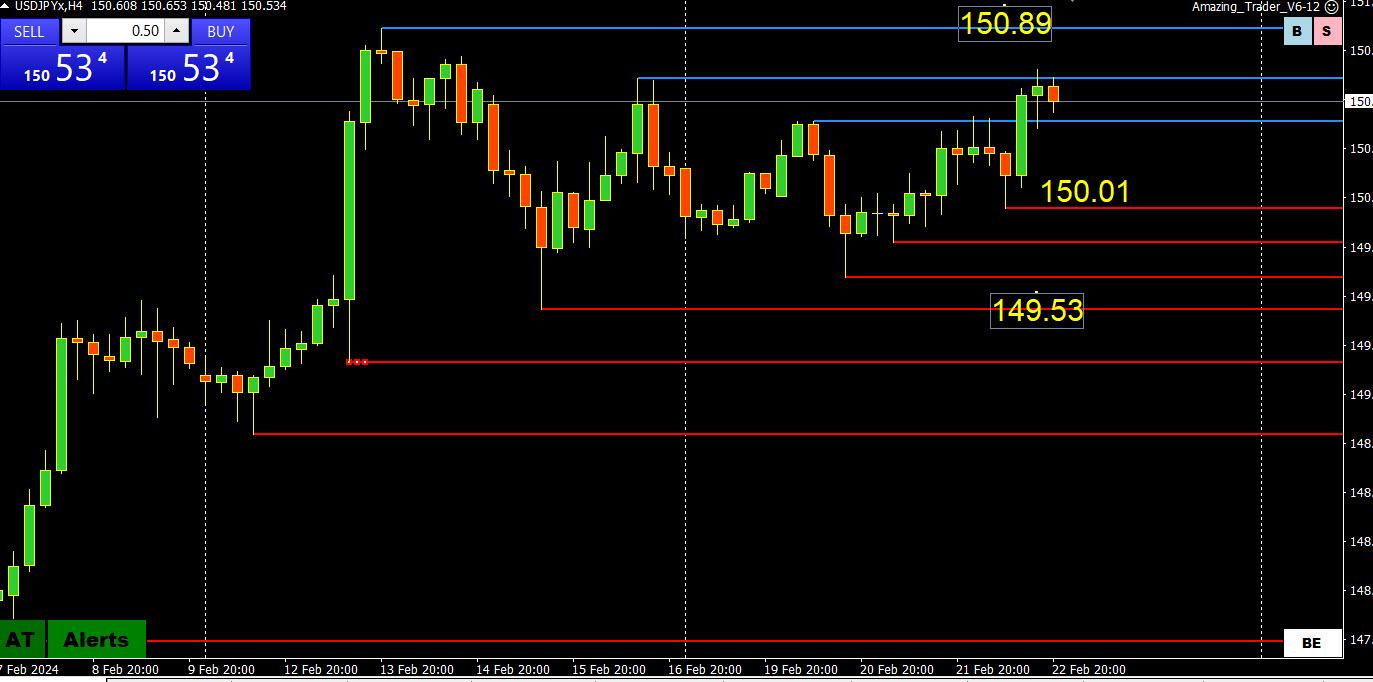
There is not much to say about this pair, except that Pattern wise it is destined to try 152.000 area.
Problem comes from the fact that we have already double top in place, and if rejected for the third time, it will be not only technically visible, but would mean that BOJ decided to put Money where their Mouth is.
We can always see sharp drops in JPY , followed by even sharper ascent . But any possible drop below 145.000 and consequently 143.300 would put the whole Up trend in question.
FED trying … new theme: more evidence (allegedly data driven)
–
Fed’s Waller wants more evidence inflation is cooling before cutting interest rates – Jeff Cox, cnbc
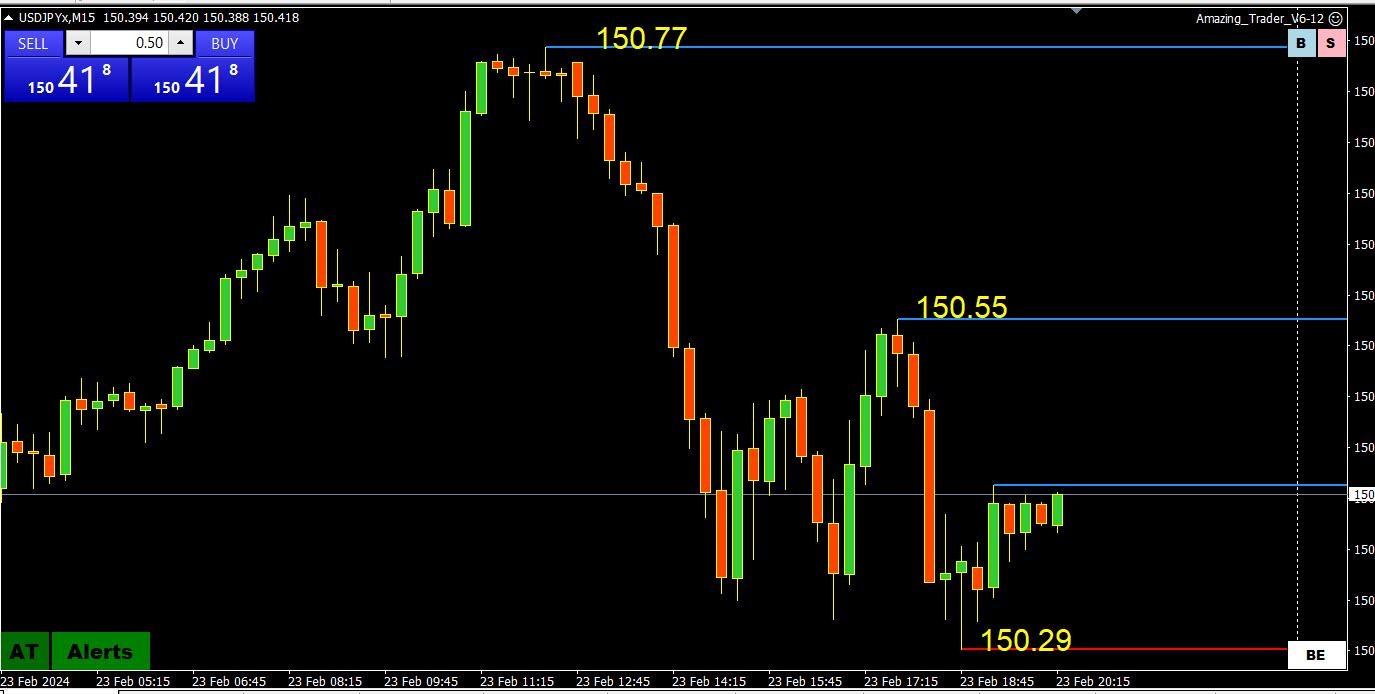
Monthly yields are up, yearly yields are down. Not a unanimous vote for the day. Believe Aud/Jpy should hold 98.65. Like long side of Eur/Jpy from 162.50 area still though not expecting much. See 150.30 area holding.
bobby 1:41 / tol game these frothy puppies is replete with risk
–
to mitigate risk to your wallet u d have to be a “whale” with tons of margin (haha) or collusionability with your say 3 selections out of the “7 magnificant”s or … a very intimate insight into money in or out flows
NVIDIA – Whole planet talks about it….it is Viral…it is Hysterical
Even my wife asking about it ( and she couldn’t give a **** about it ) …my younger daughter asks about it ( at least she is just worried if the price for her next generation graphic card will go up )
Till yesterday it was Gold – half a planet bought it on the top….
Now the other half will buy NVIDIA stocks …on the top
Me….I don’t give a flying ****….EUR goes up, EUR goes down…that makes my day…
hear ye hear ye peasant
—
Bloomberg.com
Fed’s Harker Cautions Against Cutting Interest Rates Too Soon
Federal Reserve Bank of Philadelphia President Patrick Harker said that it will likely be appropriate to cut interest rates this year,…
Federal Reserve Bank of Philadelphia
Economic Outlook: We Are in the Final Mile of the Marathon
Good afternoon! It is a pleasure to be back with you once again, and I thank today’s organizers and sponsors for making it all possible.
MarketWatch
Fed’s Harker: Don’t look for any interest-rate cuts ‘right now and right away’
The Federal Reserve is getting close to cutting interest rates but a move in the near-term is unlikely, said Philadelphia Fed President…
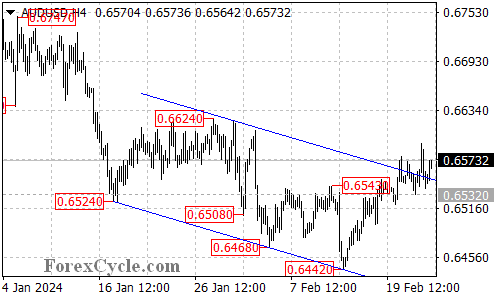
AUDUSD Breaks Free: Uptrend Resumption or False Dawn?
AUDUSD has clawed its way back from recent lows, breaking above the confines of the falling price channel on the 4-hour chart. This bullish breakout raises questions: Has the downtrend truly ended, or is this just a temporary reprieve?
Uptrend Resumed: Channel Breakout as Confirmation?
Channel Breach: The break above the falling channel, established from the 0.6870 high, signifies a potential shift in momentum. This suggests a possible end to the downtrend and the start of a new uptrend from the recent low of 0.6442.
Potential for Continued Rally:
Resistance Levels: If the uptrend continues, the next target for AUDUSD could be the 0.6624 resistance level. Surpassing this hurdle would open the door for further gains towards 0.6700, solidifying the bullish momentum.
Support Levels to Watch for Pullbacks:
Initial Support: The initial support to watch is at 0.6532. A breakdown below this level could indicate a loss of momentum and a potential pullback towards the 0.6500 area.
Key Support: A further breach below 0.6500 could trigger a decline towards the previous low of 0.6442, potentially signaling a resumption of the downtrend.
Overall Sentiment:
The technical picture offers a mixed outlook for AUDUSD. The breakout from the channel suggests a potential trend reversal, but confirmation will come from holding above the 0.6532 support and pushing towards the 0.6624 resistance. Monitoring the price action around these key levels will be crucial in determining the pair’s next move.
Disclaimer: This analysis is for informational purposes only and should not be considered as investment advice. Please conduct your own research before making any trading decisions.
I chuckled at the disproportionality
–
cnbc f/page:
Nvidia shares pop 16% after AI-fueled bumper earnings
3 surprises from Nvidia earnings help justify a one-day $250 billion boost to its market value
Tax evasion by millionaires and billionaires tops $150 billion a year, says IRS chief
Monedge tah would be FED’s no. 2
–
US Fed official warns of inflationary risk of over-consumption
Washington (AFP) – A senior Federal Reserve official said Thursday that the US central bank will likely start cutting interest rates “at some point this year,” but warned against the potentially inflationary effect of over-consumption.
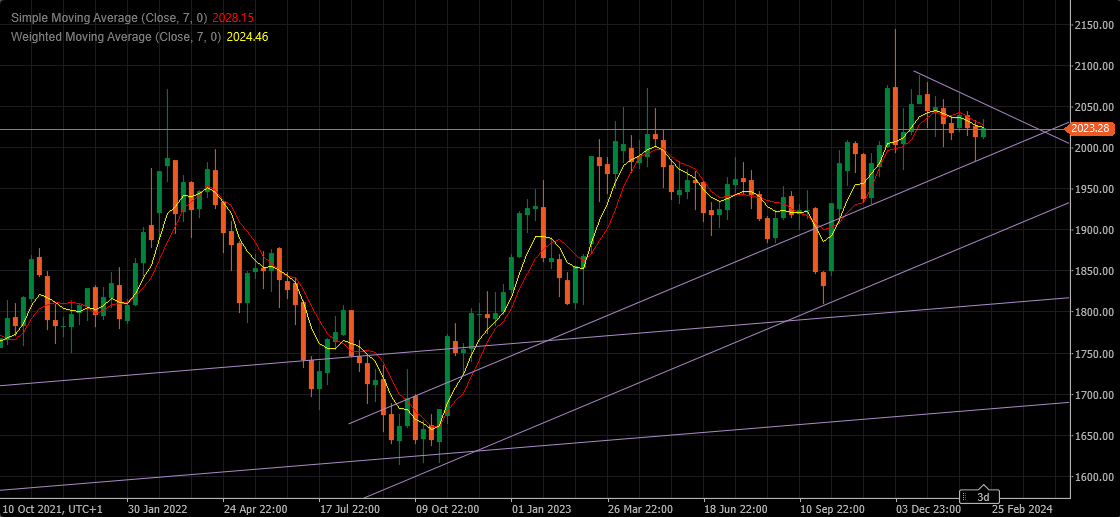
There is a chance that 1990.00 might hold for another attempt for Highs, but overall pattern suggests that Gold is destined to go in a correction phase.
It is more likely that we’ll first see 1900.00 then new high.
For those that trade CFD’s this might be an opportunity to go Short.