A look at the day ahead in U.S. and global markets from Mike Dolan
Rancorous geopolitics continues to grab most headlines again this week, but it’s creeping anxiety about a slowing U.S. economy that’s unnerving investors most about Wall Street stocks.
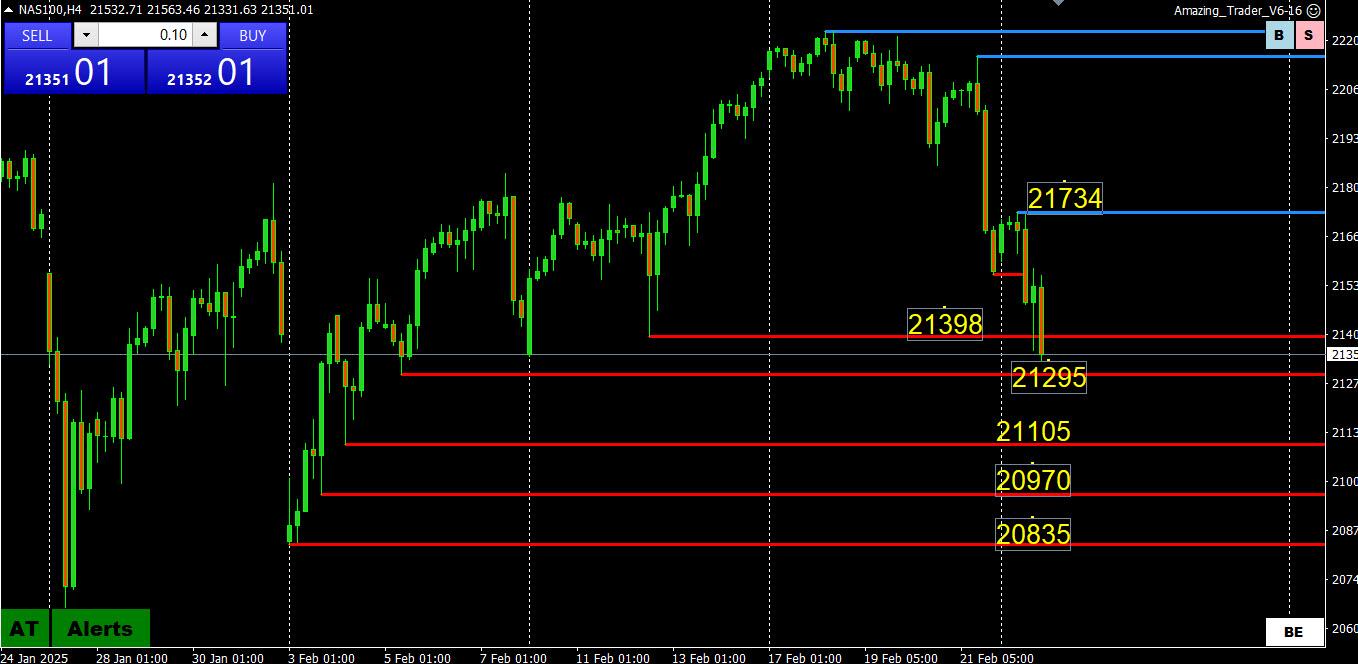
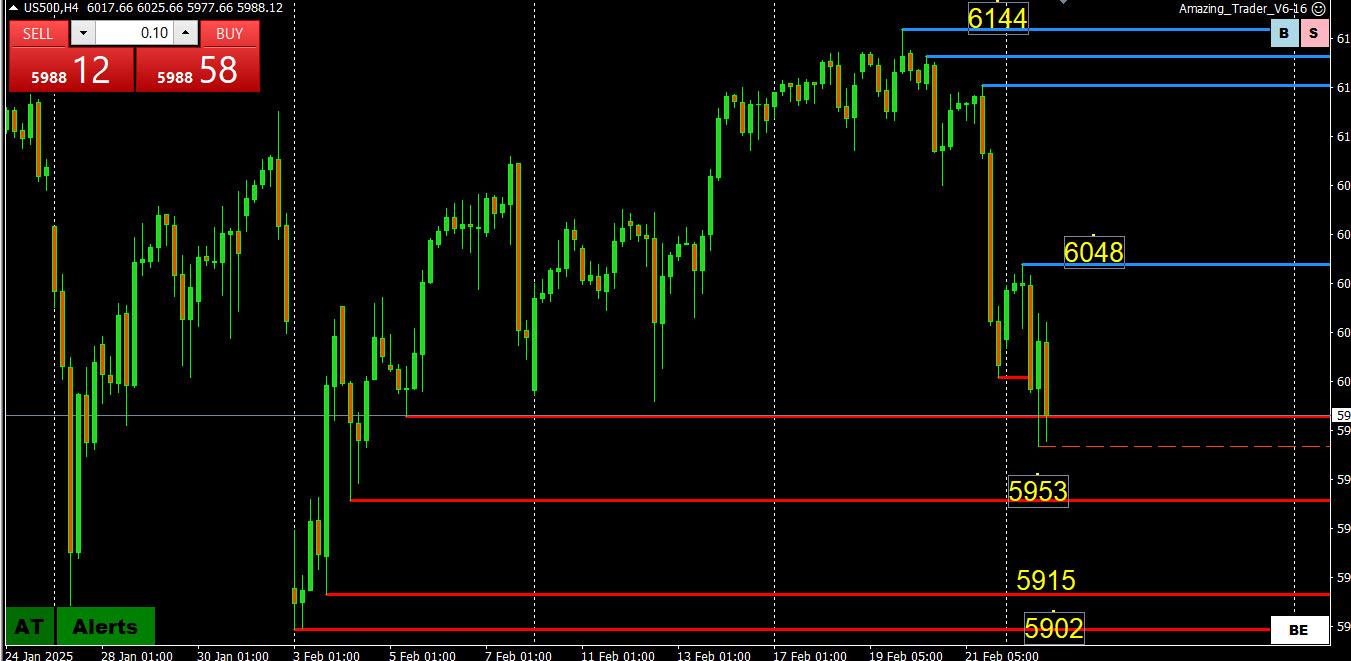
Wary of Wednesday’s results from megacap chip giant Nvidia (NASDAQ:NVDA), the S&P500 lost its 6,000 handle for the first time in three weeks on Monday and both the tech-heavy Nasdaq and small cap Russell 2000 are now negative for the year to date. Morning Bid: S&P500 loses 6,000 handle amid U.S. slowdown fears
NQ underperforms amid reports US is looking to tighten chip controls on China, USD lower whilst USTs gain
Good morning USA traders, hope your day is off to a great start! Here are the top 4 things you need to know for today’s market.
4 Things You Need to Know
European bourses are mostly firmer after opening entirely in the red following a negative APAC handover; though US futures remain in the red.
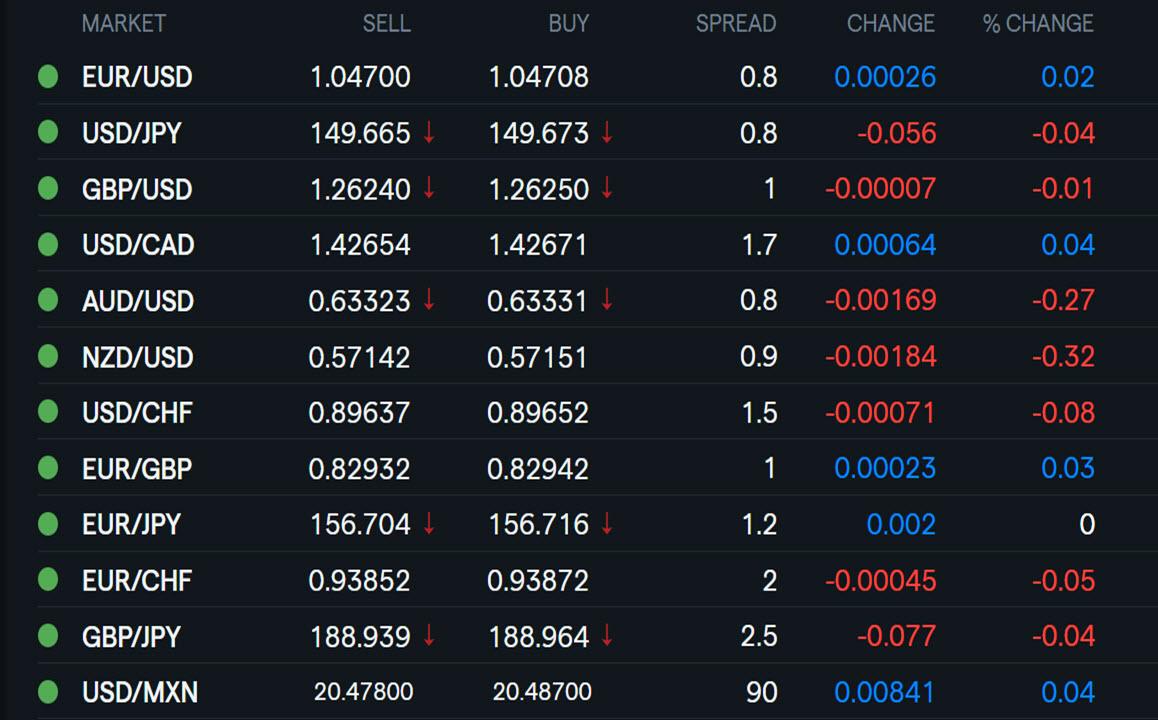
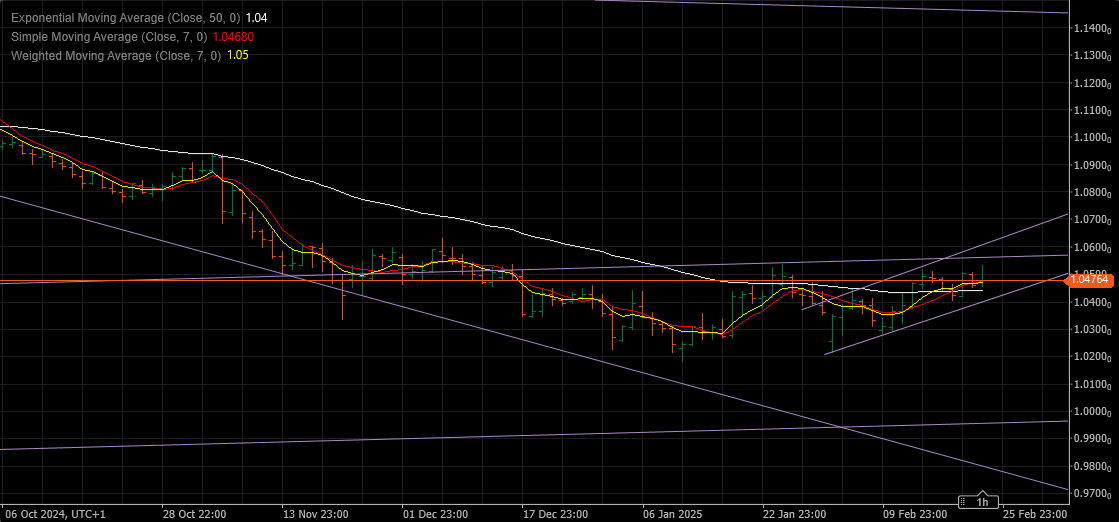
DXY is a touch lower, EUR/USD stuck on a 1.04 handle, Antipodeans lag.
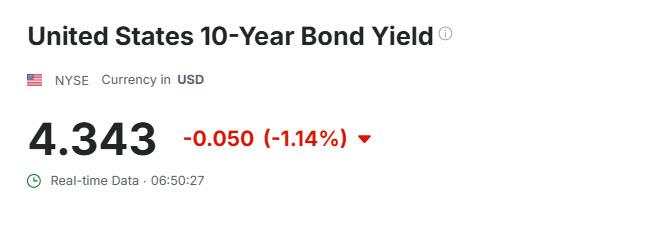
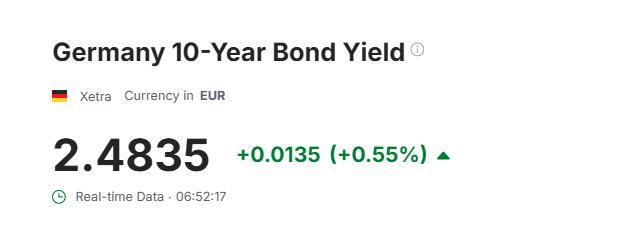
Diverging performance with USTs higher whilst Bunds are lower awaiting coalition and/or spending updates.
Choppy trade in crude with metals subdued despite the softer Dollar.
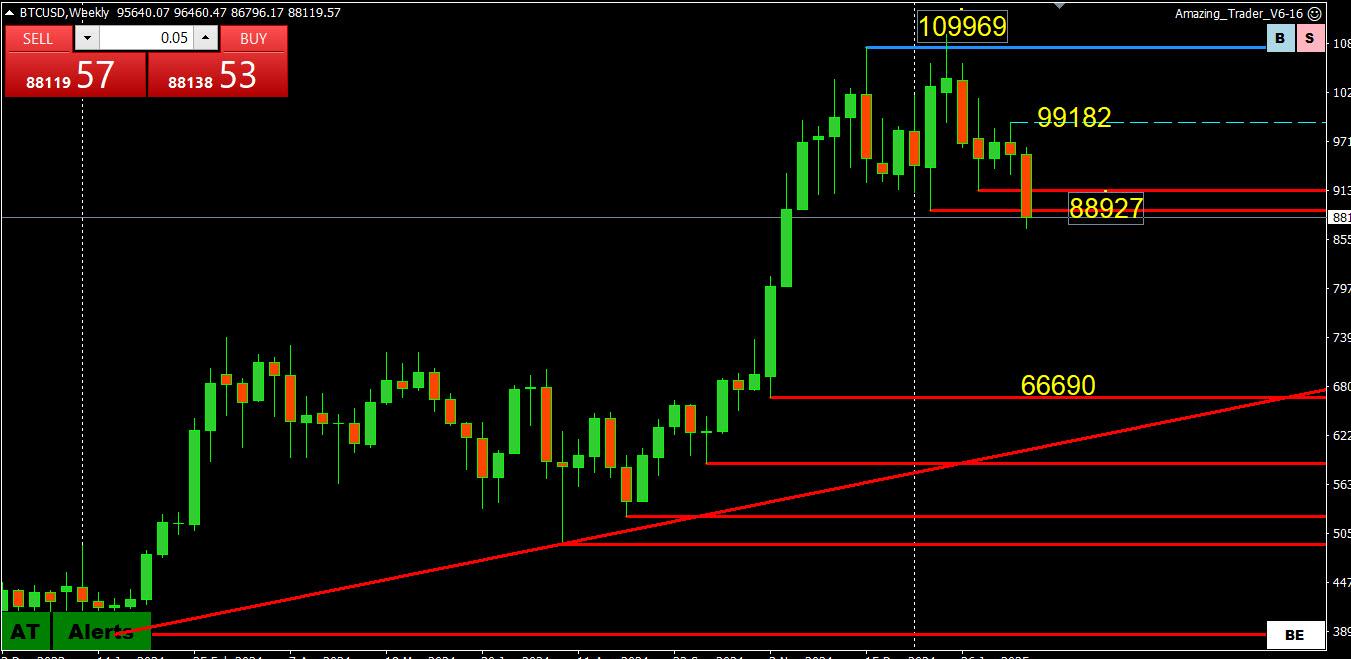
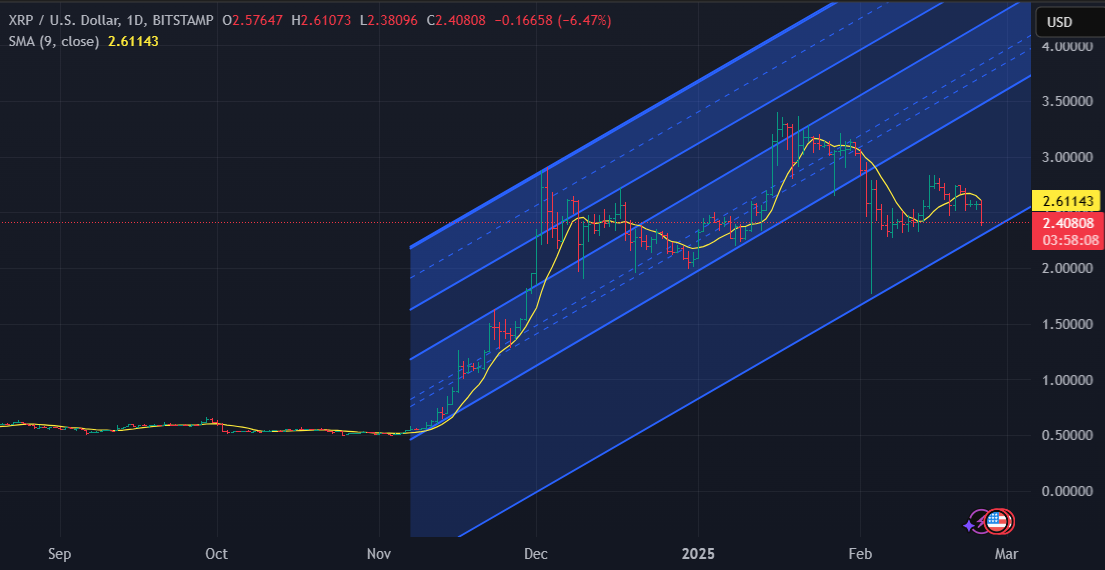
One thing is clear and that is that cryptos are not acting like safe havens.
With a 21% fall from its record high to today.s low, BTCUSD needs to get back above 88927 to avoid exposing a true lack hole on the downside.
When looking at BTC ae an observer ae I don’t trade it, I prefer to look at 10 big figure ranges using pivotal (psychological) levels as the volatility makes technical levels eawy t get broken. .
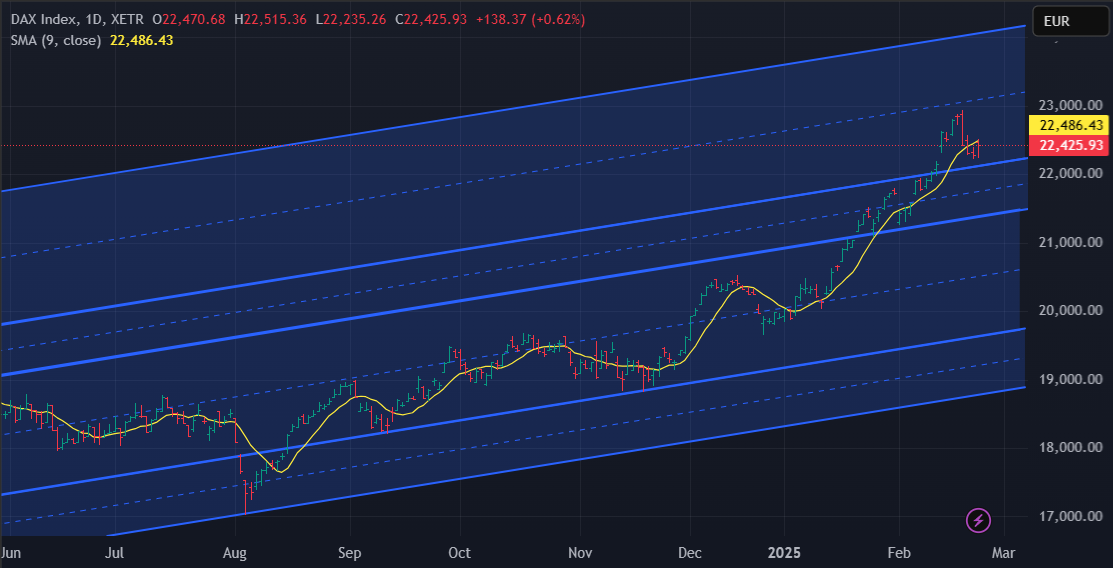
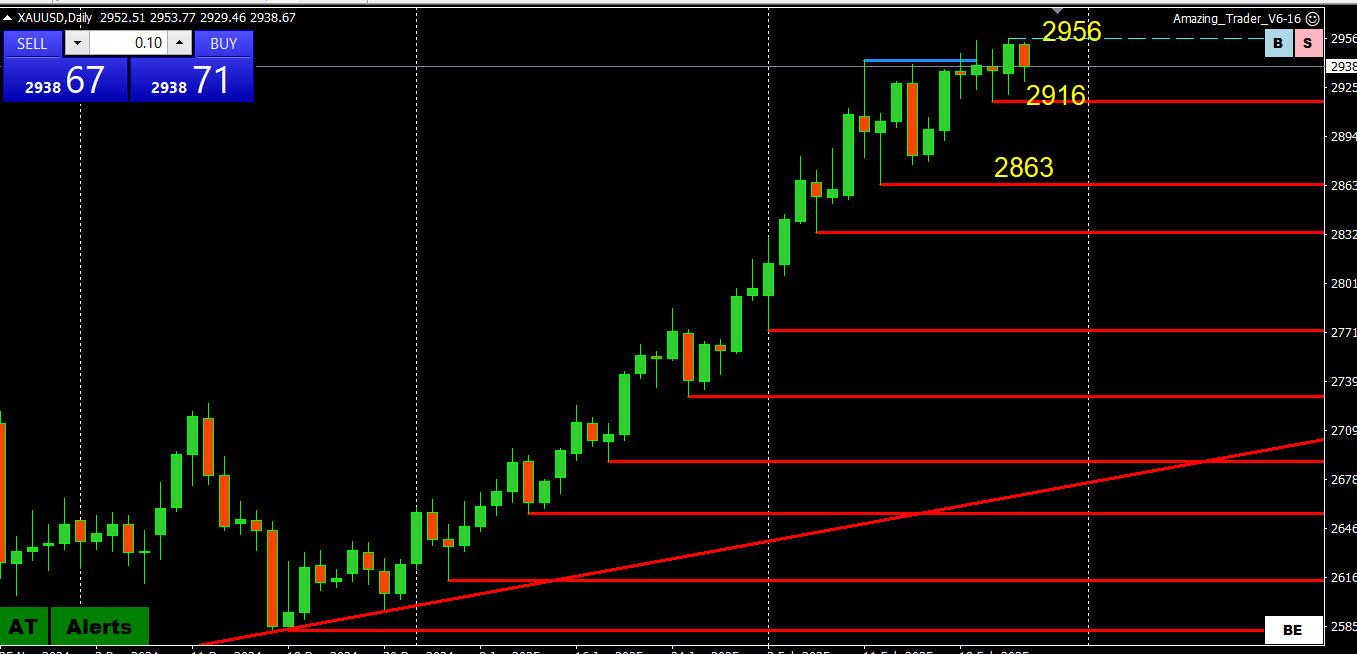
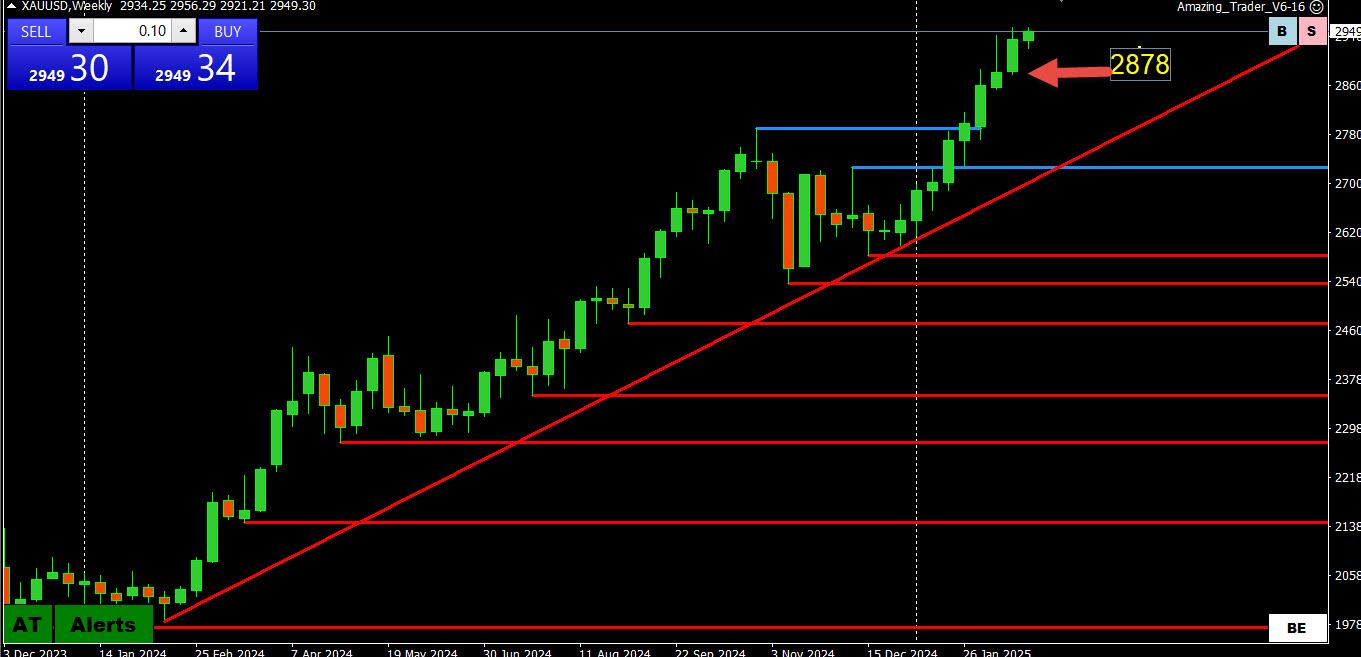
Looking at this chart and trying to be objective, it has taken a lot of effort just to extend the record high from 2942 to 2956.
This would normally suggest a tired trend but given the failure to follow through on retracement attempts, it id hard to suggest anything but a pause until the pattern changes.
In this regard,
– Would need to establish 2950 as support to send a signal for a run at the –
– Would need to move below 2879 (last week’s low) to break the 9 week upo pattern,
Today February 25th 2025 at exactly 11am, price is at 2938. Market went to an all low price of 2929 and went the highest in 24 hours at price 2954. Based on analysis market is on a buy bias and is still going up.
This is a temporary bearish move as market will soon take an upward move. Let’s Trade carefully and place a Trade with risk of between 2-5% risk. Good money Management will preserve your capital.
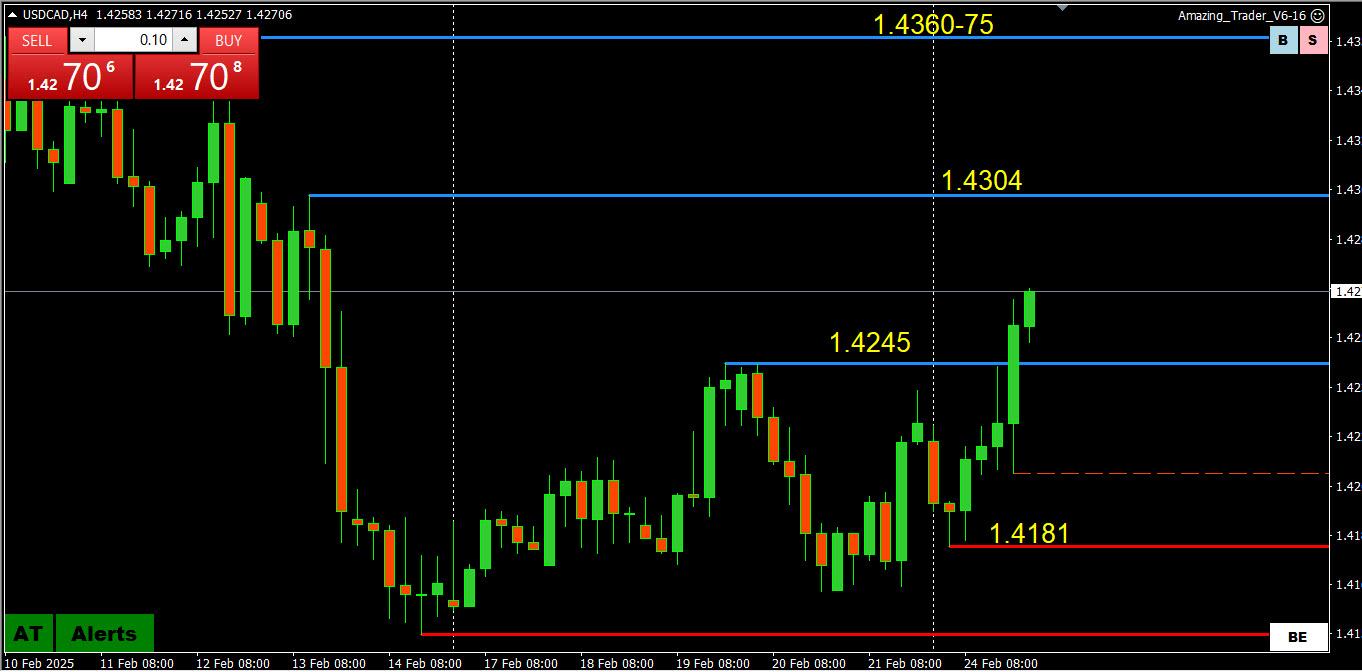
“Trade tensions weigh on Canada’s banks as they get set to report earnings
Trump’s proposed tariffs could compel the Big Six to report higher provisions for credit losses,” say analysts
9 green UP candles in a row and record highs each week, including the startt of this week. Betting on a retracement following through will remain a low probability bet until/unless this pattern is broken.
.
Addendum:
To break this weekly pattern, 2878 would need to be broken.
To make a run at 3000, 2950 would need to becoe solid support
Classic Amazing Trader (AT) intra-day reversal pattern off the low of the day, one that repeats with any instrument your broker offers on its platform and in any time frame.
Without going into details on this amazing program, see below


 .
.