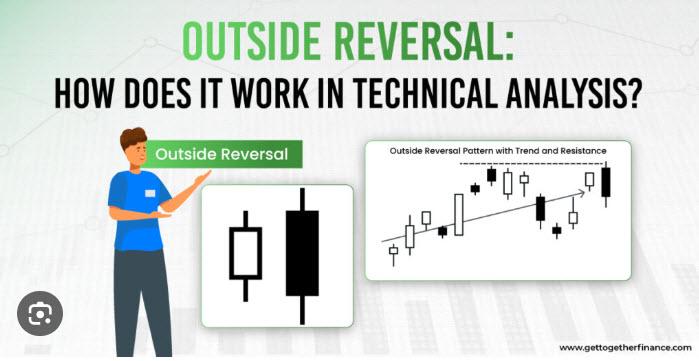
An Outside Month Key Reversal is a technical analysis pattern that signals a potential trend reversal in financial markets, often seen in stocks, commodities, or forex.
What is it?
It happens when the price action of the current month:
1. Trades both higher and lower than the previous month’s range (making an outside bar).
2.Closes above the previous month’s high (for a bullish reversal) or closes below the previous month’s low (for a bearish reversal).
Bullish Outside Month Key Reversal
• Current month low is lower than the previous month’s low.
• Current month high is higher than the previous month’s high.
• Close is above the previous month’s high.
• This signals a possible uptrend reversal.
Bearish Outside Month Key Reversal
• Current month high is higher than the previous month’s high.
• Current month low is lower than the previous month’s low.
• Close is below the previous month’s low.
• This signals a possible downtrend reversal.
Key Points:
• The larger the volume, the stronger the signal.
• It works better after a prolonged trend.
• Monthly charts provide stronger signals than daily or weekly charts.
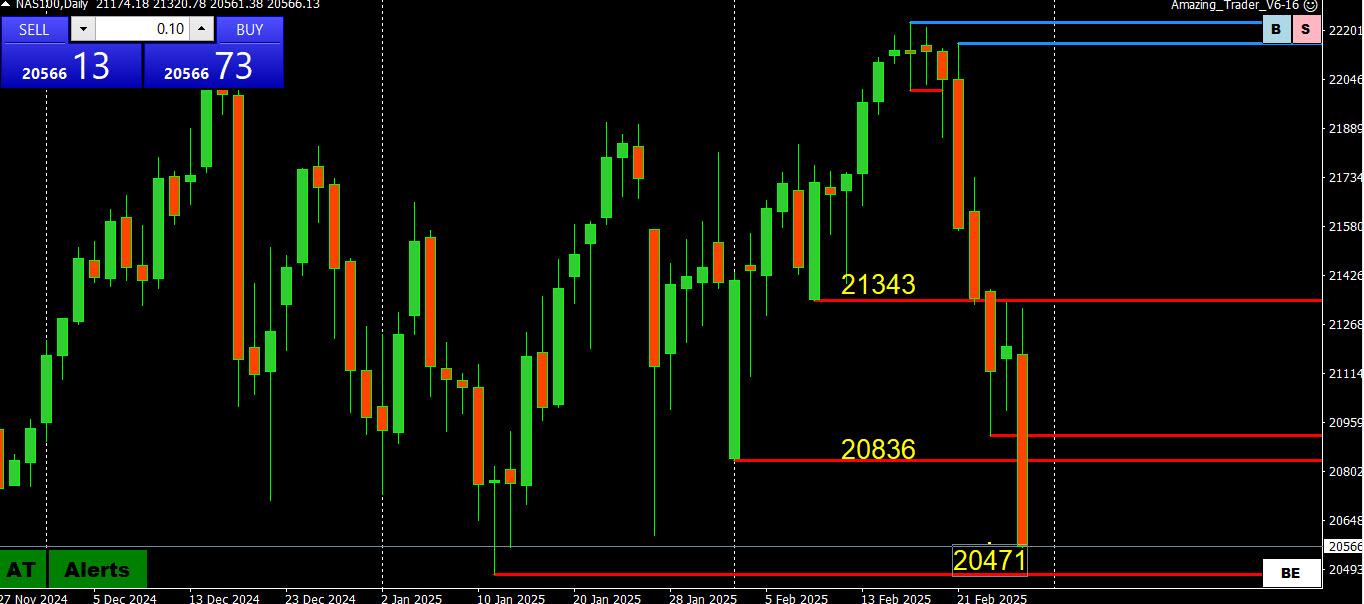
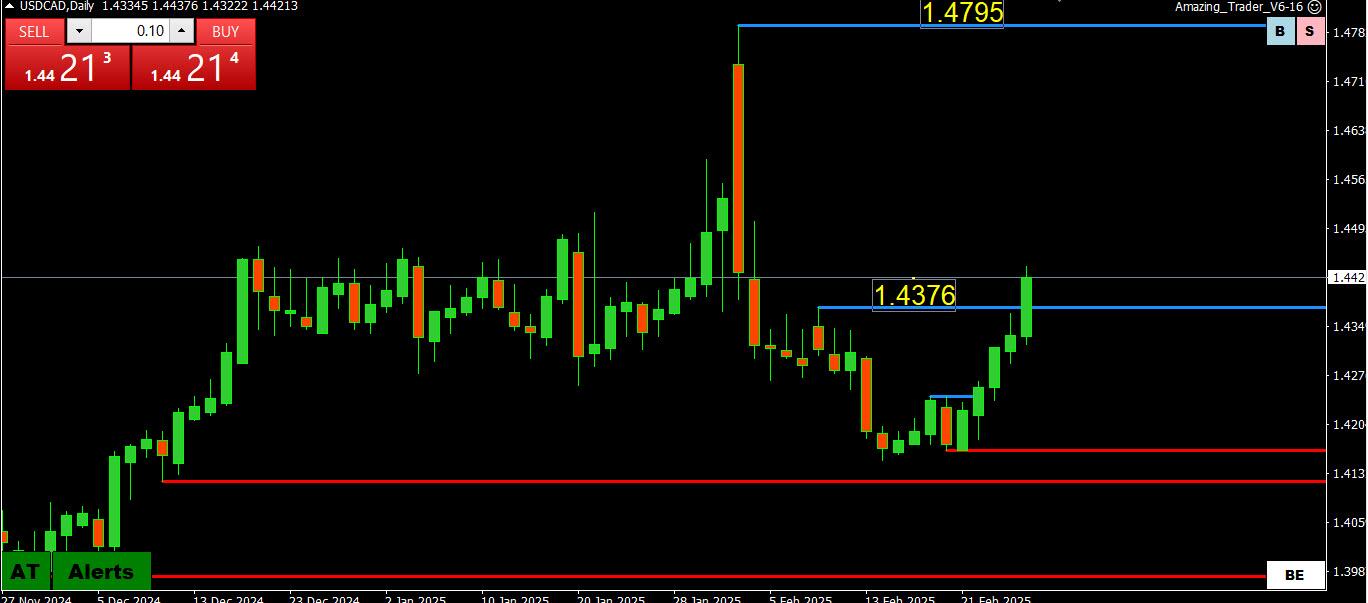
NAS100 DAILY CHART – Outside month still on the table
As I have been noting, the failure to regain 21376 keeps an outside month risk on the table. For this to occur, 20471 would need to be broken with a risk to 19887 -21300 below it.
So, 20471 will be the focus on Friday as it needs to hold and 20836 regained to ease the risk.
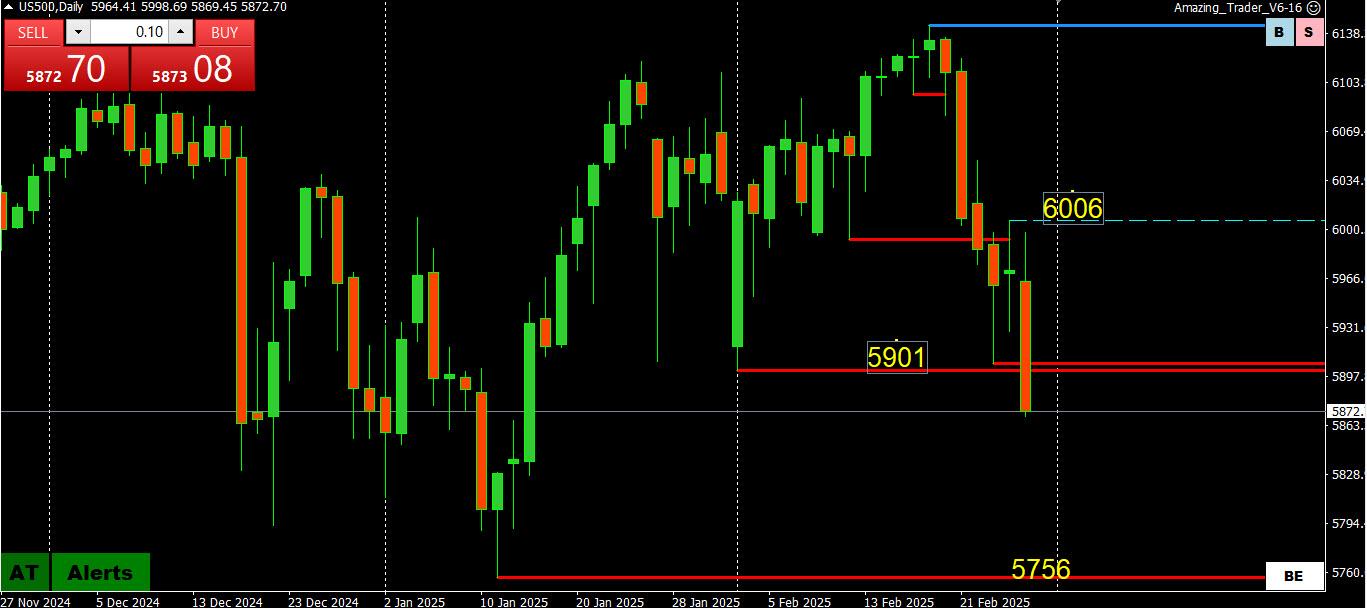
I may have sounded like a broken record noting the risk of an outside month.
The break of 5901 (low 5893) produced an outside month (new low for the year), which makes the Friday close the focus. A finish to the month below 5901 would produce an outside month key reversal with a void on charts until 5756.
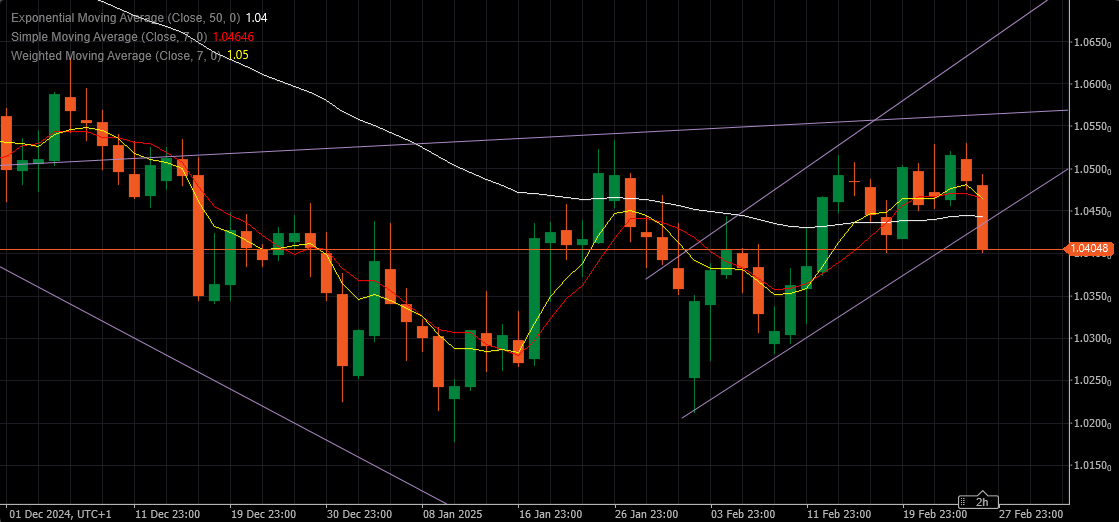
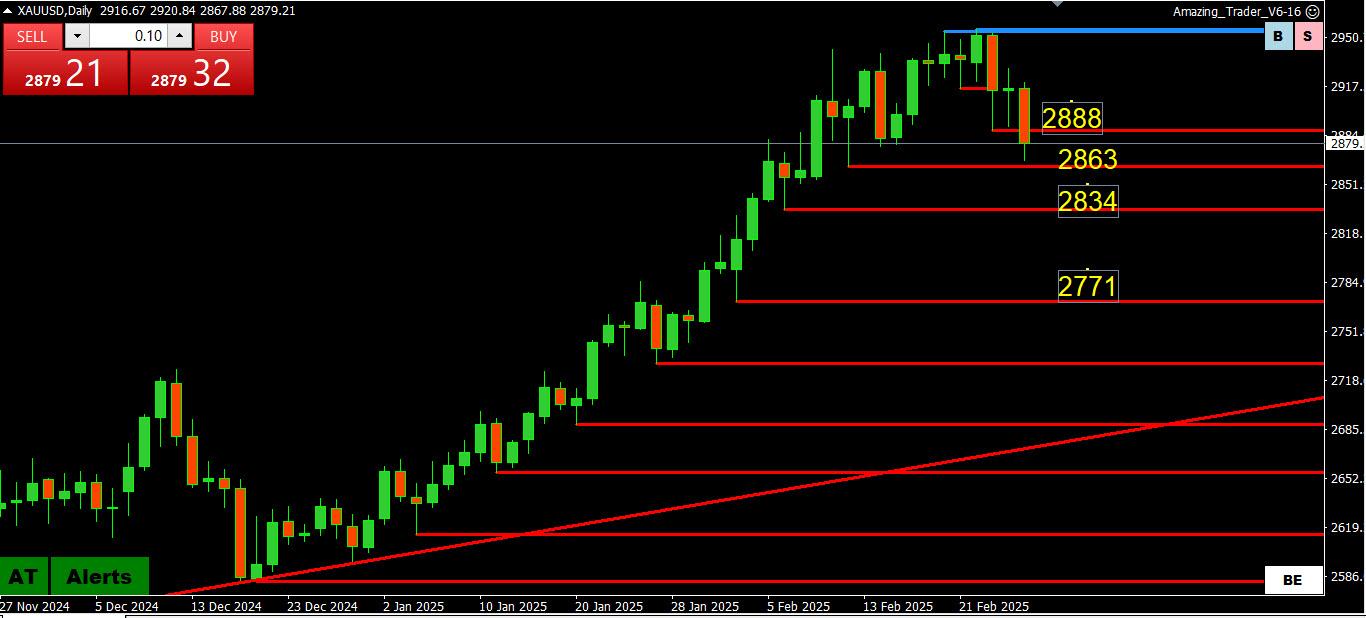
Now that the 8 week up pattern has been broken with a move below 2877, the focus is on Friday’s close to see it finishes below this level for an outside week key reversal.
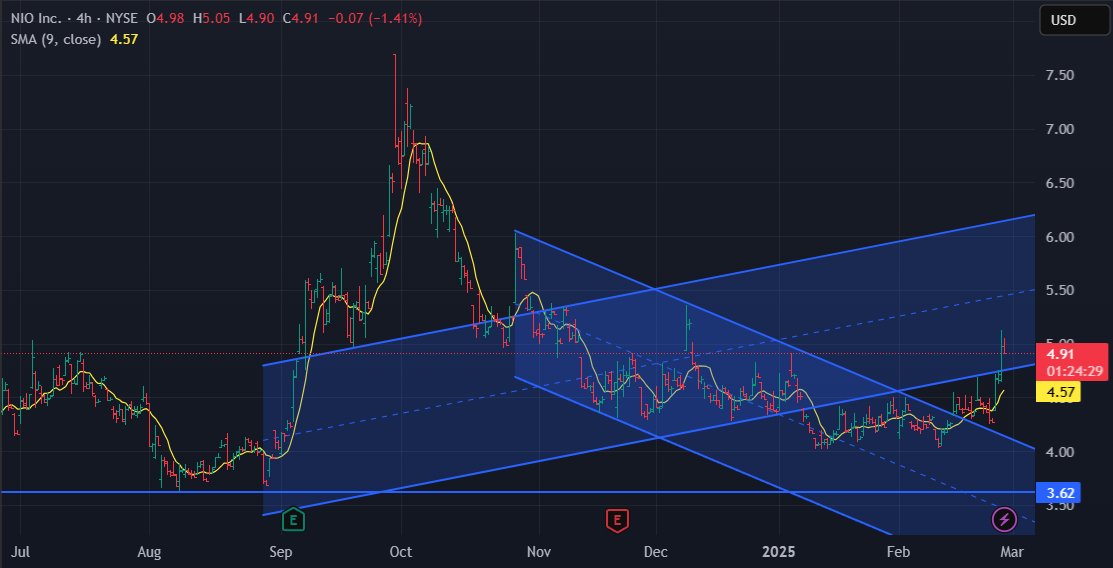
In any case, while the high is in for now, note there are layers of supports (red AT lines) below the market.
To slow the risk, it needs to trade above 2877-88, about 2920 to negate it.