Knez, there is a huge difference in strategy when trading anything bellow 30 min chart.
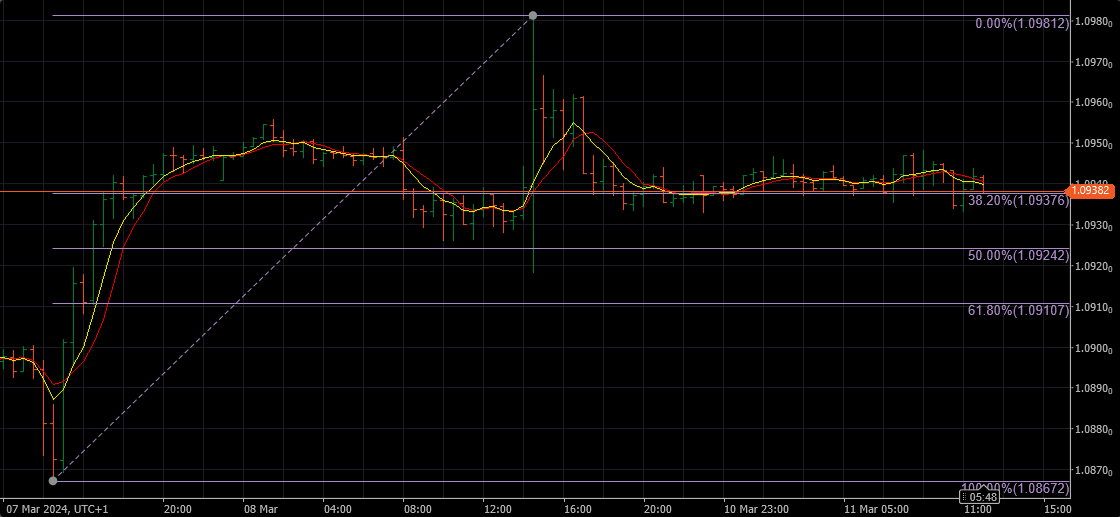
With 30 min, I follow what’s happening on 4h and Daily, and decide on entry depending are we actually moving Up or Down.
On smaller time frames ( and I find 3min the ideal one ) I don’t care where are we moving…just follow signals that I am getting . Of course, everything is smaller – Profit but also S/L .
I do it last two decades, so I have kind of feeling for it, but wouldn’t recommend it to anyone without huge experience – it can easily drive you crazy 😀
p.s. had to add that last sentence because of other visitors .
Of interesting note: “All economic models are wrong, but some are useful,” Huw Pill concluded in a letter to lawmakers last June that laid out the limitations of prediction methods. “We should really be thinking of economic forecasts in terms of probability distributions,” said Stephen Millard, deputy director of Britain’s National Institute of Economic and Social Research, who spent more than 26 years at the BoE.
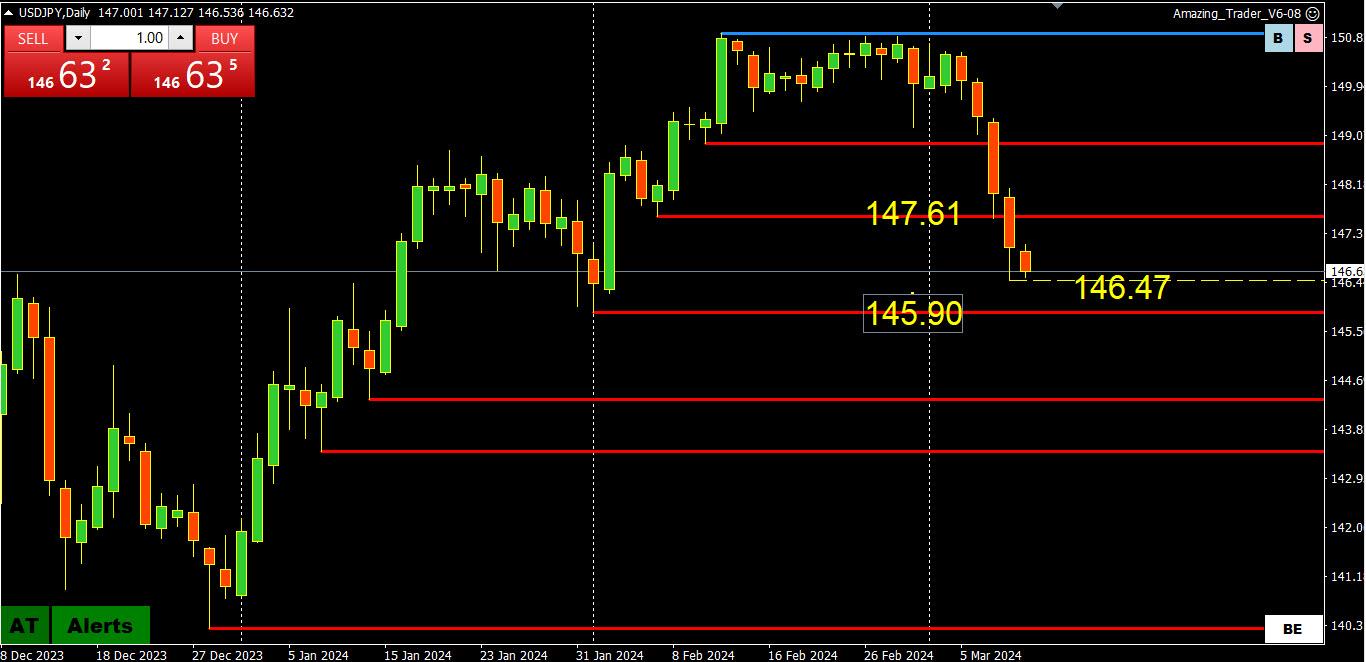
As noted last week, the break of 147.61 exposed 145.90 as the next target.
Another test just below 146.50 suggests this will be the pivotal level determining whether there will be a run at 145.90 and then 145.
As also noted (when USDJPY traded below 148), expect a limited USDJPY upside ahead of the March 18-19 BoJ meeting where there is a risk of the neverending story of a rate hike to bring Japan out of negative interest rates finally reaching a conclusion.
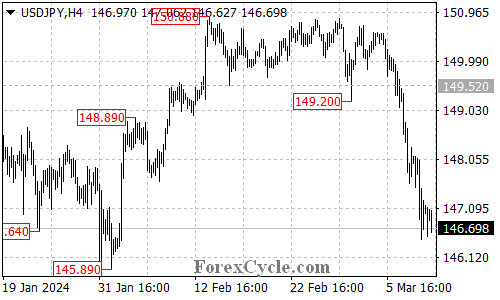
USDJPY Technical Analysis: Key Levels and Potential Scenarios
USDJPY’s downward momentum from 150.88 has extended to a low of 146.47, currently testing the support level at 145.89.
The initial resistance level is located at 147.25. As long as this resistance level remains intact, the downside move is likely to persist. A potential breakdown below the 145.89 support level might trigger further downside movement towards the 144.30 area.
On the upside, a decisive breakout above the resistance level at 147.25 would suggest that consolidation for the downtrend is underway, with the pair potentially encountering resistance around the 148.00 region.
(Reuters) – A look at the day ahead in European and global markets from Wayne Cole.
So Japan isn’t in recession after all. Revisions now put economic growth at +0.1% q/q in the fourth quarter, instead of -0.1%, so nullifying all the media lamentation about Japan’s contraction.
The US CPI on Tuesday is expected to remain overheated, at a 0.4 percent monthly rise overall and a 0.3 percent gain for the ex-food ex-energy core that would leave the latter at an expected 3.7 percent and nearly double the Federal Reserve’s target. Shelter costs will likely still be elevated, while other services like insurance premiums are seeing new hikes.
India’s CPI on Tuesday is expected to edge only 1 tenth lower to 5.0 percent with UK wages, also on Tuesday, likewise not expected to cool very much to 5.7 percent. Yet the UK’s monthly GDP report on Wednesday is expected to offer good news with a 0.2 percent gain.
US retail sales on Thursday are seen rebounding but not US industrial production on Friday where another flat result is the consensus. US consumer sentiment for early March will wind up the week’s calendar with what is expected to be a small gain on top of recent large gains.
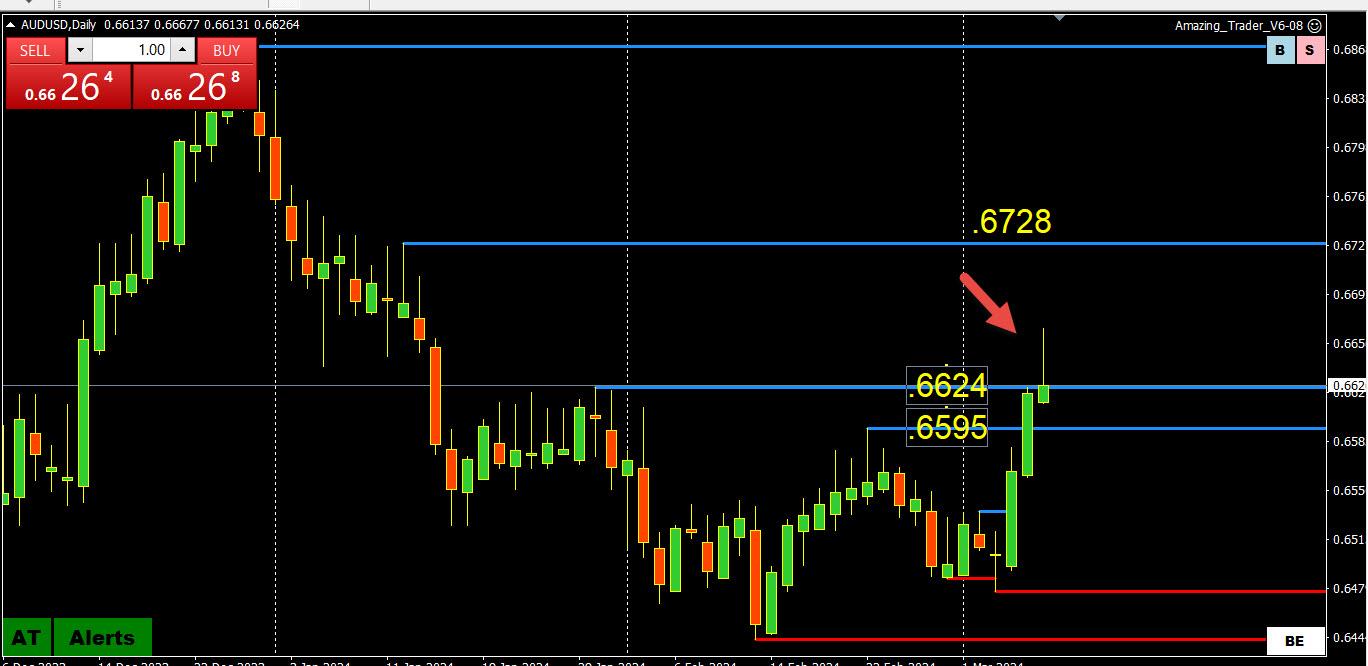
Breakout above .6624 and then retreat towards it. A large wick at the high suggests the possibility of a pause but only if AUDUSD moves back below.6624.
Only below .6595 would put it back into its old range, making .6595-6624 a support zone.
Next week, highlights include US CPI and Retail Sales data, GDP and the Labour Market report from the UK, while the 1st tally of the Japan Rengo wage talks will be key, as will China inflation data
Week Ahead 11-15th March
Sat: Chinese Inflation (Feb)
Sun: Japanese GDP (R)
Mon: Eurogroup Meeting; Norwegian CPI (Feb)
Tue: NBH Announcement, EIA STEO, OPEC OMR; UK Labour Market Report (Jan/Feb), US CPI (Feb)
Wed: UK GDP (Jan)
Thu: IEA OMR; Swedish CPIF (Feb), US PPI (Feb) and Retail Sales (Feb)
Fri: Quad Witching, PBoC MLF, Japan’s Rengo (labour union) 1st Pay Tally; US UoM Prelim (Mar),
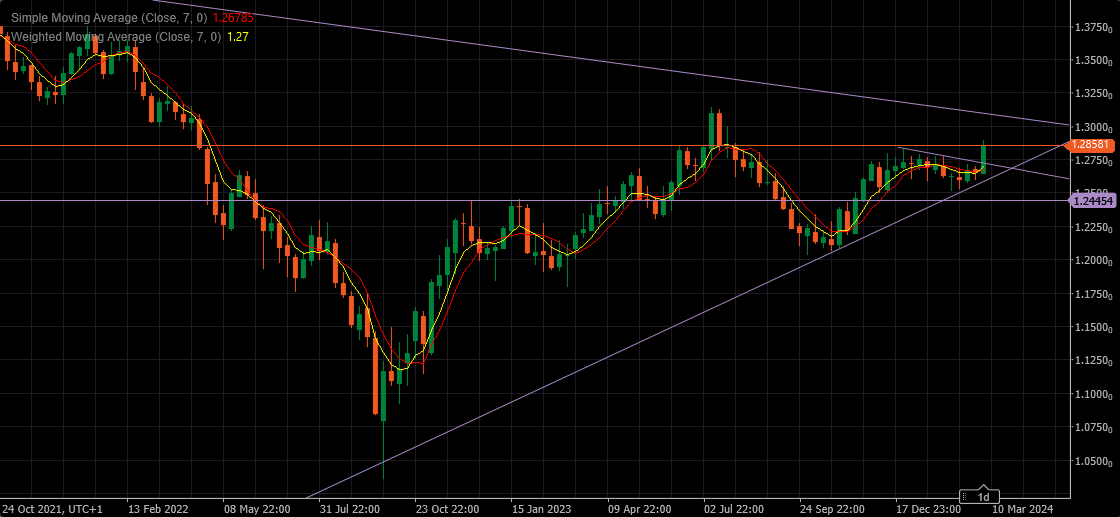
Resistances ( Targets ) at 1.30850 and previous high at 1.31450
Supports 1.28200 and 1.27350
It is very difficult to predict exact moves week ahead, but let me try :
Pull back is a Must, but depending is it going to continue a bit more up on Monday and then pull back, or first Pull back and then Up will decide its fate in the near future.
For the Cable to continue surging , pull backs are the way – any extended Rally Up might end up in tears ( like an Irish story )