I see (hopefully) one more round of USD buying which I expect will run out of steam around or above UsdChf 9100 where I like the sell side for duration. Same with UsdJpy in kind.
Note to those of us who have limited experience in forex trading — Macd and Stochastics will remove you of your money. You are better off listening to people in here with experience.
And for the love of God if you think some youtube or facebook “guru” is going to make you money with “signals” on your cell phone you are in for a rude awakening. Monedge, for example, was formed by CTA’s and other industry professionals, GVI is frequented by real bank traders with real experience. Big, big difference.
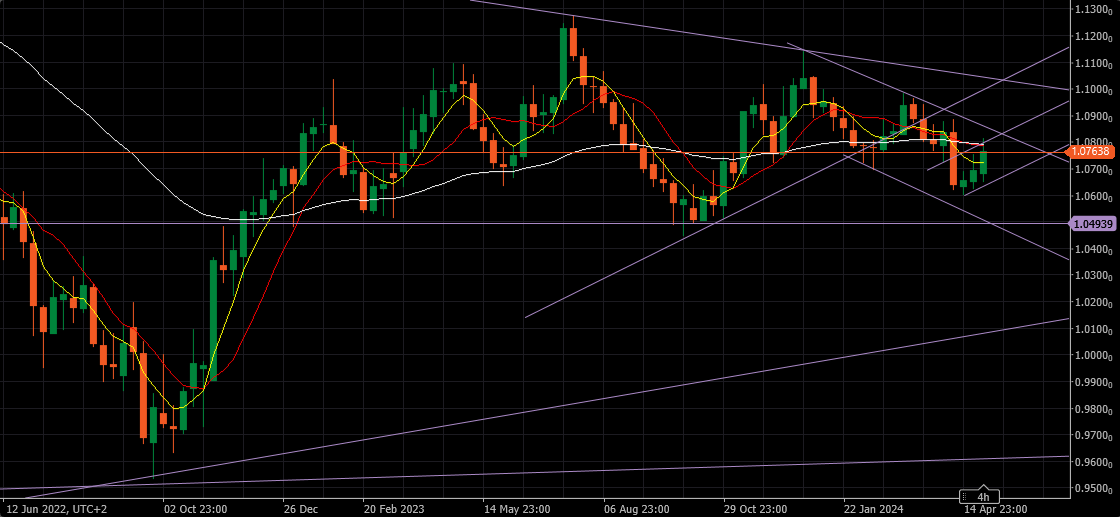
We had some EUR positive Fundamentals last week that helped the pair to extend the gains from the week before ( or better to say USD negative )
The Nonfarm Payroll report
The Federal Reserve was less hawkish than anticipated,
EUR/USD is up for a third consecutive week but buying interest remains reluctant.
Coming week lacks any important data, so we can expect the market to behave more technically.
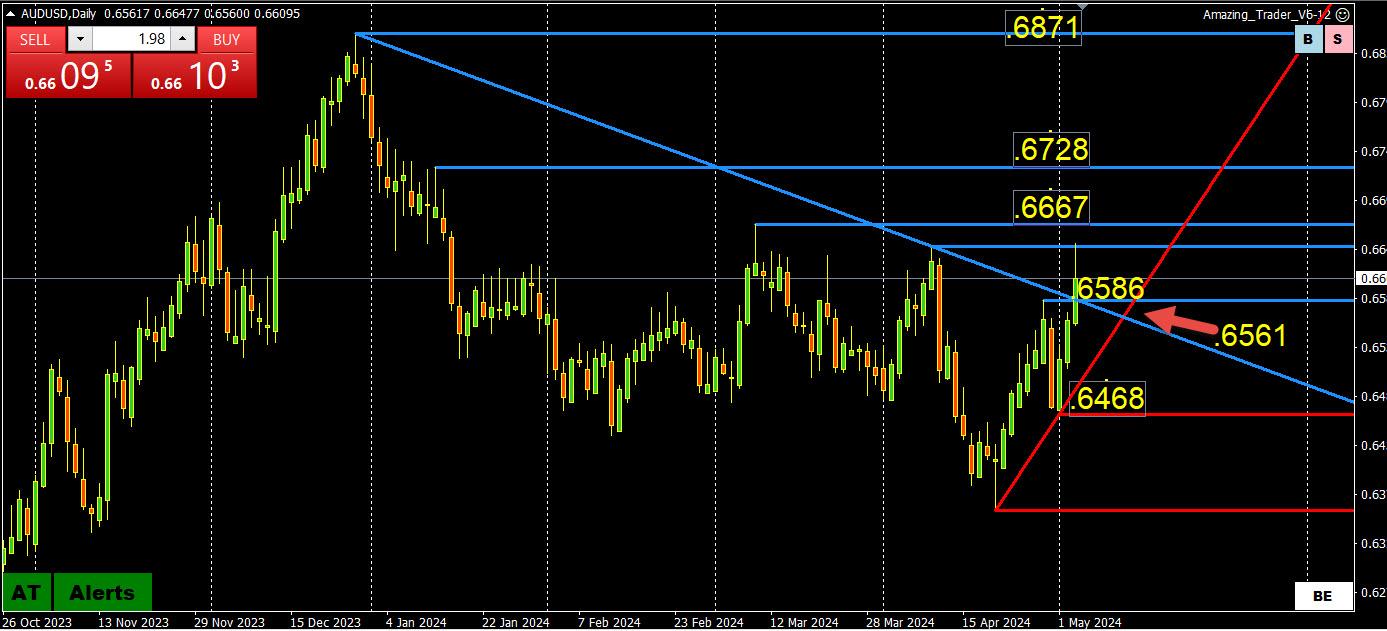
AUDUSD will likely see a cautious start after the strong move up and ahead of the RBA decision on Tuesday (see preview)
Looking at this chart, expect support as long as .6586 holds but the key level is .6561, where the up and broken downtrend lines intersect in the coming days.
The new week starts off with a UK bank holiday on Monday as traders digest the BoJ interventions and some cooling of U.S. rate cur expectations.. There is a very light U.S. calendar so the focus in this regard will be on events overseas.
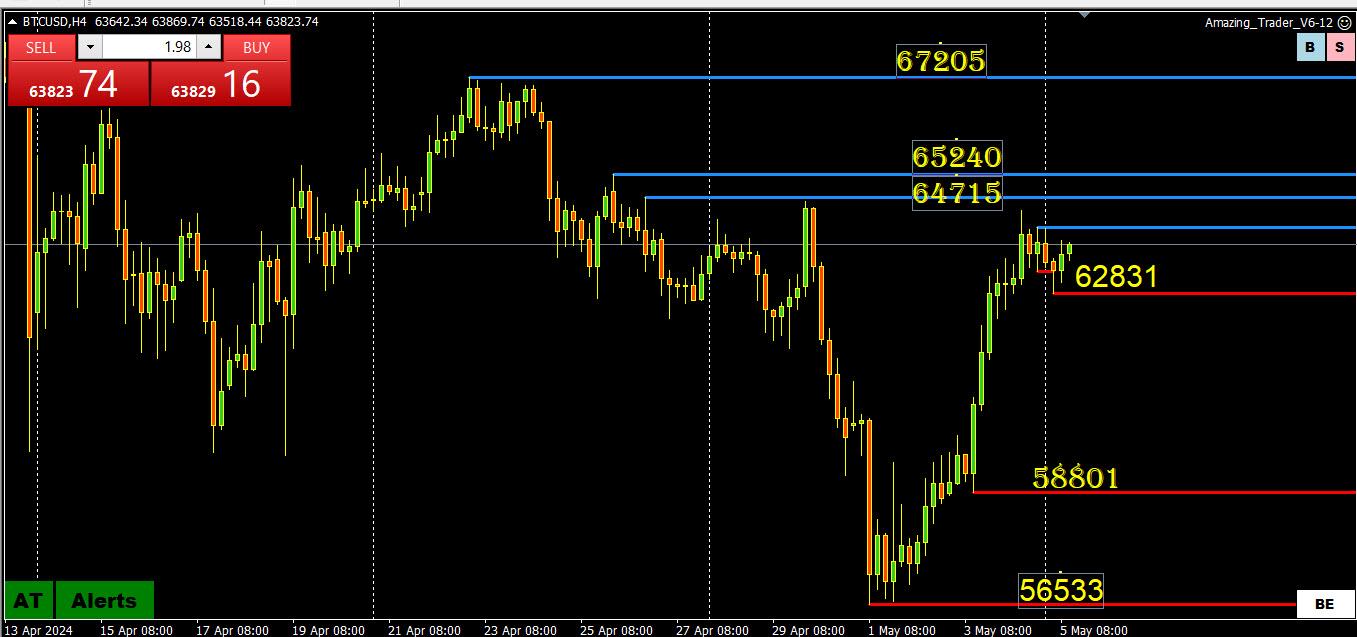
The question for BTC traders is whether the new range is 55-65k or 60-70k.
As can be seen by this chart it faces some key resistance levels straddling 65k and then above 67000.
On the downside, support is likely as long as it stays above 58801 but 60000 is the clear psychological level, its importance will be whether it becomes the new floor for 60-70k or the midpoint of 55-65k.
thanks for that bigger view daily chart Bobby. Should be fun to watch things unfold, as Option Profile confirms and USDJPY rally from here should be sold.
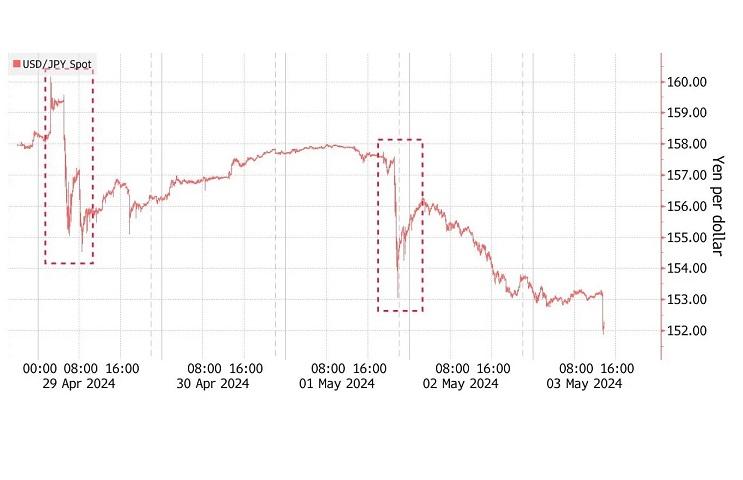
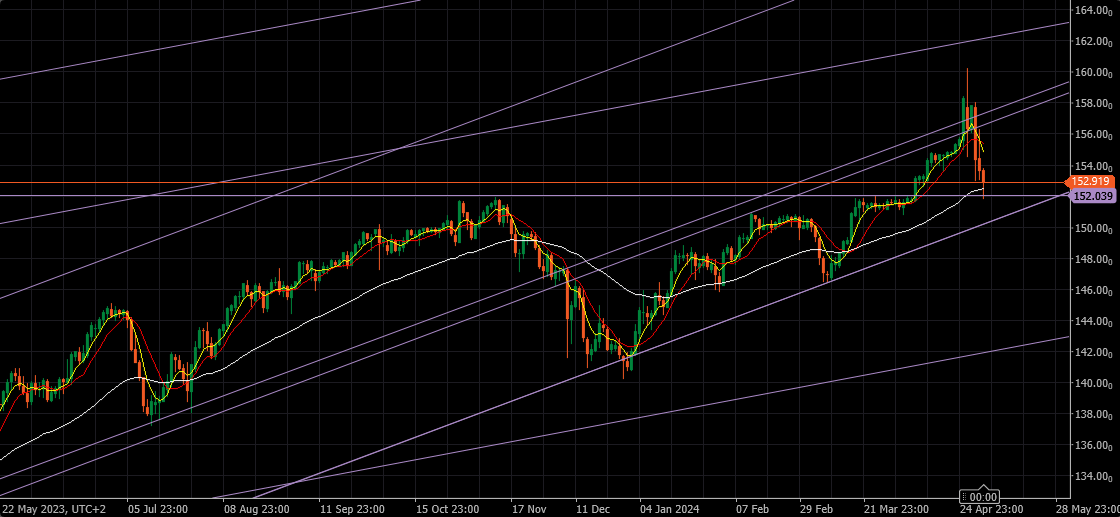
So let’s take a look what kind of damage BoJ did – if at all…
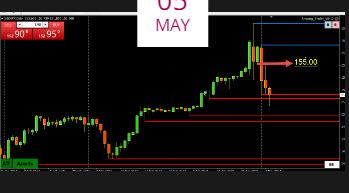
Taking into account BoJ’s intervention appetite so far, I am going to avoid stating some obvious levels – supports and resistances and will focus on only two indicative ones:
152 – that Horizontal line that you can see on this chart – mind you, it goes way back –particularly 20.10.2022. and you can see it now acting as a kind of Pivotal.
155 – if BoJ means serious business, they will take care not to allow market goes a pip above it.
I can only imagine what can happen if market gets idea that this was just a very good Buying Dip – there would not be enough means for BoJ to stop it rallying .
And in that case, do not bother with 162…it would be more of a 172 target.
Crazy ??? Maybe….but I never claimed to be a sane one 😀