Learning To Read The Sign(s)
Keywords: greed, greed, greed, naivety, greed
–
Binance Pledged to Thwart Suspicious Trading—Until It Involved a Lamborghini-Loving High Roller
Former company insiders say the firing of an internal investigator showed that the crypto exchange neglected evidence of market manipulation.
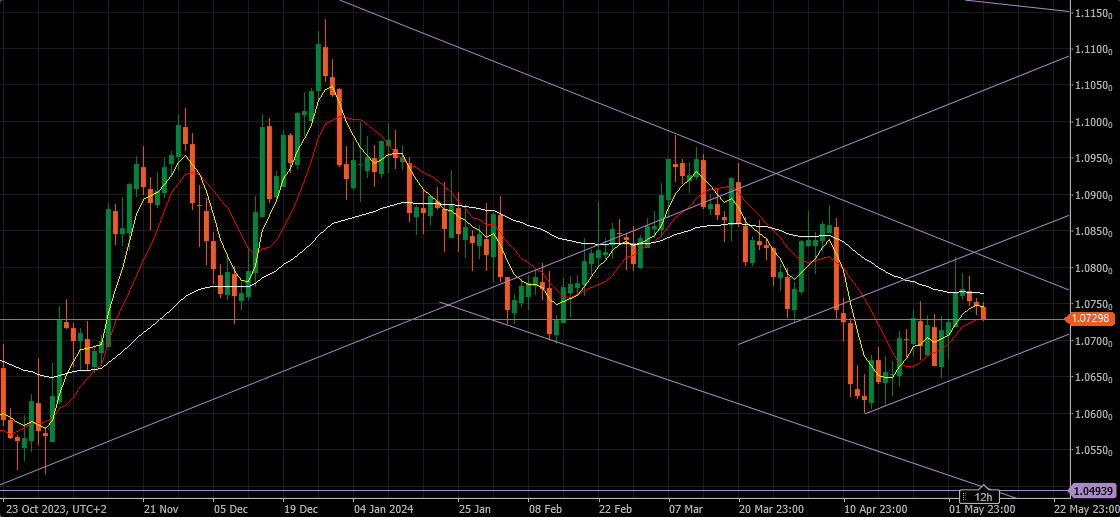
Trendline’s Supports and Resistances
Supports :
1.06650 , 1.04950 & 1.04700
Resistances :
1.08150 , 1.08250 , 1.10500 & 1.11500
Currently in a Buy Mode – as long as we are above 1.06650 we have to treat it as Bullish.
Moving Average’s Supports and Resistances:
Supports :
None
Resistances:
1.07300, 1.07450 & 1.07650
Currently in a Sell Mode – as long as bellow 1.07650 it is Bearish
Investors watching for hints of a rate cut in June
ECB expected to move next month, Fed going more slowly
UK inflation heading for 2% target but wage growth strong
LONDON, May 9 (Reuters) – The Bank of England is likely to take another step towards its first interest rate cut in four years on Thursday as inflation falls, but will probably be cautious about signalling that a move is imminent.
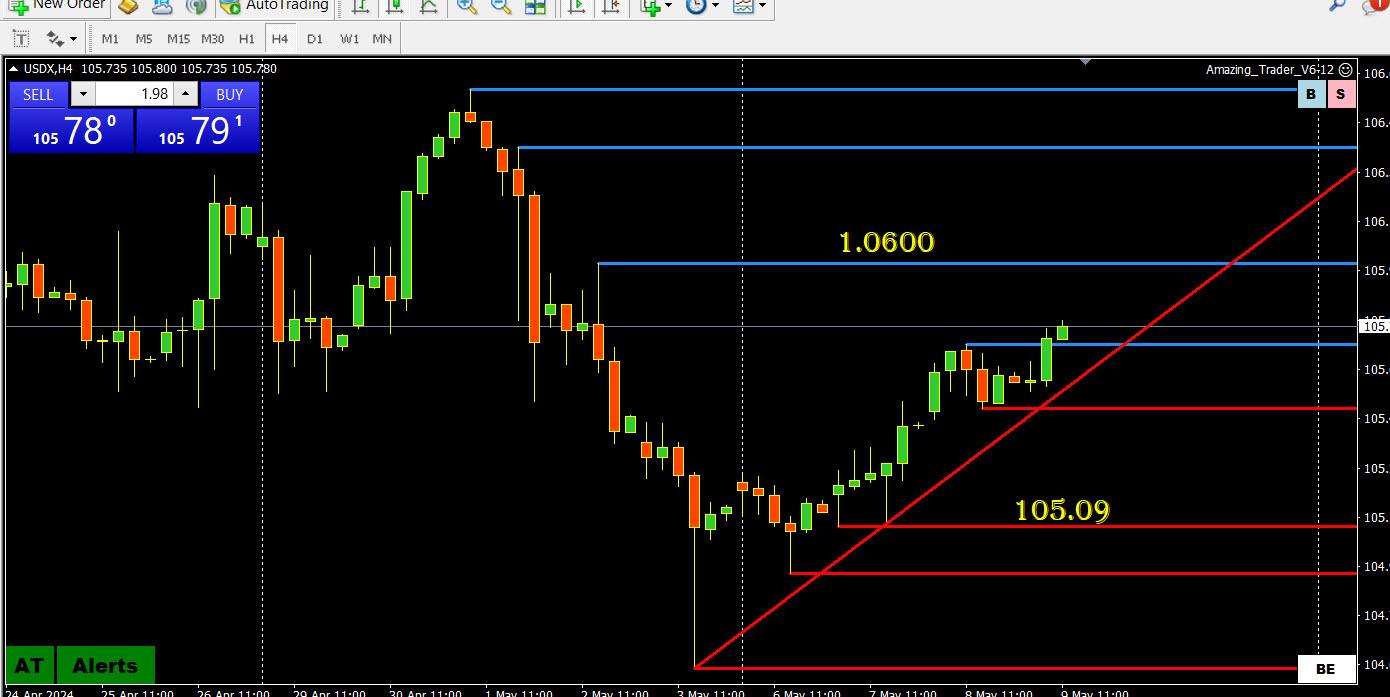
I take a look at USDX as part of my daily routine. With EURUSD representing 57.6% of the index, it often acts as a proxy for this currency.
More than half the battle is to identify the side to trade and this index helps confirm (or not) what I see on a EURUSD chart.
Looking at this chart. USDX continues to recover from last week’s post-US jobs report fall.
It is trying to build momentum to the upside but still faces a key resistance at 106.00. It would likely need EURUSD to extend its retreat to challenge this level.
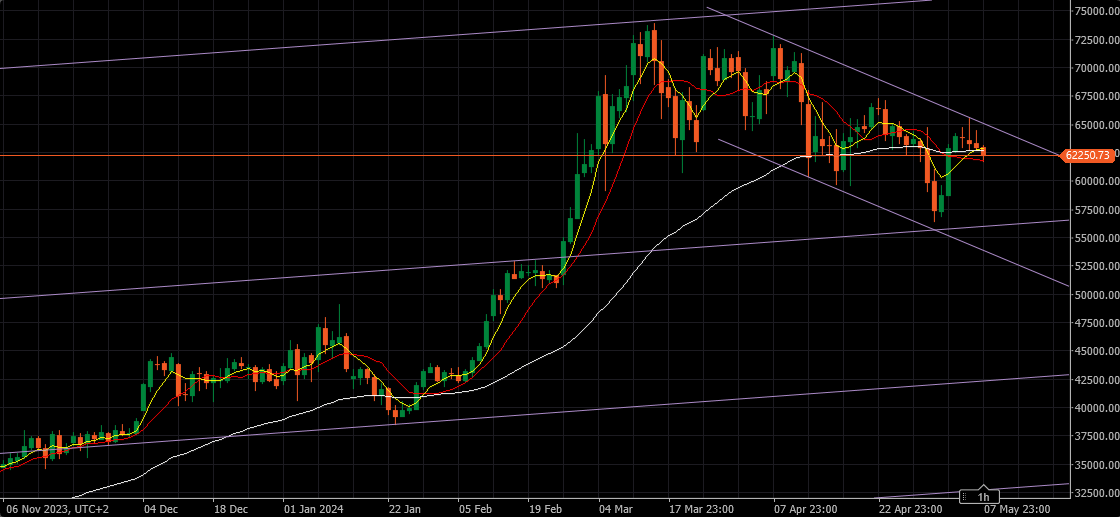
DLRCHF 9095-ish
–
technically this is potentially next directionally determining price level
when it broke down the r-shoulder of the H&S formation on may 3rd (ref hrly chart) and now back to it.
Break-out N would signal that players have shifted their trading theme as suggested by neel k. Good idea to check odds (and pricing) of frequency and date expectations for FED’s inflation fighting action(s)
A Trade Secret – slowly beeing revealed
pssstt
–
if you want to learn about slow econ data week
DLRCHF (on 15 and/ or 5 min charts) is telling a great tale how to trade price range
and then one fine moment something will come in to disturb the price wavelets and priceaction breaks out.
Jay – 10yr is at 4.46+ with a flat curve (mis-typed, working fast), curve is at 3.51 a year ago,, it means the curve is a higher but bit flat right now. 2yr curve is declining at 4.84 from 3.99 a year ago. So near term yields (especially monthly) are declining, the 10 is flat, the 15-20-30 are all moving up. So the market is pricing in higher yields further out, with a stagnant mid-term, and a declining near term. If I got it right.
Just a note – The 6month yield is essentially flat at 5.06% and the 10yr is essentially flat at 3.51 on the yield curves. The only ones with a positive curve are the 15yr, the 20 yr, and the 30yr if I am reading the numbers correctly. I would love to hear from some of the viewers out there who never comment about what they think of that.