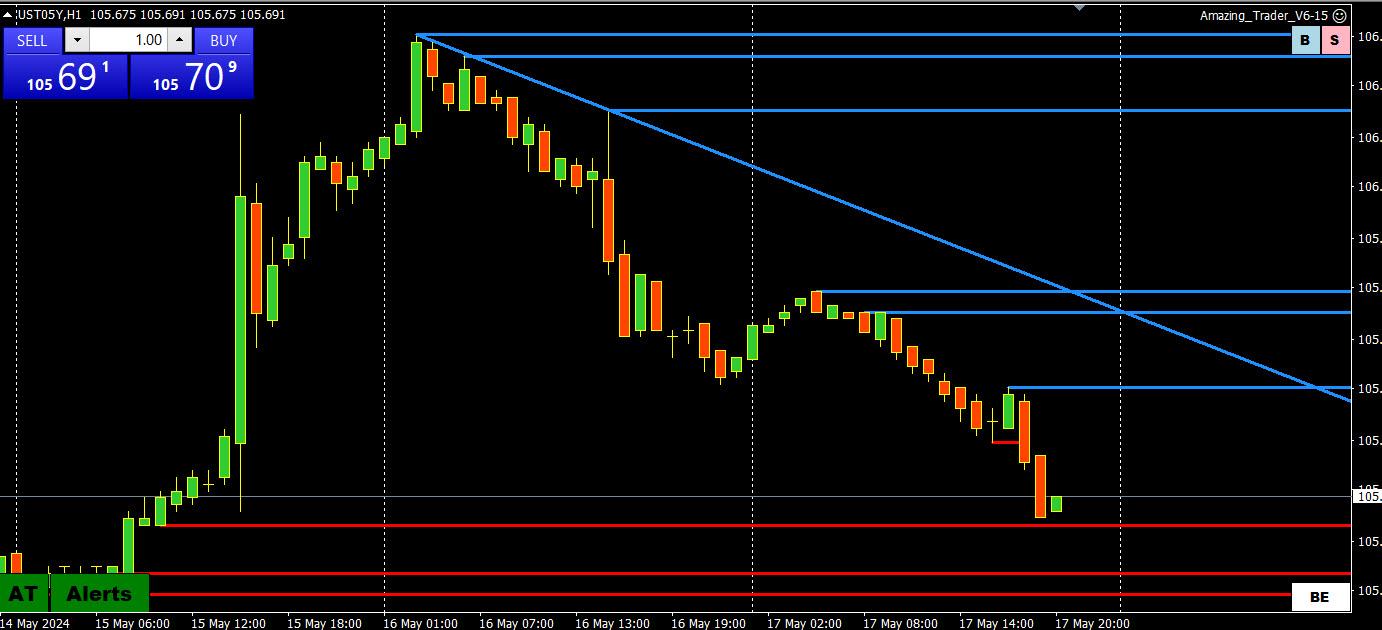
Note the price of bonds is inverse to the yield. 10-year is currently at 4.418%, the high of the day (low for the bond price)
If the forex market was correlating with the yield in bonds it would be a different story today but such is not the case.
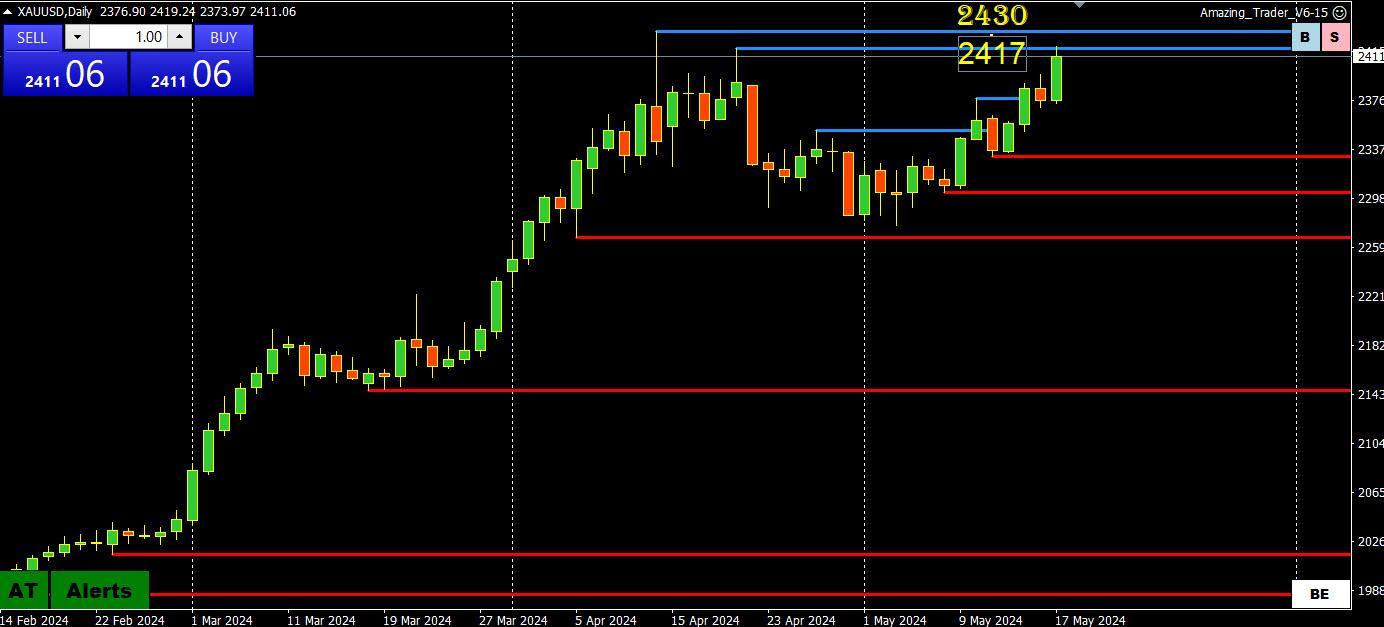
Yields up, USD down gold up. stocks mixed.
Note USD was up earlier with firmer yields but has since decoupled.
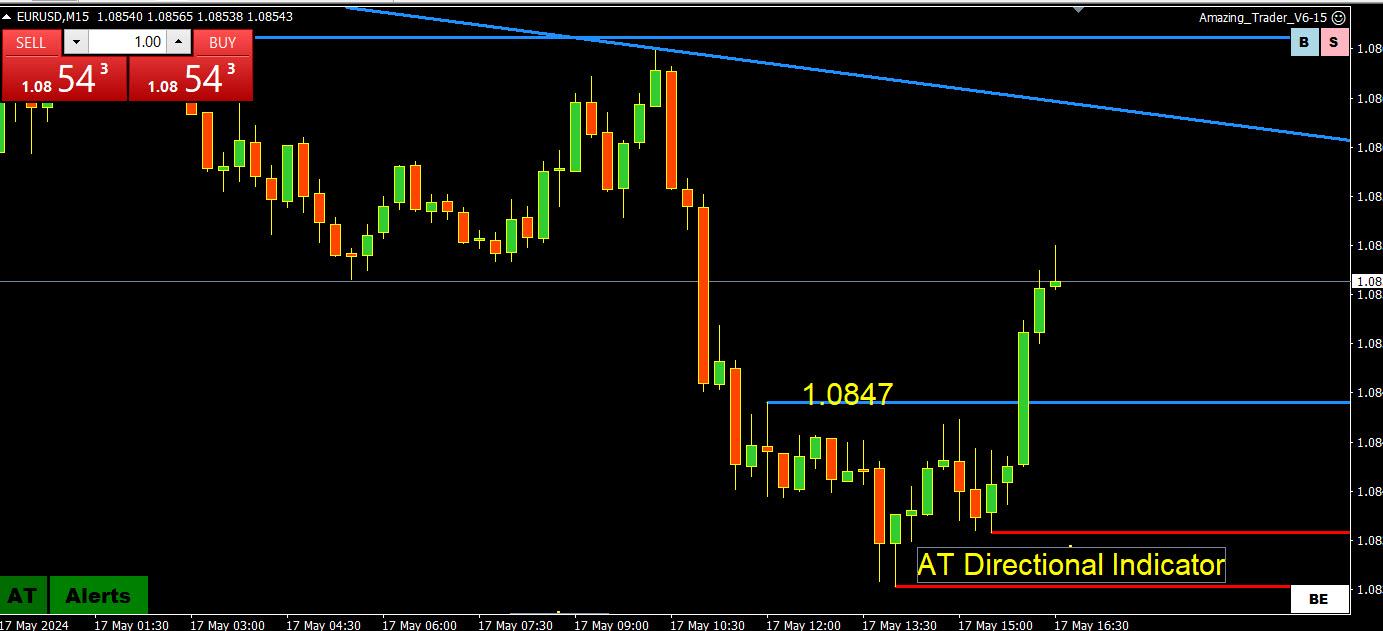
This chart is using The Amazing Trader and what amazes me, and I created the charting algo, is how it performs with any instrument your broker offers and in any time frame.
per Option Profile, Gold futures remain SELLER controlled from the Apr 12 TOP; new longs in the Silver futures burst toward $31 today are likely buying the top
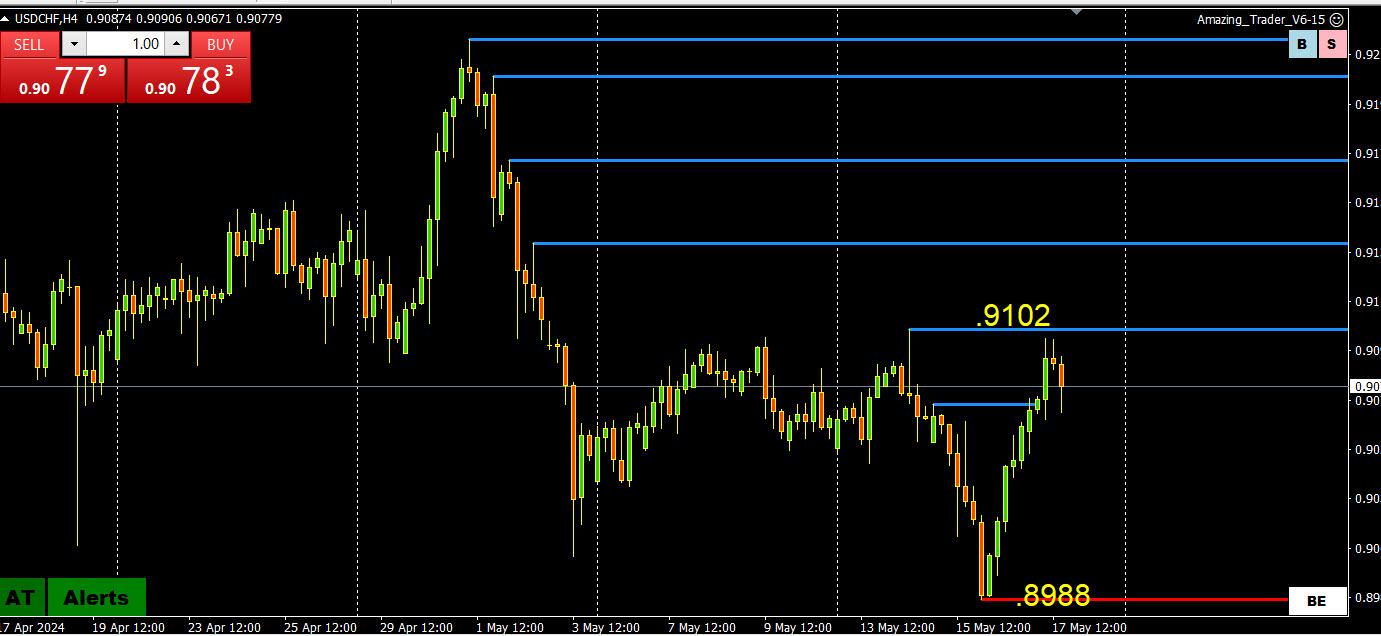
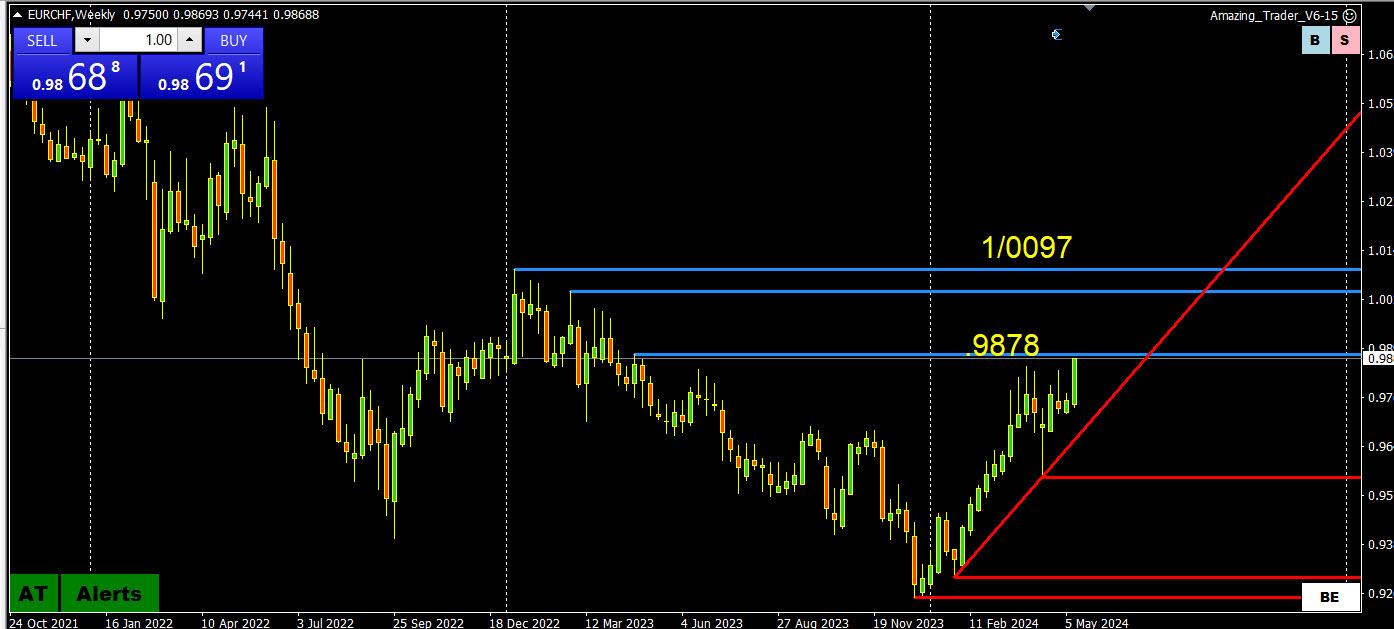
I can’t believe I am even posting a EURCHF chart. I swore off even looking at it following the infamous SNB-inspired 2015 flash crash when it pulled support from this cross at 1.20.
EURCHF resistance at .9878 has been tested and its significance is that if firmly broken it would have the market talking about 1.00.
We have almost surely reached the high of the day in Nasdaq put to call ratios in my estimate, which should likely be a part of what roughly caps stocks/EU.
In the spirit of risk management in a geo-politically charged environment and a few market conditions I liked the sell side of the EU a bit ago, just a Friday thing. Hedged all over the place elsewhere.
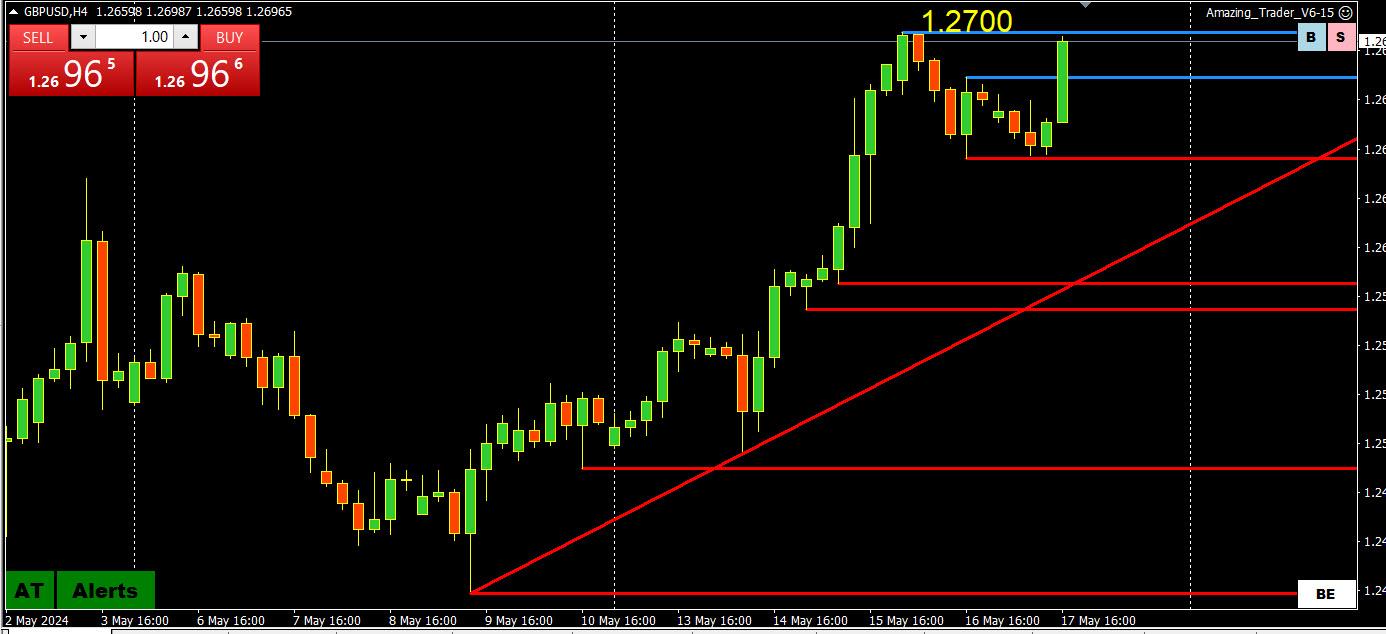
GBPUSD has been a leader today and re-testing 1.27. The significance of this level is THAT BETOND IT there is a void of key resistance until above 1.28.
US 10-YR 4.404% +0.027; DLRx 104.55
–
DLRs got bit of phillip but imo will need to climb N of 105 and sustain
Sup 104.15
—
psst … gamechager:
The Russian announcement of a massively massively crude deposit – around 511 billion barrels worth of oil, equating to around 10 times the North Sea’s output over the last 50 years – is going to unleach animal spirits and hinder ESG regardless of tree huggers screams