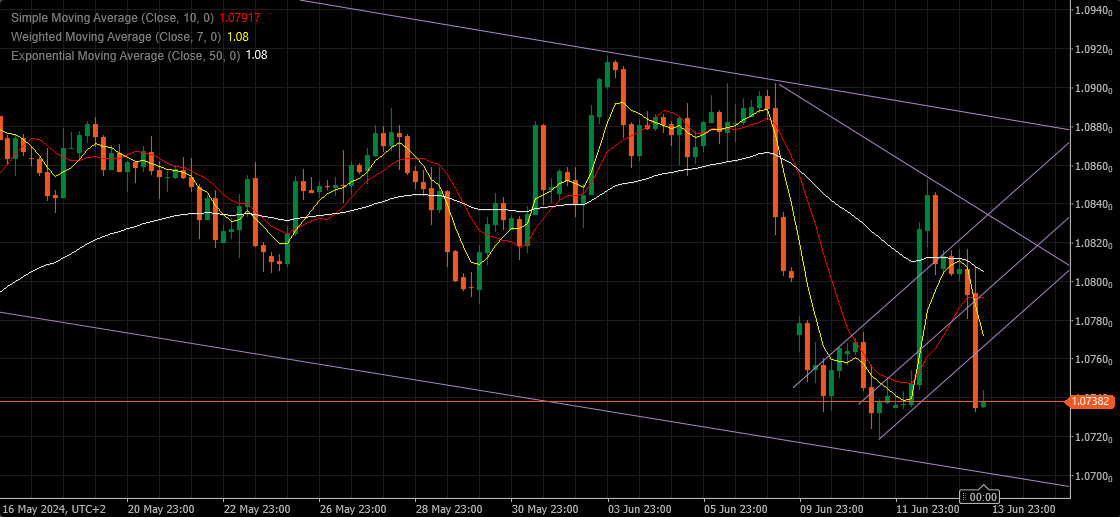
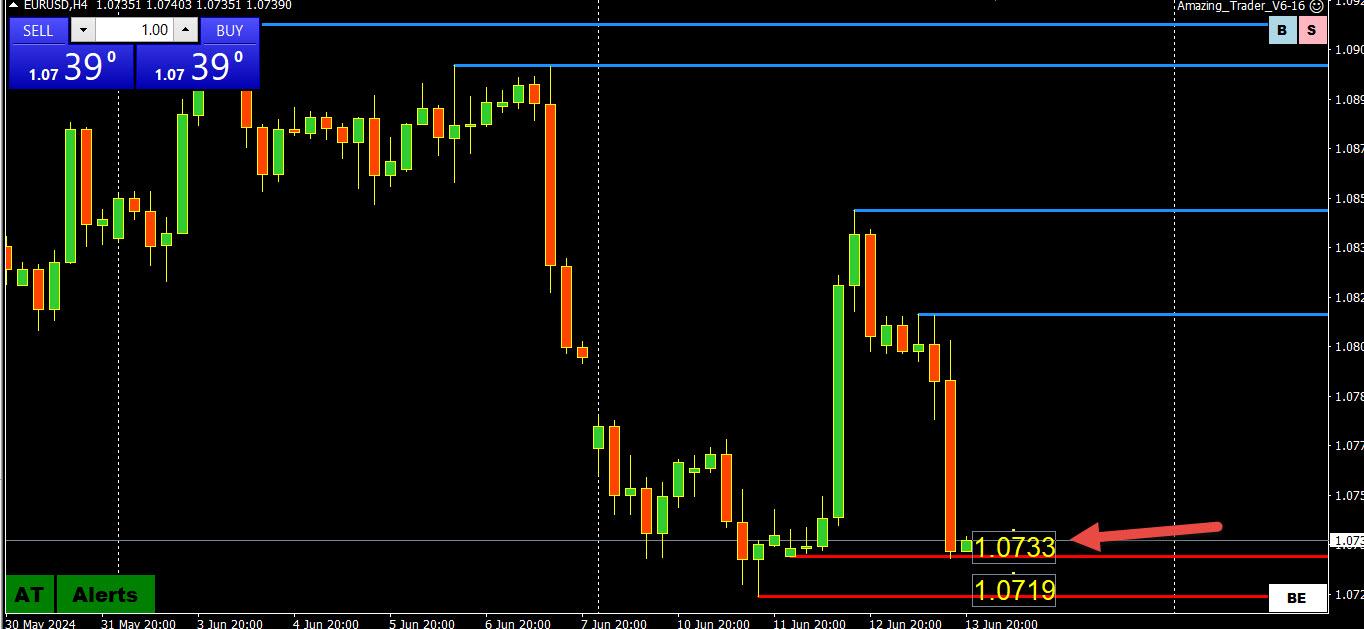
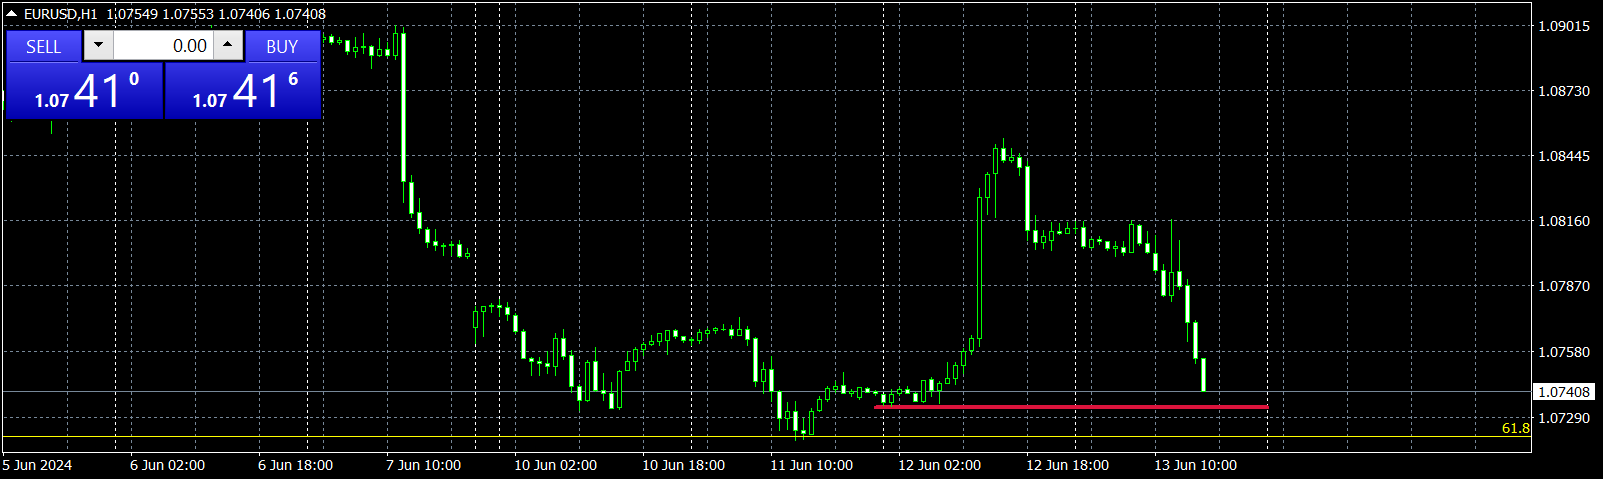
Wednesday was perfect retrace on EU to fill the opening gap and FVG up to 1.0850, then ystd back to down journey….. on my chart weekly needs to close below 1.0750 today to stay bearish ….. I love when price moves by the book. 🙂
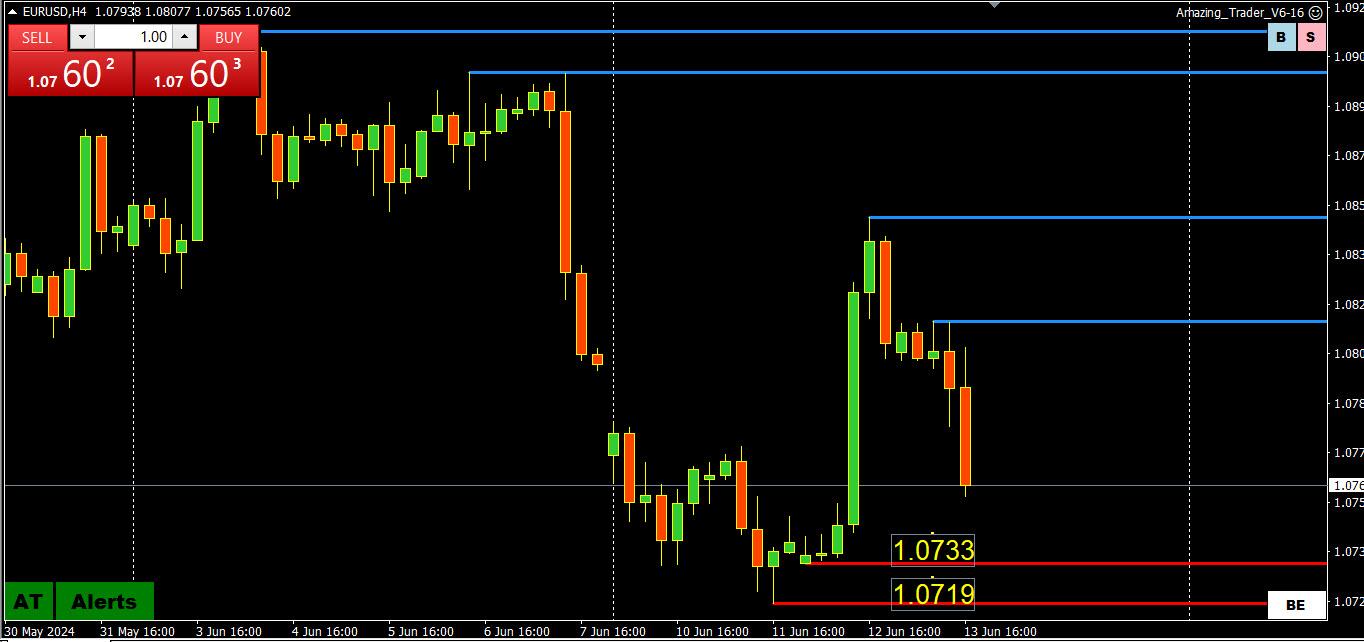
Now price tested weekly low at 1.0719 next is to test previous month low at 1.0649
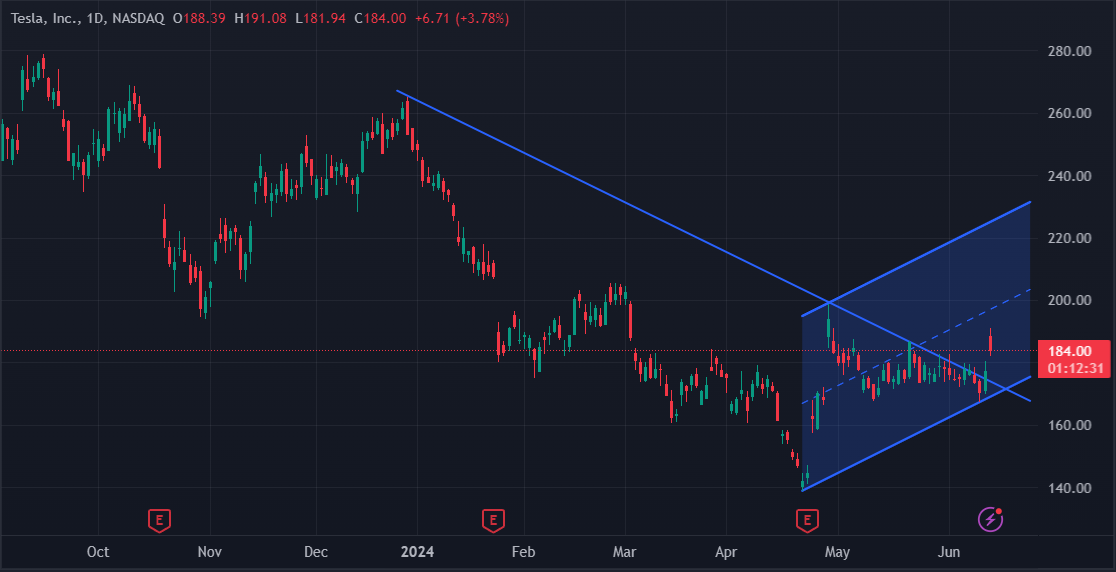
Tesla Inc. TSLA rose over 3% after shareholders approved proposals regarding Elon Musk‘s $56 billion compensation package and the company’s relocation to Texas
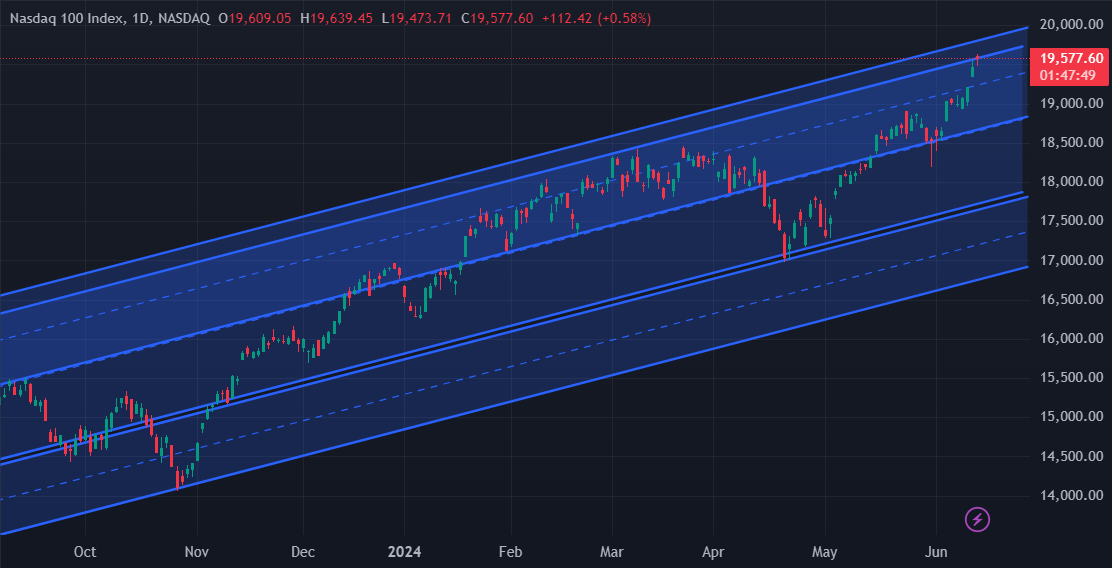
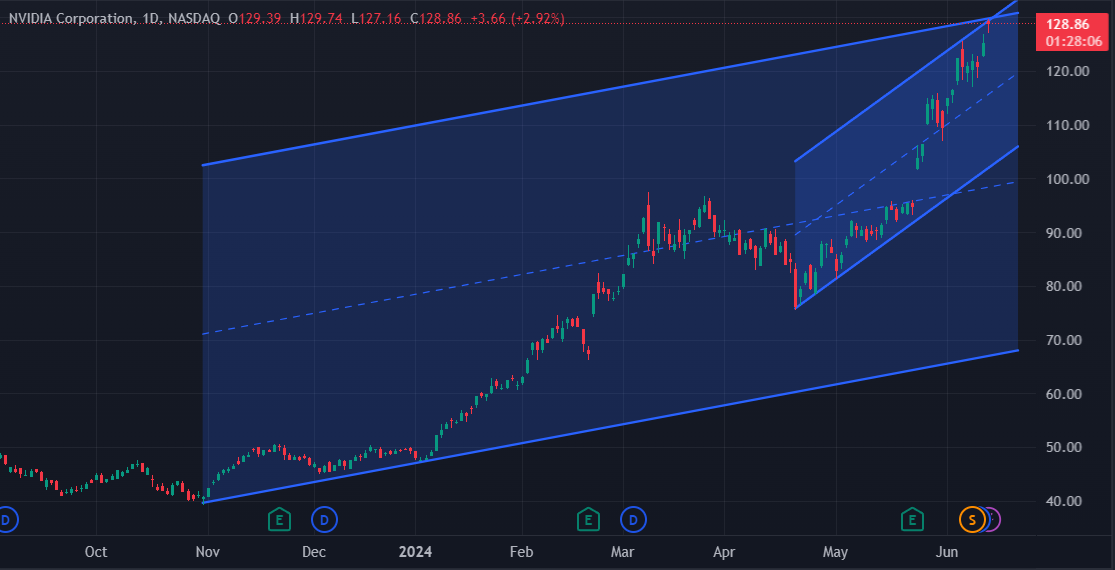
Stock-split mania is powering chip stocks higher once again
Nvidia, which completed its own stock split before trading began this week, was recently up more than 3%. The AI darling closed Wednesday with a market value of $3.08 trillion, slightly behind Apple and Microsoft among the most-valuable U.S. stocks.
Why your predesigned indicators don’t work – by a former blackballed CTA – so I hit Aussie right on the chin purely out of experience when every indicator said otherwise, knowing if I go to sleep the banks will do a stop run on my position overnight but they can’t afford to take it further and so I sat on it and the profit target filled. So was flat on the backdraft and now back in flipping the bird and listening to “Crazy Babies” by Ozzie Ozzborne lol. They didn’t get me this time. That, ladies and gentlemen, is trading. Other than Amazing Trader, not much else works other than option contracts.
After conference with Michael, who does futures, based on option contracts, and a few bankers, only I have access to, and my gardener, apparently the US Dollar is a buy, contrary to conspiracy theorists. If you look at options contracts and fowardes it is right in front of our face, that doesn’t mean it can change on a dime, pointed out by GVI. Here is the catch … your Youtube guru has no clue
Think like a banker running a billion dollars. Pretty extreme comment. But I a correct. It is why I produce.
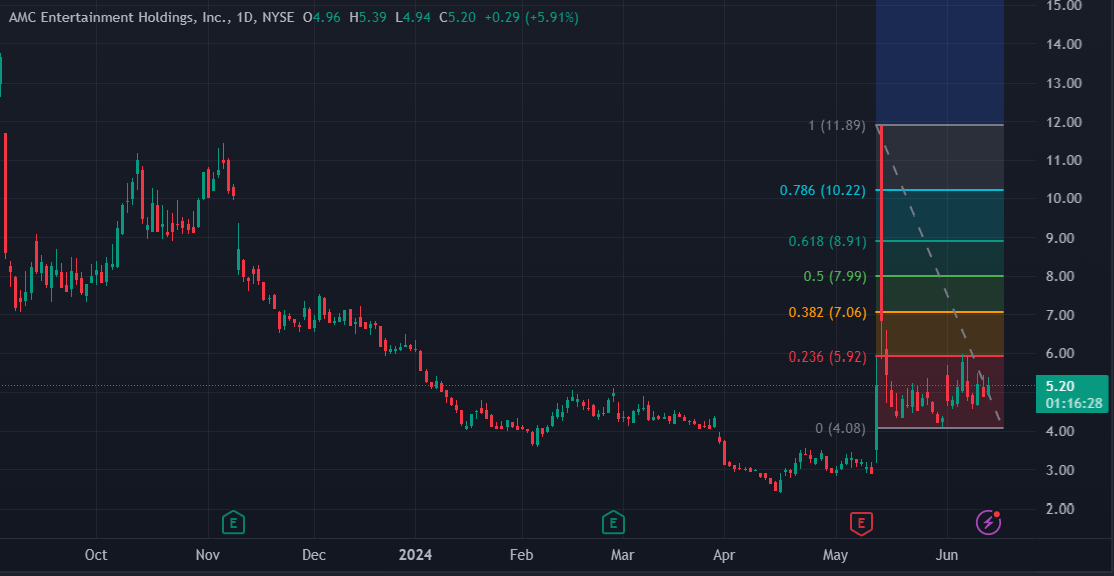
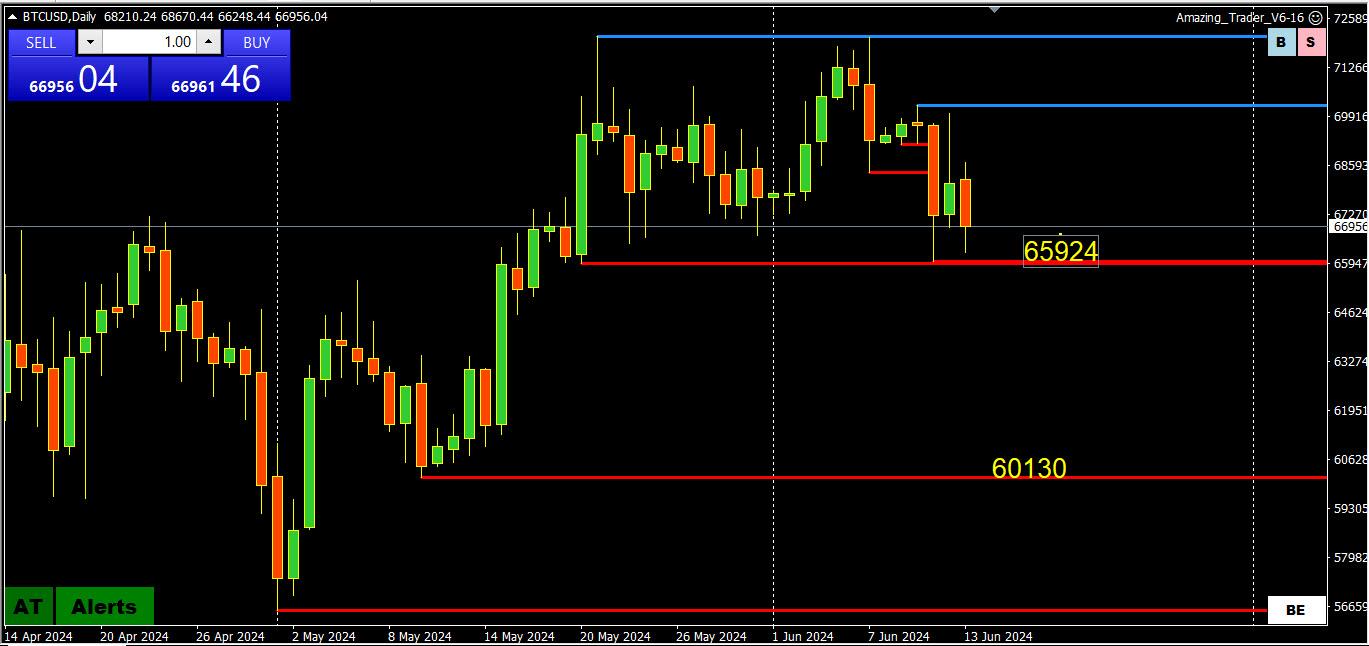
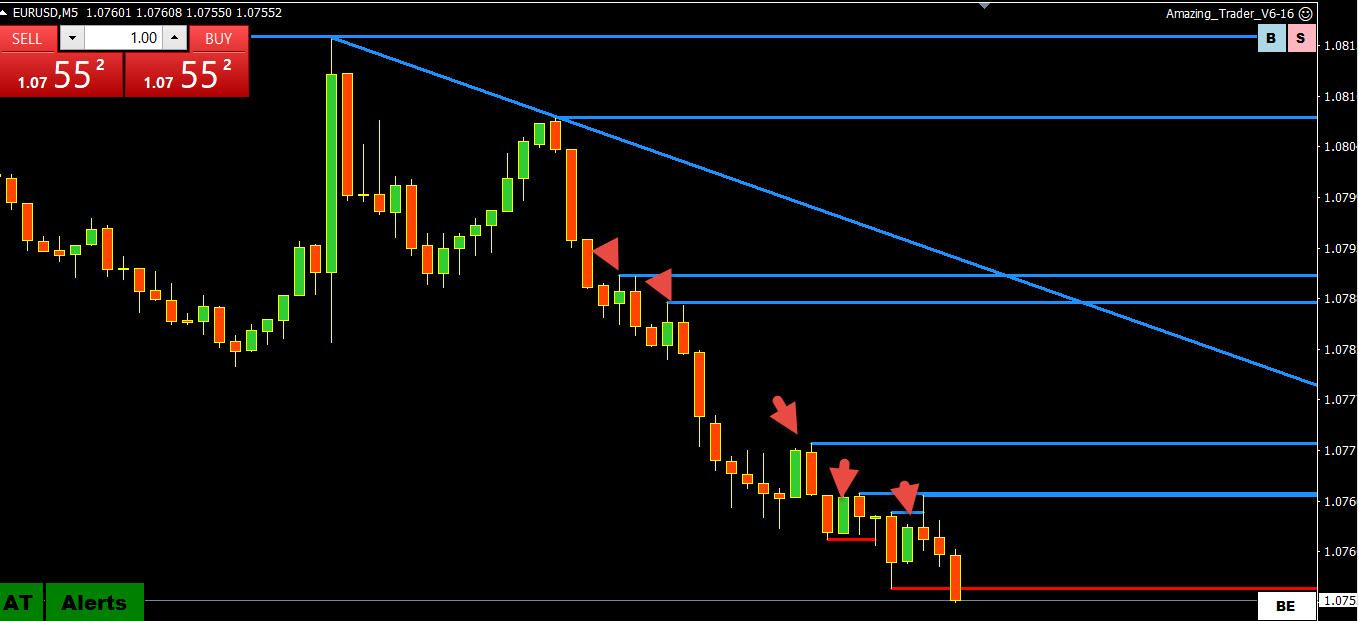
iI am sure it is tempting but here is a simple way to avoid the temptation to pick a bottom until there is a reason to do so.
I use AT lines (blue domiating) with no retracements) but here is another way by just looking at this chart.
Count how many red vs green candles you see and notice there have not been 2 green candles in a row. When you start seeing green candles building one after another you can say the selling is likely over.
Note, I was raised using bars so what I see on candles does not come from a textbook, just common sense.