In addition to using The Amazing Trader to illustrate and discuss the market, I will also share insights you might not find elsewhere.
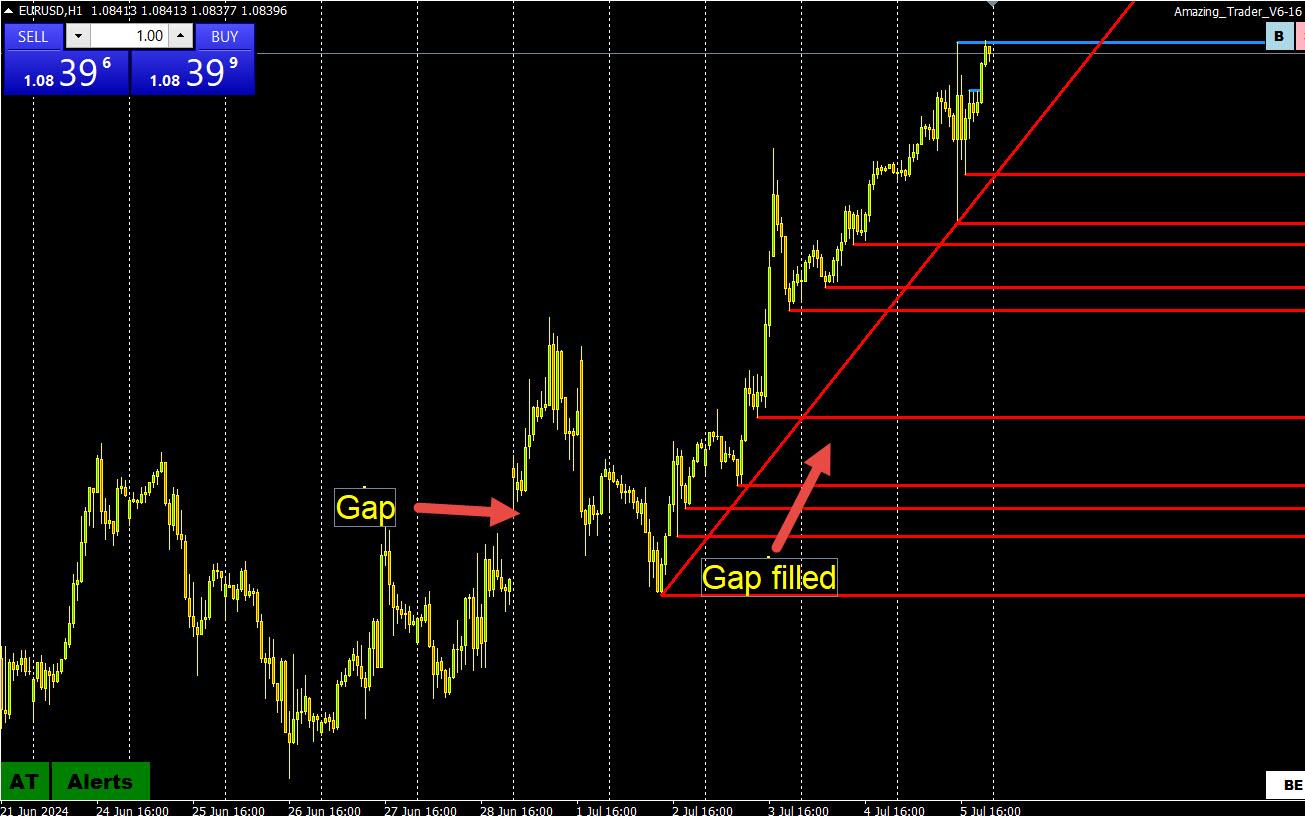
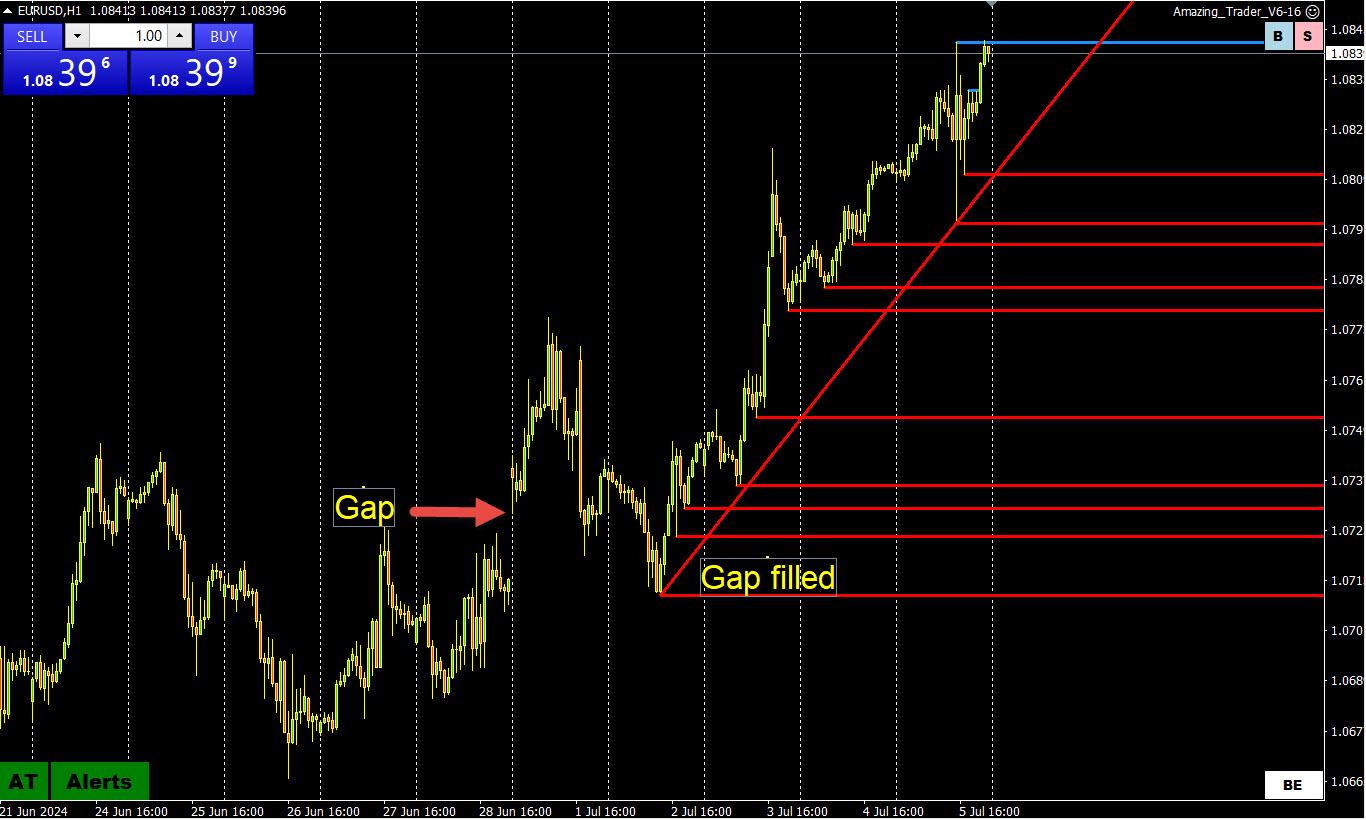
There is a long-time Global-View member who says that opening week gaps in the price of a currency are more often than not filled. He is specifically referring to a gap between the closing week price and the opening price of the next week.
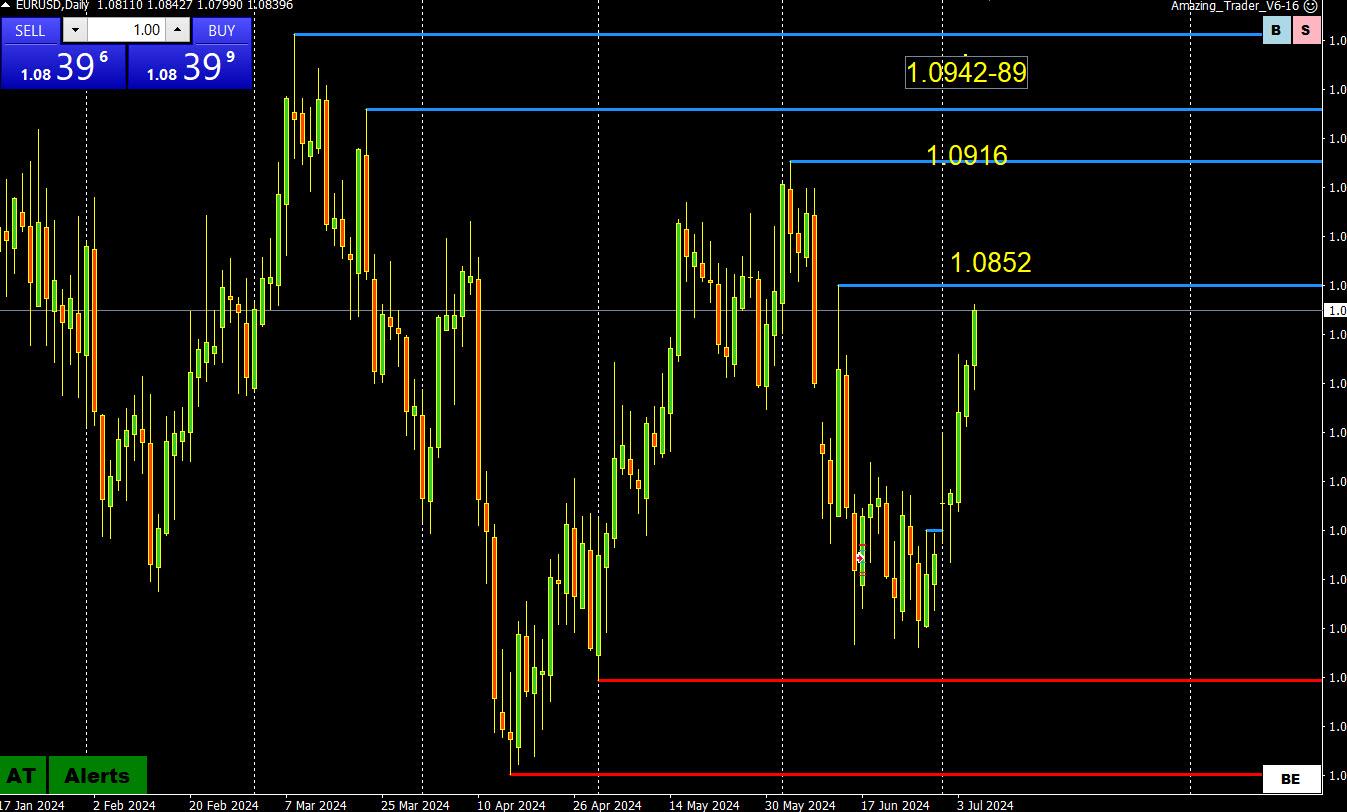
Take a look at this EURUSD chart for the week of July 1, 2024 and note the opening gap on the upside, moved down to fill the gap and then moved sharply higher in the following days.
The Amazing Trader charting pattern (red lines) gave confirmation to a bullish risk after the gap was filled (for another discussion).
Most traders use charts to trade but my guess is that few have stopped to ask why the technicals that they use work. Once you understand why, you will be able to anticipate which levels or tehnical indicators should produce a market response, as you will see in this short video and the write up below it.
Why does technical analysis work?
The answer may come as a surprise but it will help you to use technical analysis to predict future price action. This is a concept I want you to understand so you can use technical analysis and charts to your advantage.
Some pure chartists may want to take me out and burn me at the stake for heresy as I have a different view of why technical analysis works. Some see it as predictive, like Elliott waves. I see it the opposite. It is not predictive by itself but rather you can use it to predict price behavior and here is the reason why.
There is nothing magic about technical analysis. It works because those who trade and follow markets use it. If they didn’t use it, then it would not be considered useful for trading. Let’s say the 173 day moving average was considered to be more important than the 200 day moving average. There is nothing magic about this level other than it becomes significant because more people use it in their trading.
In other words, the more people who use the same technical indicator, the more significant it becomes, I personally prefer to focus on chart levels, as I explain below, as it becomes easier to predict the reaction when a level holds or is broken.
Models by themselves do not predict future price behavior. Anticipating how technical traders will react to changes in price can give a clue as to market direction and momentum. This is common sense.
So if I am the only one looking at a specific level, does it really matter?
I prefer to focus on specific chart levels as they are more likely to appear on most traders’ charts. As an example, I am keen on using trendlines but I have to keep in mind that my line may differ from others based on my data differing or how I draw it. The same is true for moving averages (depending on what closing rates are used) and retracements (depending on what range and time frame is used). This is why I focus mainly on chart levels as it is easier to predict the reaction knowing others are looking at the same points as well.
For example, let’s say the key support/breakout level on the downside in the EURUSD is 1.0660 seen across multiple time frames. You can then assume there will be a reaction by technical traders if this level holds or is decisively broken.
So why does technical analysis work?
It works because people use it. The more people who use it the more significant it can become. How can you predict price behavior? The first step is to identify key chart levels and then anticipate the reaction if they hold or are broken.
You can find ways to identify key levels on your own but I find the best way for me is by using The Amazing Trader charting algo, which is programmed to use my uncanny ability to identify key chart levels and deliver them to charts in real-time.
In my updates in the Trading Club, I plan to show how to use this knowledge to take advantage of predictable behavior by technical traders and use it to trade.
NEW YORK, July 5 (Reuters) – A recalibration of how the U.S. presidential election plays out is causing bond investors to bet yields stay higher for longer as November approaches.
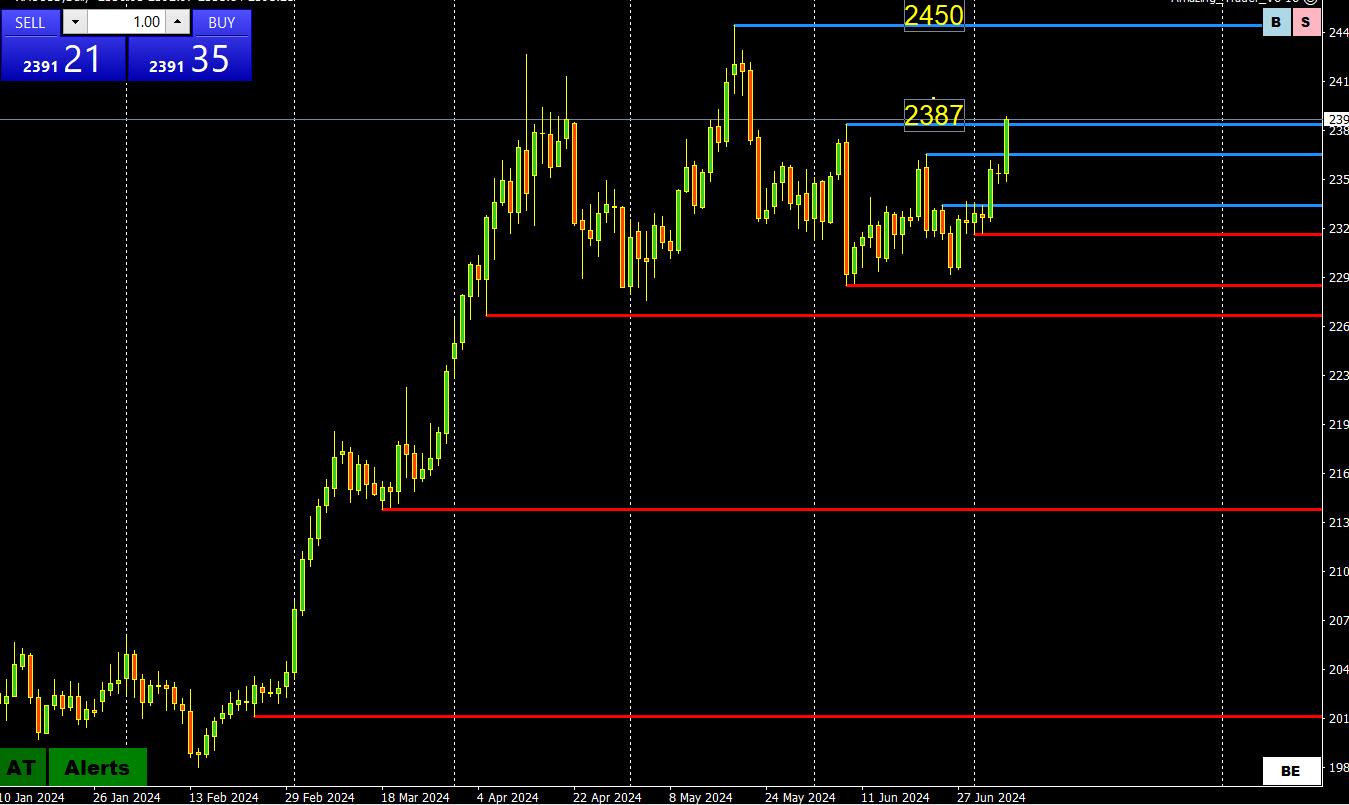
Nice comeback for gold, which needs to establish above 2387 to put the major 2450 high on the radar if it can then get back above 2400. In any cse, thoughts of the downside have been put to rest for now..
EYE ON YELLEN
and the UK
–
According to NYT
“Rachel Reeves, Britain’s First Female Chancellor, Turns to Janet Yellen for Inspiration”
Rachel Reeves, who will oversee Britain’s budget, is expected to pursue an agenda influenced by Janet Yellen’s more activist approach to job-creation and investment in the United States.
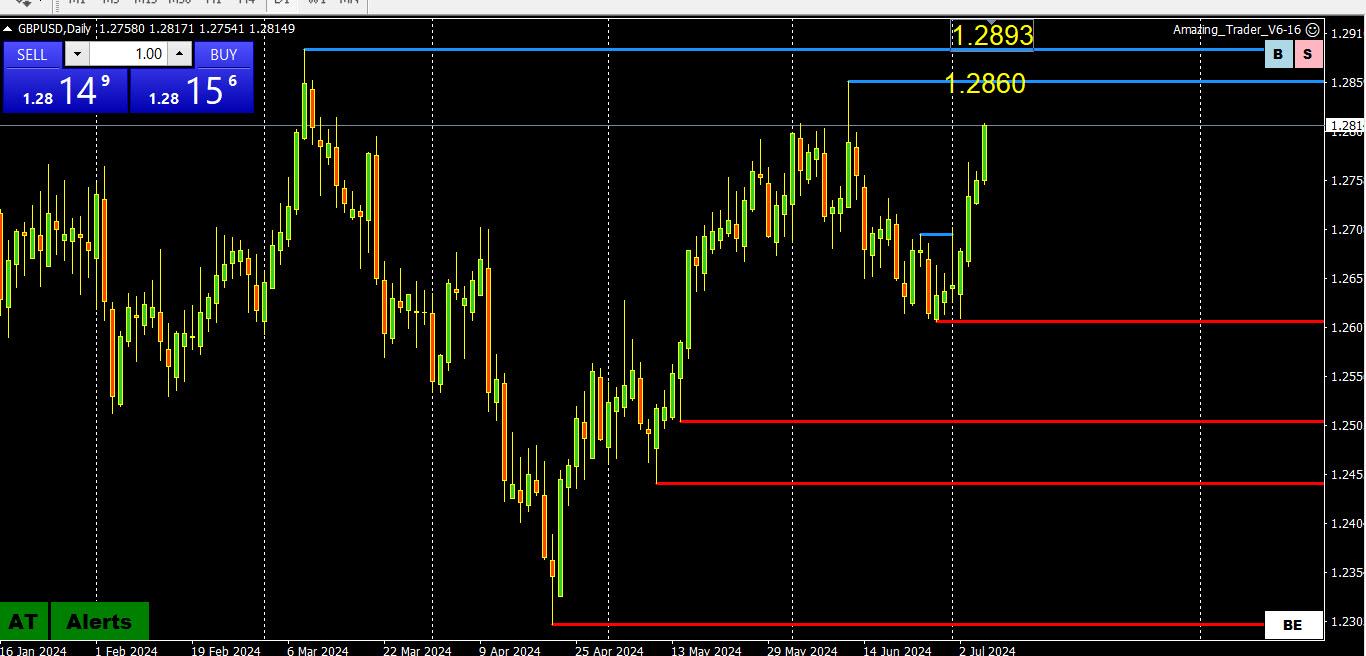
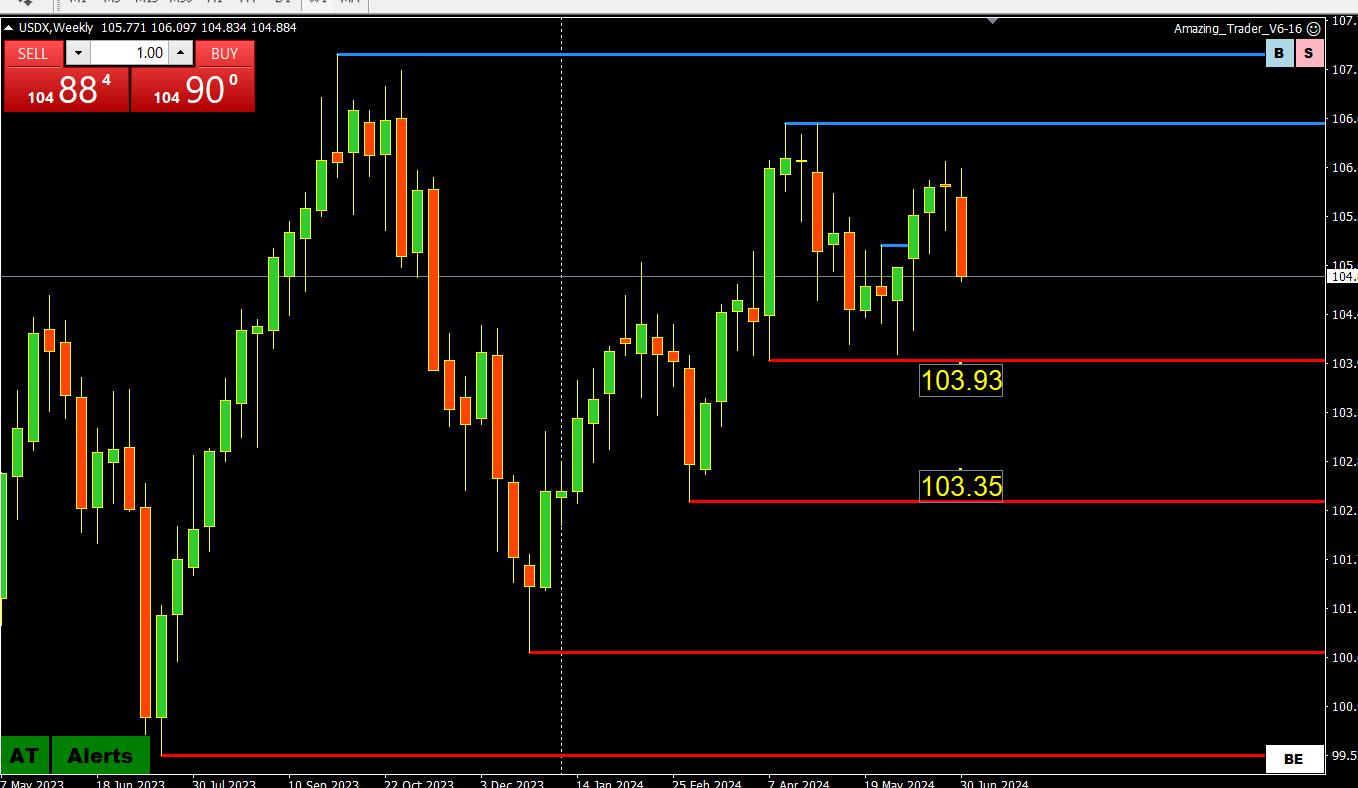
You don’t need a USDX chart to tell you the dollar has turned defensive vs, currencies such as the EURUSD (57.6% of the index) and GBPUSD.
So, it pays to take a look at a USDX weekly chart and what are the targets on the downside. In this regard, the one that stands out is 103.93 (and 103.35 below it), exposed as long as the index trades below 106, greater risk if it stays below 105..
Note USDX is often seen as a proxy for the EURUSD, which makes up 57.6% of the index.