Whatever orders were behind the GBPUSD retreat seem to have run their course (look at GBP crosses, including EURGBP which has backed off after .8460 resistance held).
one “that moved the central bank closer to lowering interest rates when he suggested Tuesday that a further cooling in the labor market could be undesirable.”
I have perused, searched and examined cnbc’s 2:13:35 worth of powell’s live video and transcript but could not find nick’s claim (hallucination ?) that Jerome said “that further cooling in the labor market could be undesirable.”
Comments ?
So far it makes me wonder what game nick is playing.
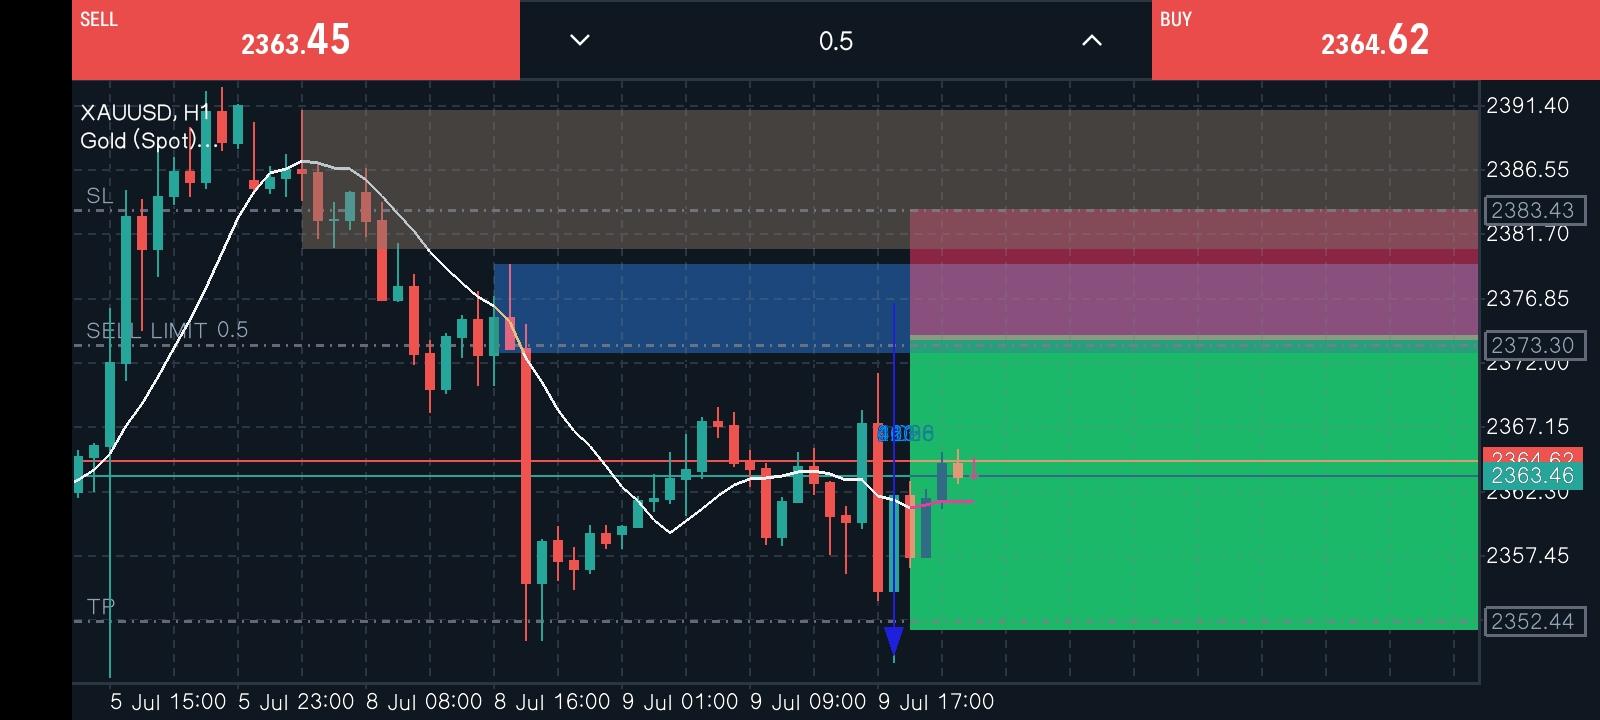
Mark down Monday’s USD lows and see how the market trades if it distances from them… and whether there is a Monday Effect week or not
This is a term I coined to identify a forex trading pattern that I watch out for each week. I call it the Monday Effect and when it plays it, there are usually significant moves in the market. So, you need to be aware of the Monday Effect, which I reveal in the following article…
In your trendline post, are you saying that you copy the broken trendline with the same angle and paste it into a new chart. The key is to use the same angle?
I draw trendlines differently but am always open to new ideas.
Good David – you are watching for highs and lows , and I guess this is “Supply/Demand” style.
And it is all fine as long as it works for you, really.
But when you go with a position taking based on unknown factors ( you can’t really know where are the orders placed – that is what you actually see as Demand/Supply zones – that is only in hands of Higher powers like Central Banks and several Monster banks ) , sooner or later you gonna get hit, and hit hard.
Here we will go over different techniques and styles, and ultimately build trading systems that will make your job easier.
There are many tricks and tips that we are going to reveal, and test in real time conditions.
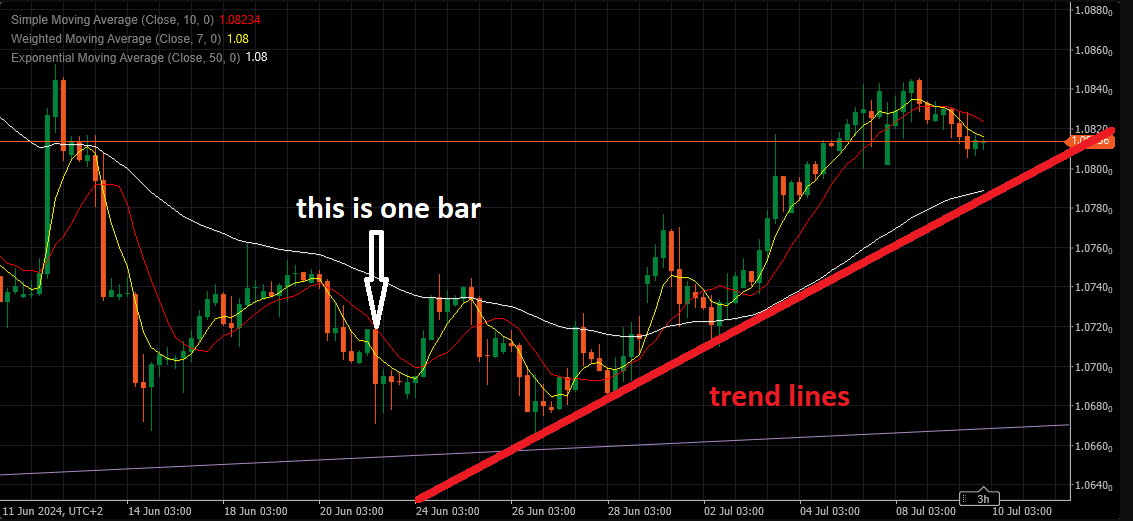
Most of you already know how to draw the trendline : easy –connect two or more points on the chart ( two lows or two highs ) and you have it.
So what can I show you that you don’t already know ?
Well, the way I do it is with the twist, plus there are some untold rules , that no one so far said it out loud.
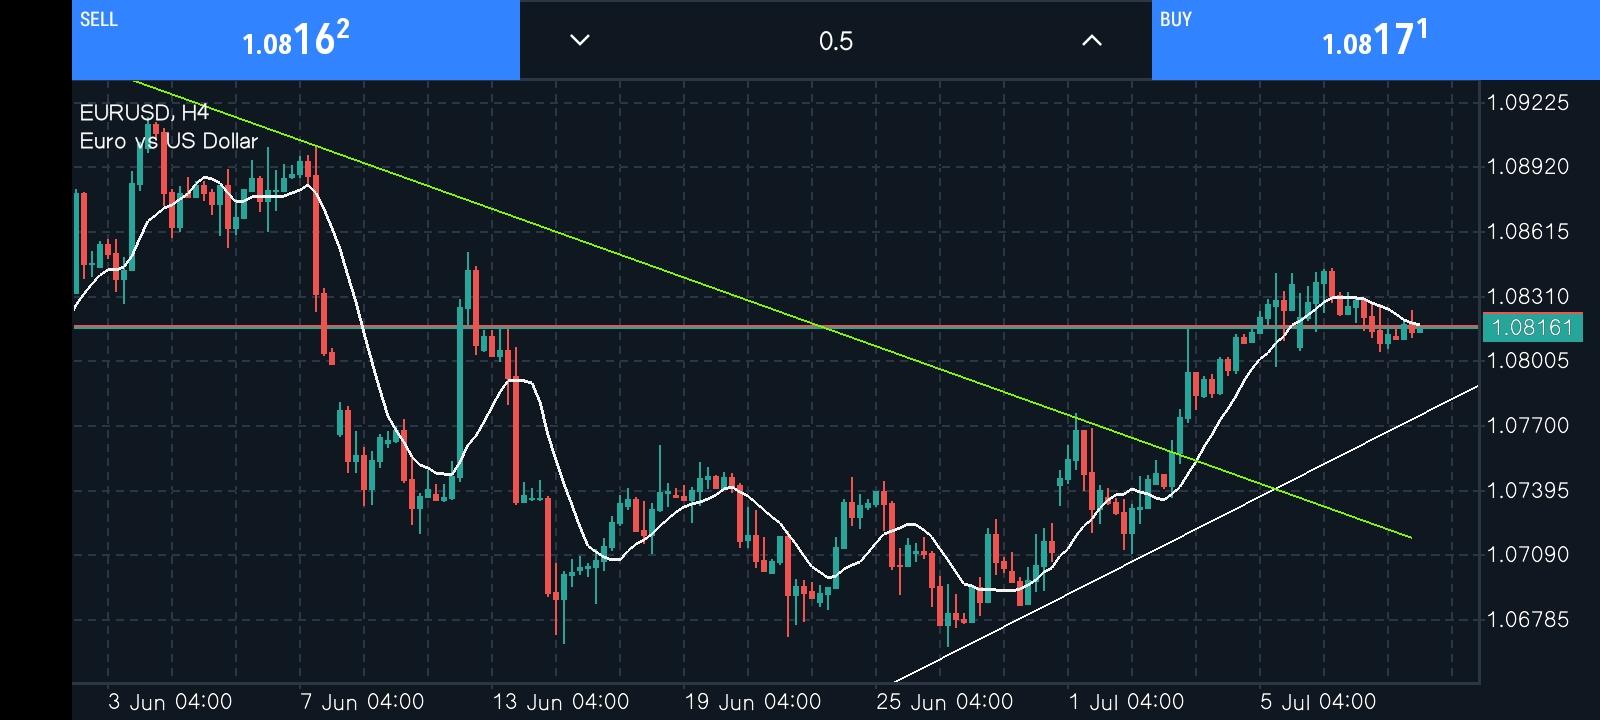
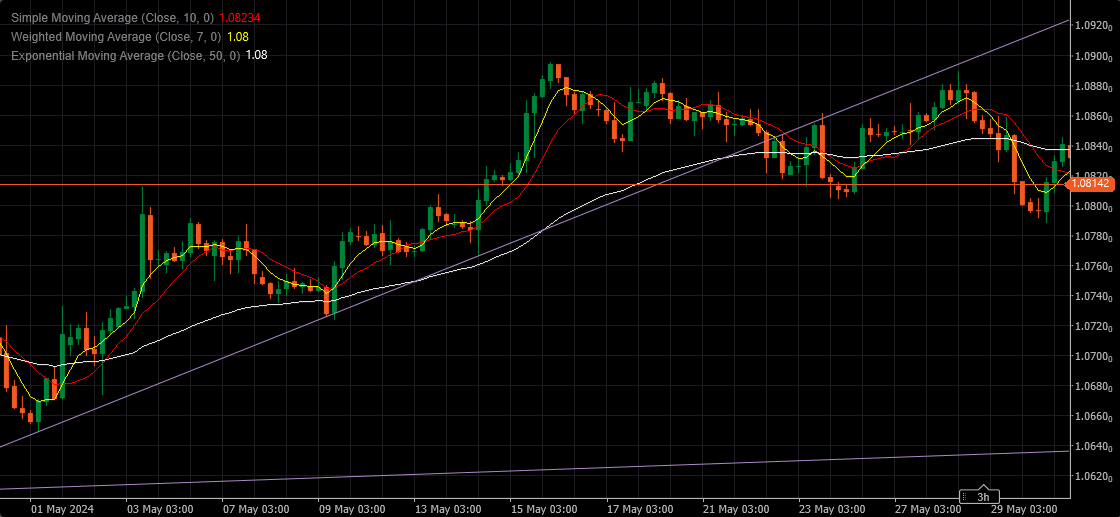
Look at the first chart – I know, it is a past performance and easy to pick up the trend and tops & bottoms – only two things I want you to pay attention to :
First is the clear rule – once the Support trendline gets broken, becomes a Resistance trendline
Second – every trendline can be penetrated, but to declare it Broken, at least two consecutive bars have to close Below / Above it
So I have found previous trendline – good for me….but how does it help you in your trading ?
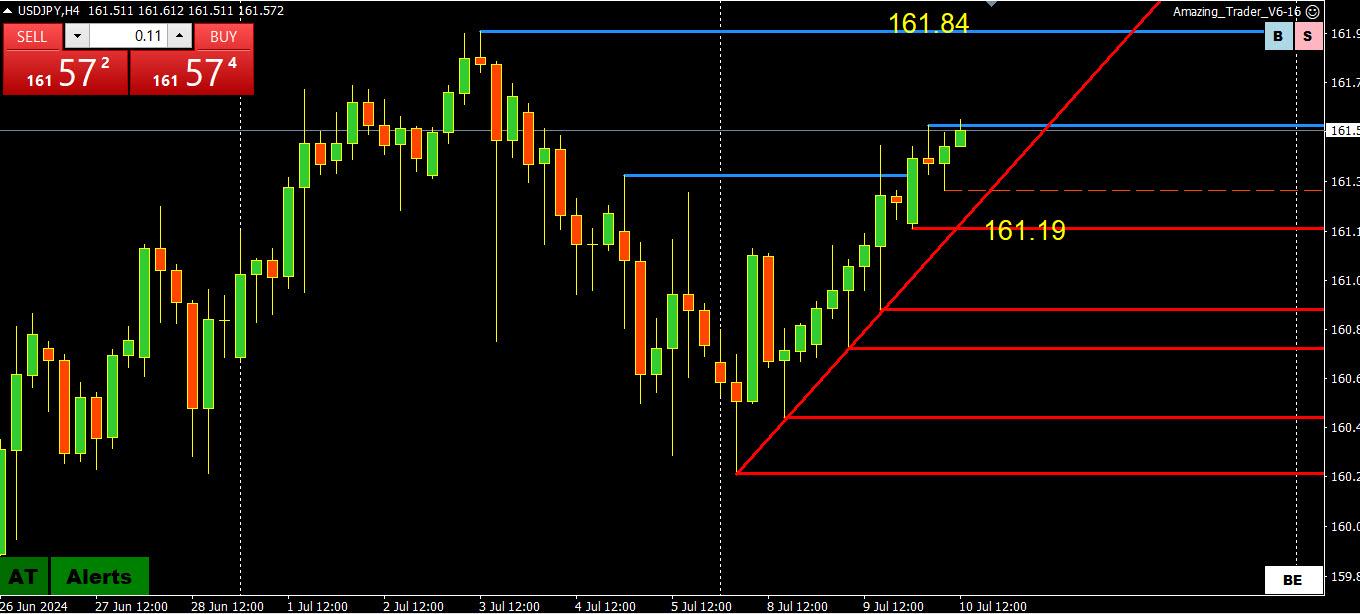
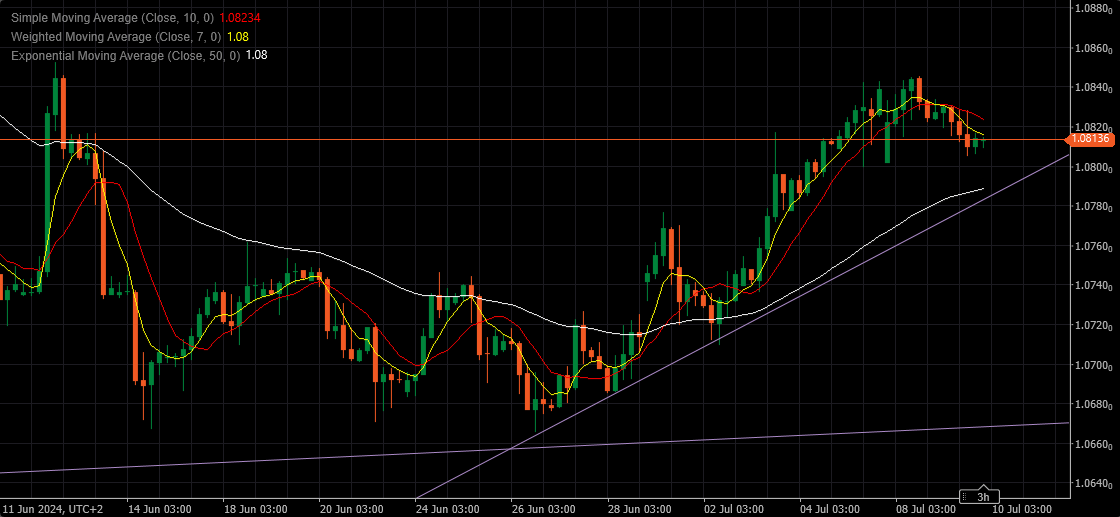
Look now at the second Chart:
That Support trend line was there from June 26th – I had it in place the moment they hit that Low.
How ?? Do I have a crystal ball ?
Nope – That is exactly the same Support trendline from the previous chart – I have cloned it ( copied it ) and placed on that low.
I did that each time they left the low behind.
Once you find an appropriate trend line in past, check it out on different occasions – if it fits, you got your Psychic Trend Line – it is always under the same angle, and can help you greatly to predict future moves , or at least give you way more clear view of future events.
– Always under the same angle
– Great warning system
– Gives you the idea where the market actually moves – or can move