EURJPY 161.55, USDJPY 148, EURUSD 1.0815
Large order to buy EURJPYÂ
EURUSD running into resistance above 1.0820
Since EURJPY = EURUSD x USDJPY
If EURUSD can’t move higher, the only way for EURJPY to move higher is via a firmer USDJPY
If 148+ proves tough, then the only way EURJPY can move higher is via a firner EURUSD
Note, stocks backing off earlier highs.
USDJPY 4 HOUR CHART – Â Watch EURJPY
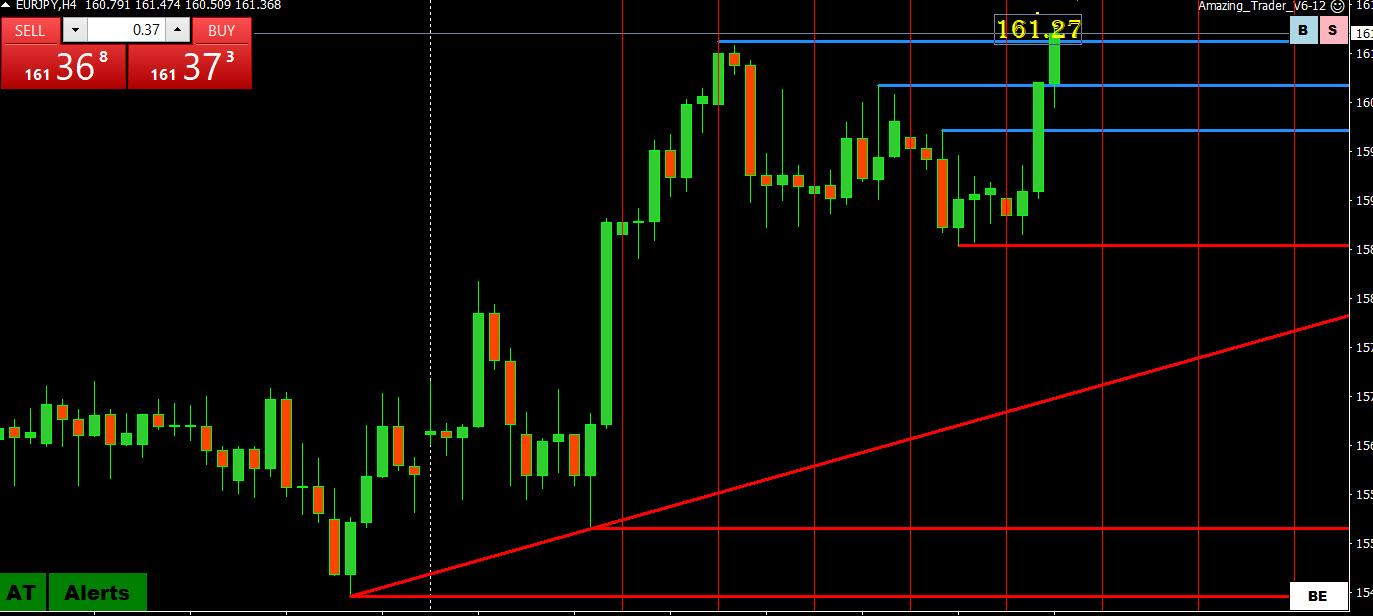
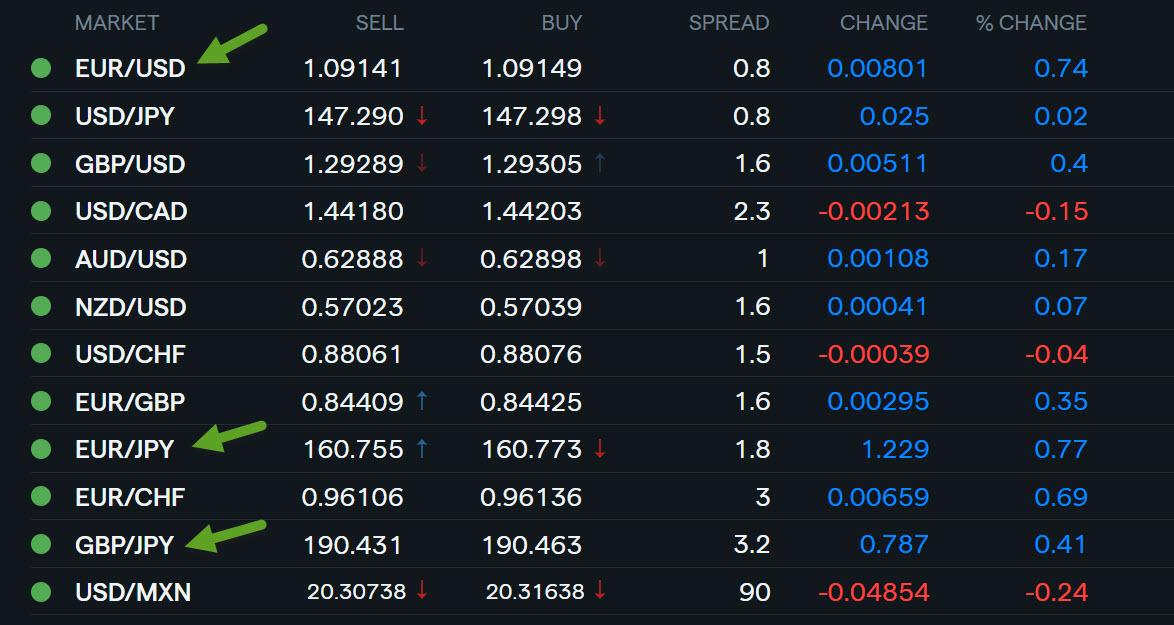
As I have noted many times, when you see the JPY diverge vs how other currencies are trading vs the dollar you can assume a cross flow is behind the move.
This was the case earlier where EURUSD was bid and so was USDJPY. (Note a firmer EURJPY).)
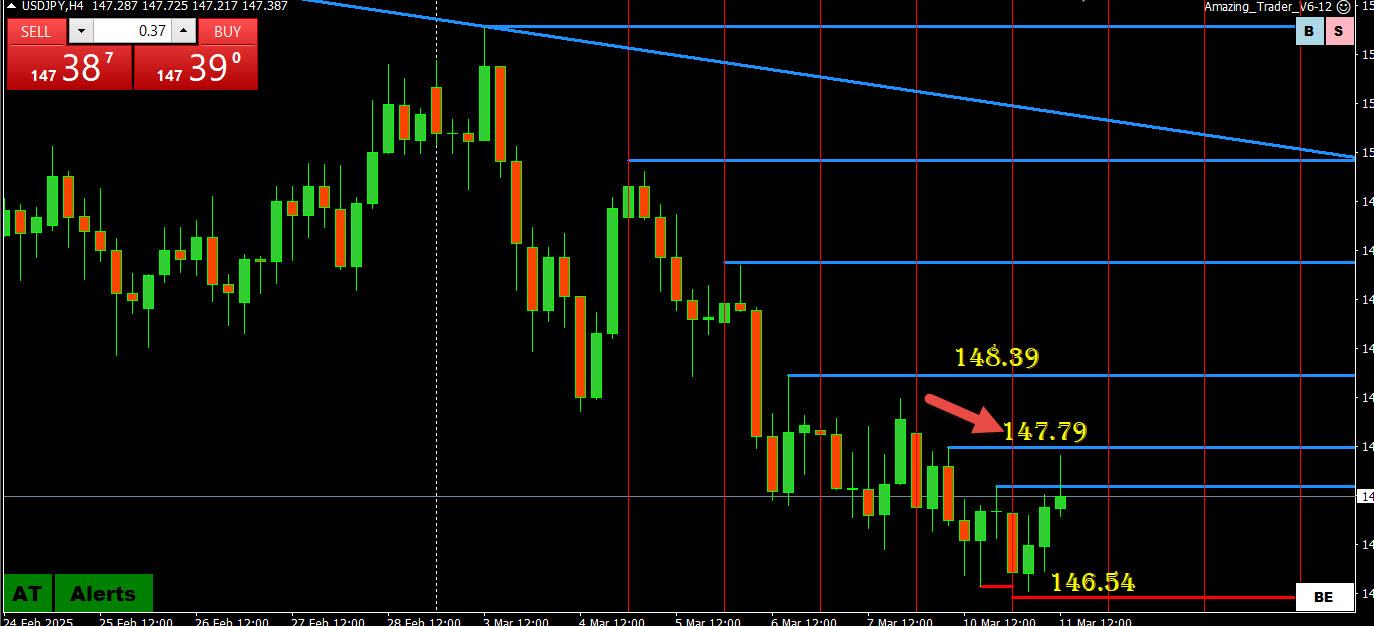
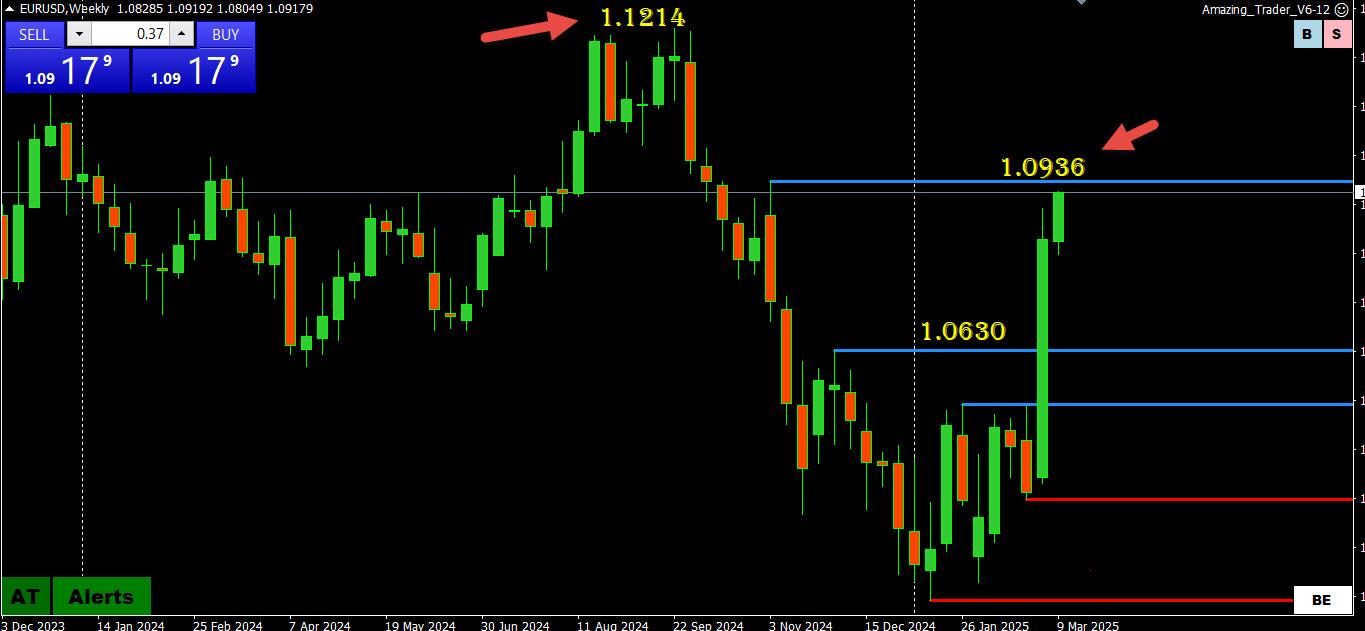
Looking at the chart, you can see  how 147.79 resistance capped the upside.
Only back above this level and 148+ would suggest a greater retracement risk.
On the downside, below 146.50-55 would be needed to start a fresh leg down.
Otherwise range is essentially 146.50-147.80.with one eye on EURJPY and the other on the risk mood set by US stocks
US OPEN
Sentiment improves modestly after Monday’s hefty losses, and DXY hits fresh YTD low awaiting further Trump updates
Good morning USA traders, hope your day is off to a great start!
Here are the top 4 things you need to know for today’s market.Â
4Â Â Â Things You Need to Know
·    European bourses are mixed; US futures are firmer attempting to consolidate following the prior day’s hefty losses.
·    DXY hits a fresh YTD low as EUR/USD reclaimed 1.09 on German defence spending optimism.
·    USTs hold near unchanged while Bunds slump on the latest fiscal updates.
·    Commodities broadly supported by a diving Dollar; XAU back above USD 2.9k.
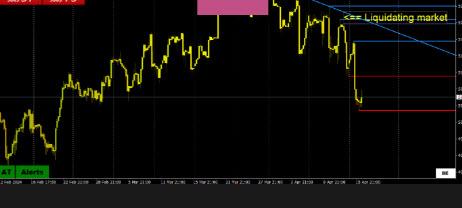
After seeog this headline, Hedge funds unwinding risk as in early days of COVID, Goldman Sachs says, I s thought of this blog article, which is worth revisiting. as the stock market meltdown is a classic example of a liquidating market.
What is a Liquidating Market and How to Trade It?
XAUUSD 4 HOUR CHART –Opposing forces
XAUUSD facing opposing forces
Safe haven flows vs. hedge fund unwinding of risk
Glass half empty or full 2930 tested several times vs repeated bounces from below 2900.
One level I have been talking about is to use 2881 = midpoint of 2832-2930 as a pivot (low today was 2880).
EURUSD WEEKLY CHART – 1.10 LOOMS
As I pointed out in Will EURUSD Make a Run for 1.10? the break of 1.0630 exposed a bid until 1.0936, a potential tough obstacle.
Above 1.0936 would expose 1.10, 1.1214 and the major 1.1284 level.
On the downside, look for a strong bid while above the former 1.0888 high with support as long as it trades above 1.0835.
Using my platform as a  HEATMAP shows
EURUSD, which lagged yesterday jumping back into the lead, extending its high above 1.09.
Others following with a lag except cUSDJPY, which is about unchanged after leading yesterday as  stocks steadied overnight.
A very light calendar today leaves the focus on US stocks to set the risk mood and headline news.
This headline, which came out earlier, may be helping to give EUR a kift
Posted in our blog
The stars seem to be lining up for a weaker USDJPY.
NIO Inc.
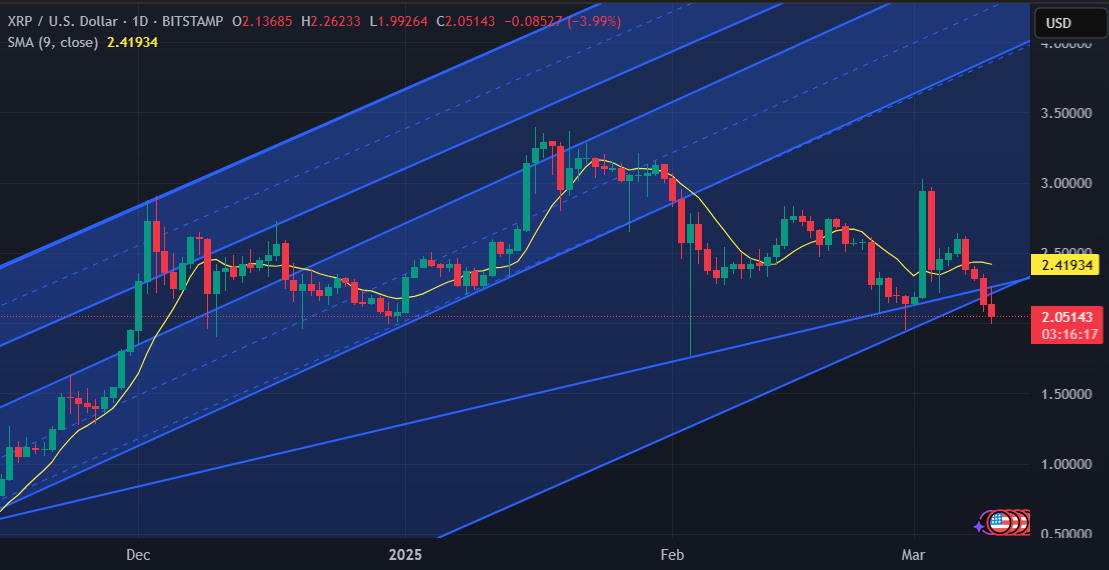
Another test of the Upside and another failure…or at least that’s how it looks to me.
I don’t want to be a party pooper, but this doesn’t look healthy for Nio.
Next move should be Down and if it follows that trendline going down, it might go as low as 3.85 and that is below famous 4.00 –Â a platform for Up attacks.
However, if 4.00 holds attacks once again, picture would change for a better…
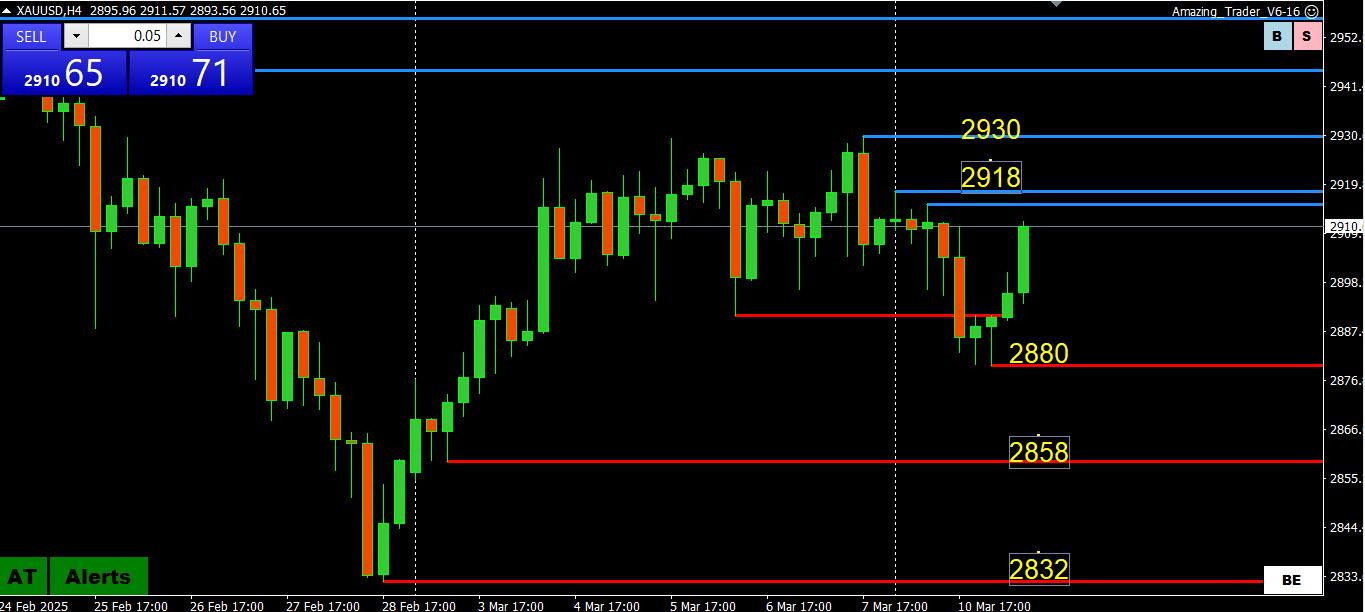
US500 WEEKLY CHART – 4 down weeks in a row
Similar to NAs100 it is now 4 down weeks in a tow… back above last week’s high would be needed to break the pattern
As noted earlier,
Let’s call it the Trump Retreat that has US500 trading at levels not seen in almost 6 months.
At a minimum, 5670+ would be needed to slow the freefall but only 5800 would ease the riSk.
Support is a guess so use 5600 and 5500 asa potential pause levelds.
© 2024 Global View