- This topic has 78 replies, 4 voices, and was last updated 6 months ago by Idris Sagamu.
-
AuthorPosts
-
August 31, 2024 at 4:25 pm #11170August 29, 2024 at 5:46 pm #11105August 27, 2024 at 12:34 pm #10992August 26, 2024 at 3:34 pm #10959August 26, 2024 at 9:16 am #10937August 25, 2024 at 11:32 am #10915August 23, 2024 at 1:38 pm #10861
The 10 Commandments of Risk Management for Traders
Please read it carefully and ask as many questions that you might have.
This is not just a “Wise statement” or some deep wisdom – this is what your livelihood in trading depends on !
It is more important to set up your Risk management then to know in which direction the market will move – I Kid You Not !
Once you start to understand the importance of it, I can fill you in with tricks and tips that will make your trading not only professional, but consistent.
Behind it all is a pure math – one that If used in any Casino , they’ll elegantly walk you out of it – Been there, Done that !
Let’s beat the Casino 😀
August 21, 2024 at 11:55 am #10769Falling Wedge
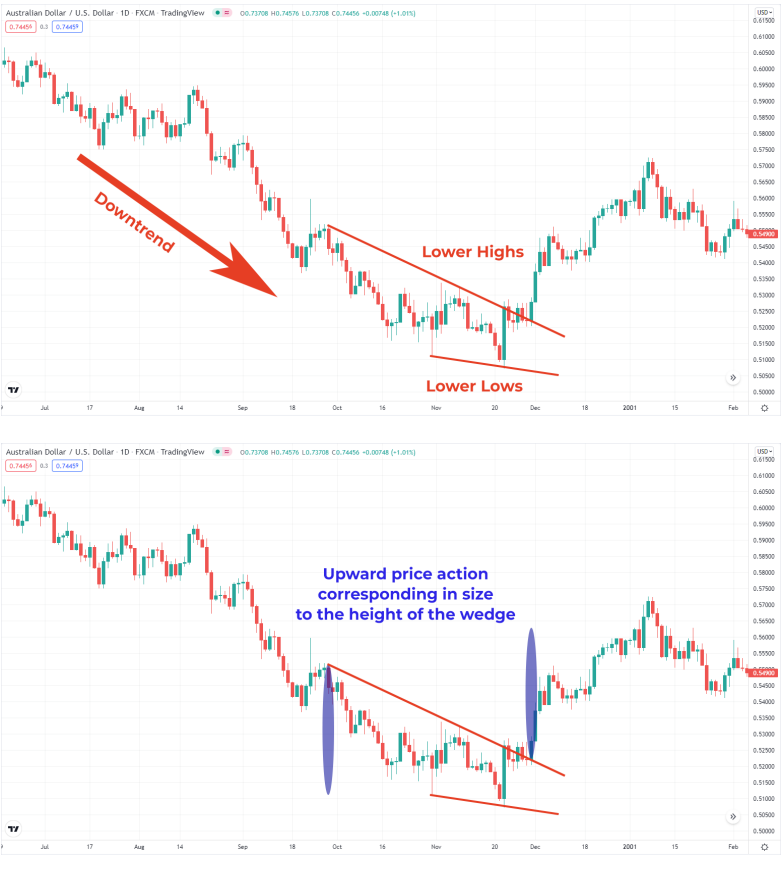
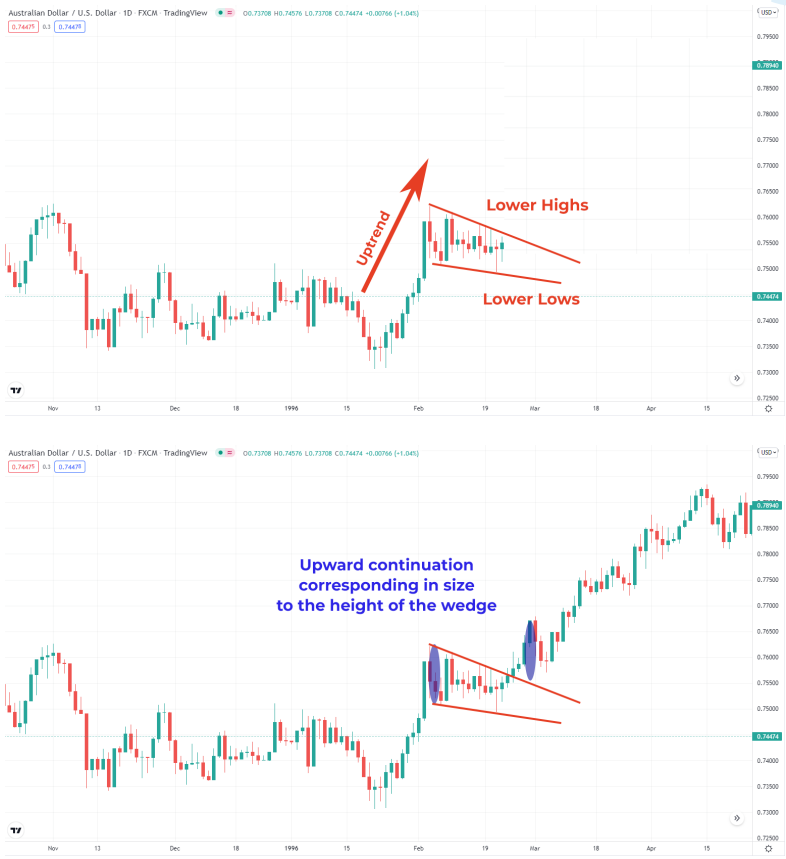
A falling wedge is a bullish chart pattern that takes place when the line slope points down and the trend has been pointed up prior to this occurring. This pattern may indicate that traders are taking a moment to get caught up, but that they are likely to want to push the pair even higher once they are ready to resume the trend.
Key Notes on Falling Wedges:
1. Often leads to an uptrend, which means it’s a bullish pattern
2. Indicates that lower highs are being formed faster than lower lows
3. Falling wedge formation after a downtrend is usually a bullish reversal pattern
4. Falling wedge formation after an uptrend is usually an upward continuationWhy Wedges Matter
Wedges are important in trading because they can serve as either a continuation pattern or a reversal. They work both ways because they are simply signalling that consolidation is happening in the market that you should probably take a look at. When you see these patterns forming, you want to make sure you do not ignore them.Think about using wedge pattern formations in combination with indicators that may help confirm where a trade is going. This may prove useful to you as you try to figure out exactly how to place the right order at the right time.
August 19, 2024 at 4:38 pm #10686Trading Wedge Chart Patterns
What Is A Wedge Chart Pattern?
A wedge is formed on a chart when two trend lines converge. It is a signal that the price action on either side of the trend is decreasing, and it appears as though traders are taking a pause before deciding where they would like to potentially move the market next. It is a big deal when wedges appear in these patterns because it means that there is a pause in the current trend that has been developing, and a new trend may be ready to start to take over.
Rising Wedge
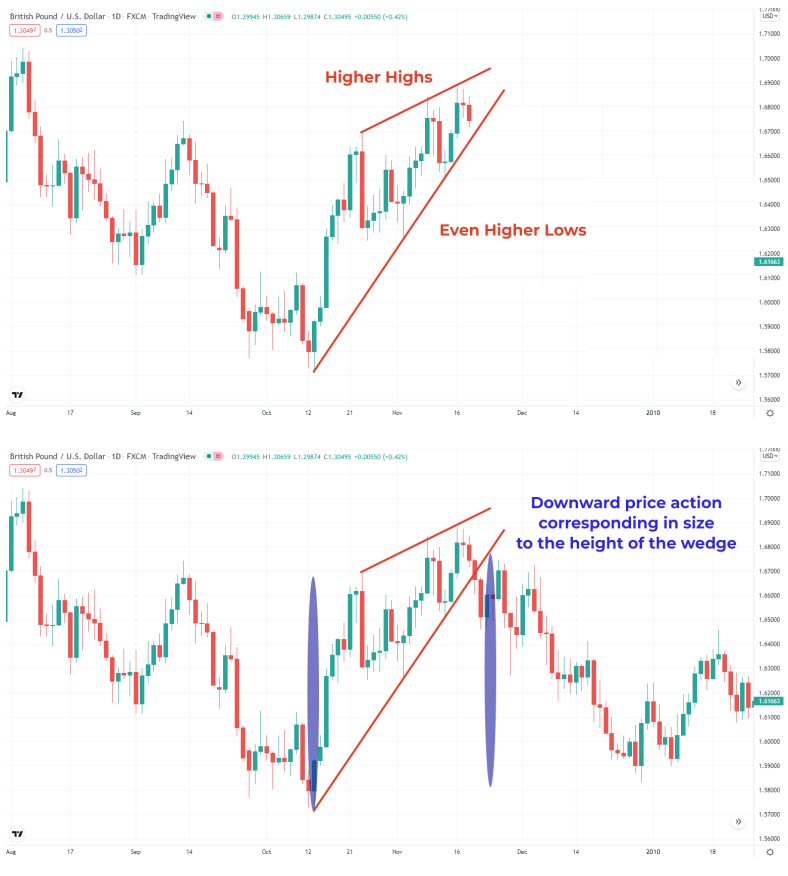
This is a bearish pattern that forms after the pair has been trading down for some time. It takes place when the slope of the lines is pointed up, and the trend until that time has been down. The rising wedge formation may be a sign that it is time to place a sell order, or at least to get out of the buy order that you have already placed previously.
Key Notes on Rising Wedges:
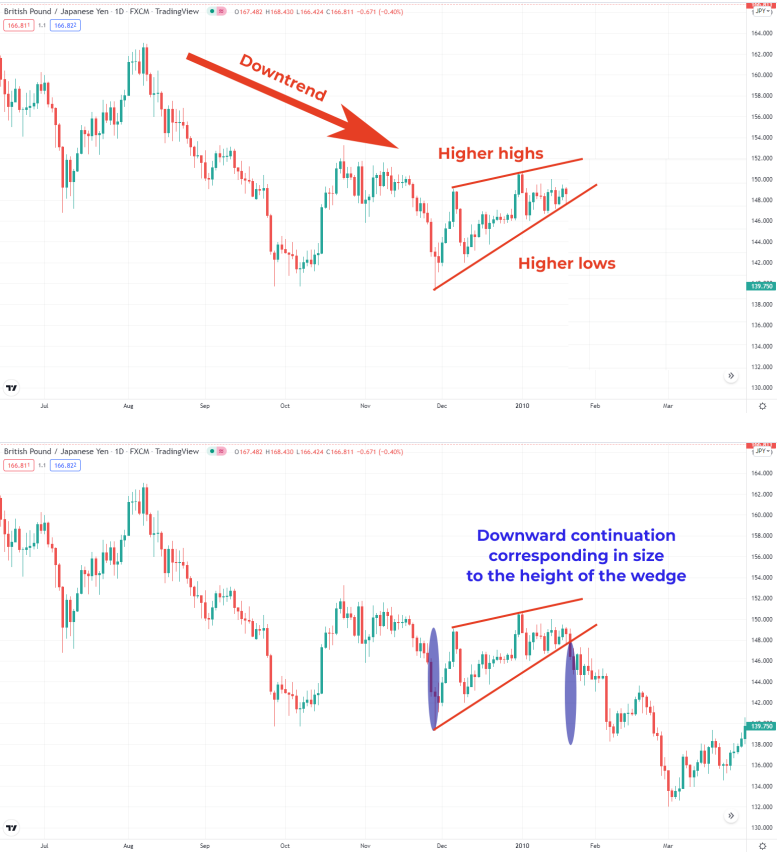
1. Often leads to a downtrend, which means it’s a bearish pattern
2. Indicates that higher lows are being formed faster than higher highs
3. Rising wedge formation after an uptrend is usually a bearish reversal pattern
4. Rising wedge formation after a downtrend is usually a downward continuationAugust 17, 2024 at 1:27 pm #10637Bilateral Chart Patterns
These are chart patterns that are more challenging to use because they may indicate that a currency pair is about to head in either direction. You may see it continue on the course that it has been on, or it may reserve and head the other way. The only reason why this should matter to you is that it can at least let you know that movement of some kind is likely to occur, and that is important by itself. At least it is letting you know that the holding pattern that the pair may have been in before is about to break and that you can take advantage of that break by placing trades in anticipation of movement.
You need to be extremely cautious when working with bilateral chart patterns because you do not want to get caught up on the wrong side of the pattern. That said, you can probably make some pretty impressive trades for yourself if you are keenly aware of the bilateral chart patterns that exist out there and do what you can to make them work for you. It is a small thing, but it can provide you with some insight into how the markets work and how to position yourself to take advantage of them.
Bilateral chart patterns include:
1. Ascending triangle
2. Descending triangle
3. Symmetrical triangle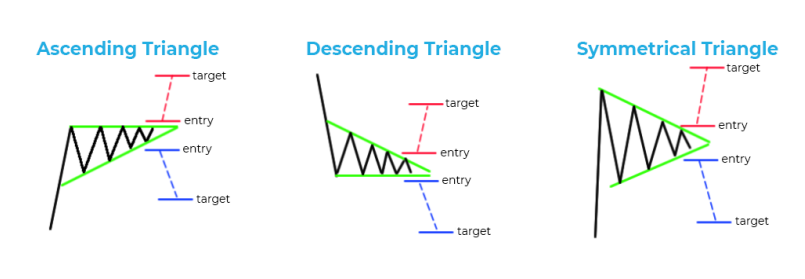 August 15, 2024 at 4:01 pm #10569
Continuation Chart Patterns
There are some other patterns that you might want to know about while you are trading as well. These are known as continuation chart patterns, and they are indicative of a pattern that is likely to continue on into the future.
What you can do when you see a continuation chart pattern is to realize that the trend that has been dominating the currency pair for some time now may be likely to continue into the future. It is not a guarantee, but you can rest assured that there is at least some backing to the idea that a continuation chart pattern is indicative of a trend that may continue into the future.Patterns include:
1. Falling wedge
2. Bullish rectangle
3. Bullish pendant
4. Rising wedge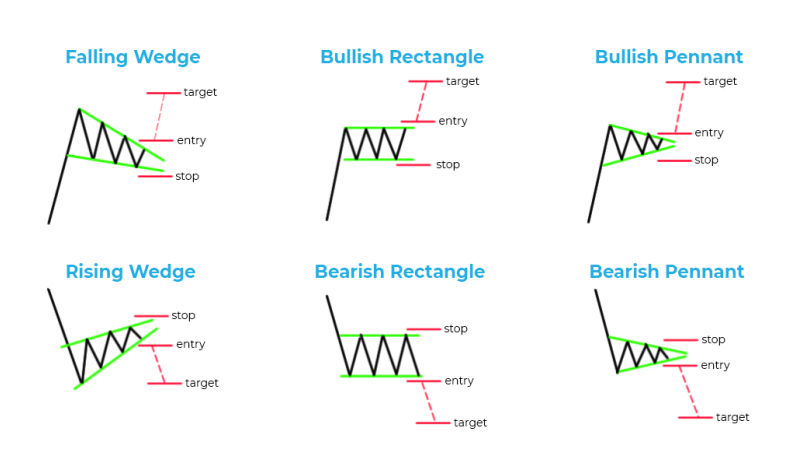 August 14, 2024 at 3:54 pm #10515
Reversal Chart Patterns in Trading
These are chart patterns that indicate that a reversal in the trend may be about to occur. These are important because they can help give you the early signal that you need to bail out of the position that you had taken up to this point.
Additionally, they may be useful in the sense that you can use them to figure out if you would now like to get on the opposite side of a trade that you had been involved with before. Would you like to try to ride the trade in the opposite direction and proft from it that way as well? That option is open to you when you use reversal chart patterns.
If a reversal chart pattern forms during an uptrend, it hints that the trend will reverse and that the price will head down soon. On the other hand, if a reversal chart pattern is seen during a downtrend, it suggests that the price will move up later on.The six primary reversal patterns include:
1. Double top
2. Double bottom
3. Head and shoulders
4. Inverse head and shoulders
5. Rising wedge
6. Falling wedge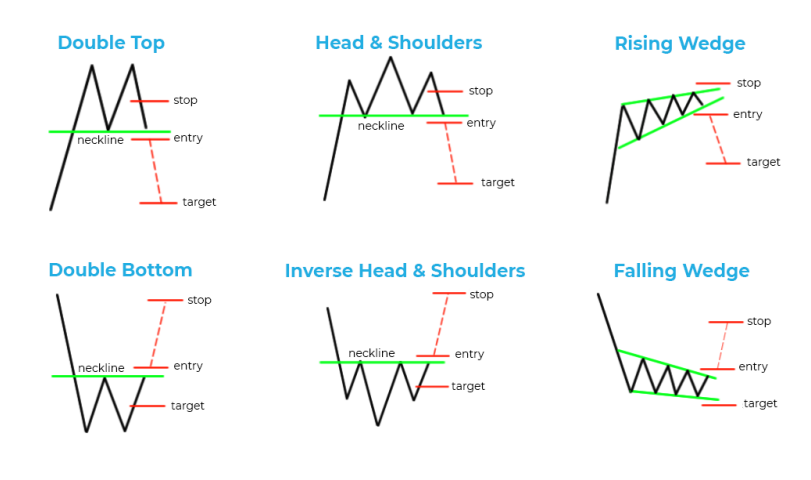 August 13, 2024 at 12:42 pm #10444August 8, 2024 at 6:22 pm #10279August 7, 2024 at 3:45 pm #10228
What time during the day is best to trade
When we talk about many things in forex, most of the time we end up saying the following :
– Possible but not probable
– Can go both ways
– If this then that…
– Buy, but if below Sell…
– And million and one similar thing…
But what we cannot say is “ For Sure”
Well, there is one thing that we can say For Sure, and that is what are the best times to trade – Forex, CFD’s , Metals…
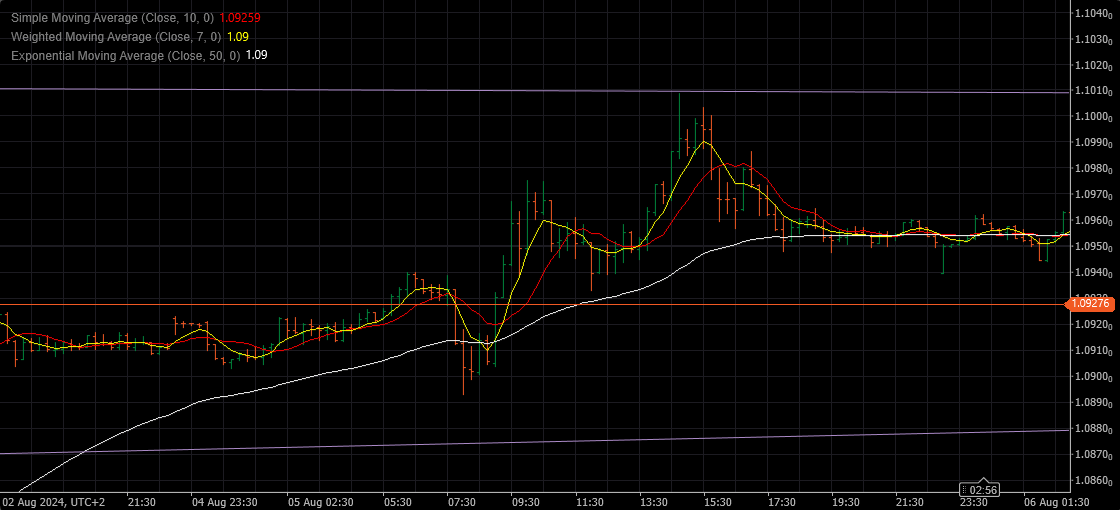
I am going to use GMT so everyone can find the correct time on his/her own charts.
– First real action starts around 05:30 GMT – pre positioning for Europe Open
– 06:00 GMT Europe starts
– 12:00 GMT USA Opens
– 19:00 GMT it is all over
As you can see from this chart ( 15 Min ) that pocket of time – 05:30 – 19:00 GMT is when the market seriously moves.
Sometimes, you can see some nice moves overnight , but it is not as good as the ones above mentioned.
If you trade intraday ( small time frames ) this is the most important information that you need to start trading.
If you Day trade – you are in the same boat.
Only if you trade by Position taking on the daily or even bigger charts , this is not meant for you – you have to wait for your entry/exit rate round the clock.
There are few rules that are also very important :
Avoid getting or being in a position just before and shortly after the following times ( all in GMT ):
– 07:00 – UK opens
– 12:00 – USA opens
– 14:00 & 15:00
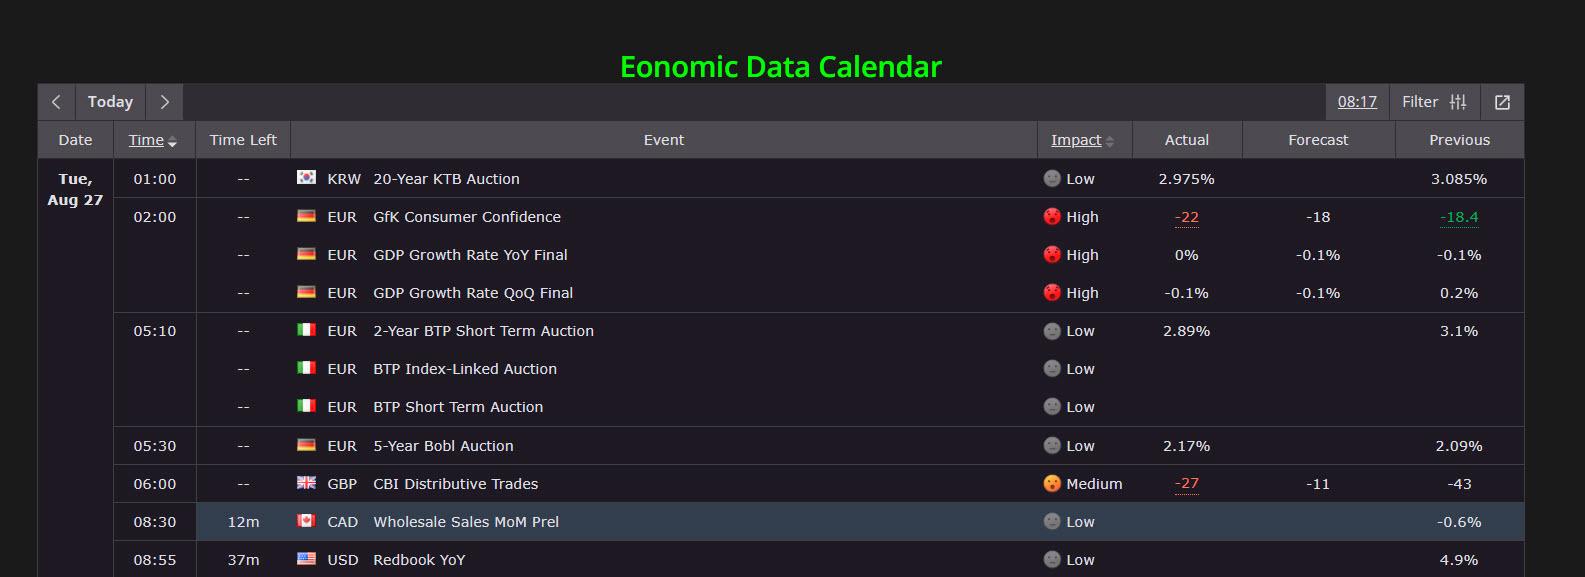
Of course same goes for bigger Data or announcements that we know for up front.
 August 6, 2024 at 6:36 pm #10183August 6, 2024 at 2:25 pm #10163
The 3 Main Fundamental Factors That Affect Currency Values:
Economic Growth and Outlook
Capital Flow
Trade Flow and Trade Balance
Read it in detail HEREAugust 5, 2024 at 2:10 pm #10111August 5, 2024 at 12:42 pm #10091Liquidity
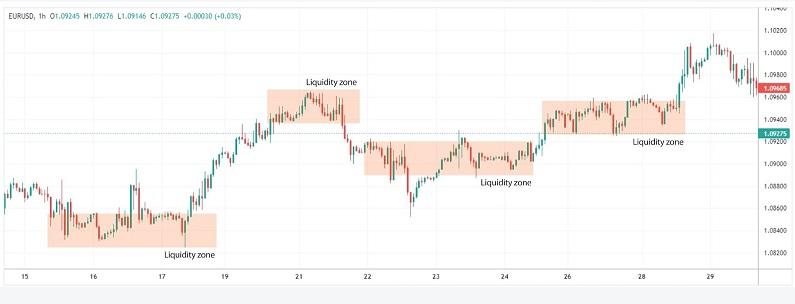
In general, liquidity refers to how easy it is to sell or purchase assets on the market, primarily due to the increased or decreased presence of market buyers and sellers. So, liquidity zones are areas on the specific price chart with elevated buying or selling activity from the market.
Usually, liquidity is calculated by taking the volume of trades or the volume of pending trades currently on the market. Liquidity is considered “high” when there is a significant level of trading activity and when there is both high supply and demand for an asset, as it is easier to find a buyer or seller.
 August 4, 2024 at 11:30 am #10031
Risk Management
I am going to explain in simple words and using examples how to deal with the risk management in trading , and why is it of upmost importance to be in charge of it at all times.
Forex Market– closest to an explanation of it would be a Theory of ( ongoing ) Chaos , and that is not going to help us at all….
So I am going to start with one average trading day :
– you are waiting for hours to get in the position and after all the trades that passed in front of your nose, you finally decide to enter…impatient and in a heat of the moment, or you saw something that was close enough to your system signal, or you felt lucky….or you just accidently clicked with your mouse…
Result is the same – You Lose !
And the result of that loss ( aside of the obvious money loss ) is : Confusion
– When you see what happened, you rush….to make another trade and not only to cover the previous loss, but to get into the profit…
Result – Another loss
There comes the Anger
– As angry as you are at the moment, you execute another trade ( this one must go well, just must )
Result – Loss
Now comes the Fear
– Now you wait and wait and at the end of the day you go in once again…this time a good one, but Fear drives you to close that position with the minimal profit, that only covers a bit of previous losses….
Muted feelings ….you want to feel happy and successful , but reality is way darker….so you go away with the hope that tomorrow will be a better day
And tomorrow the Death Spiral continues….So now you finally get to the last level : Desperation, lack of control and disbelief .
Control ! Something that you cannot have in Forex – not by the long shot …but is that really true ??
Well, you can not control the market, that is pretty clear, but you can exercise a level of control if you use Risk Management – Money Preservation and Loss Control.
How to get there ?
An Example :
I am going to use smaller numbers for easier understanding, but as I said earlier – to have real statistical results you have to use Big numbers.
– Your margin is 500$
– Your Probability is 50% ( 5 wins and 5 losses )
– Your risk per trade is 2% ( so maximum 10$ per trade )
– Your Stop is 5 pips
– Your Maximum Trading Size is 20.000
– So you lost 3 times and won once : -15 pips & let’s say + 2 pips – you are in minus of 13 pips = 26$ loss ( so about 5% of your total margin )
Now you Control the situation in worst case scenarios…
But let’s add another layer of Control :
– You trade with the R/R ( risk/reward ratio ) of 1:2 – lose One to profit 2
– In the above example, your last ( and only winning trade of the day ) had to be at least 10 pips
– So you lost 15 and won 10 – your total loss is 5 pips = 10$
– That way , even the shitty day can end up acceptably ….lousy but not a margin killer.
And now let’s go back and use the Probability – 50%
– 5 losses and 5 wins
– -25 pips lost and 50 pips won
– Total – 25 pips profit
– You might need 2-3 days to come to that, but you will come , as long as you control your R/R, Stop loss, Money management ( so you don’t risk more than 2% of total margin per trade) .
If you apply the above rules to your trading, Control your Greed Level and be fully disciplined , even such a low Probability would make you a profit.
On the other hand, you will fully control the downside and your margin will be always healthy.
Here we will learn how to create Systems with way higher Probability ( like 70-80% and even higher ) , but even with the System of 95% Probability, if you don’t use Full Risk Management, you are going to end up loser…..
It also brings with itself a decent level of Control, so your feelings will be calmed down and you will be able to trade with lesser level of Fear….
-
AuthorPosts
- You must be logged in to reply to this topic.
© 2024 Global View