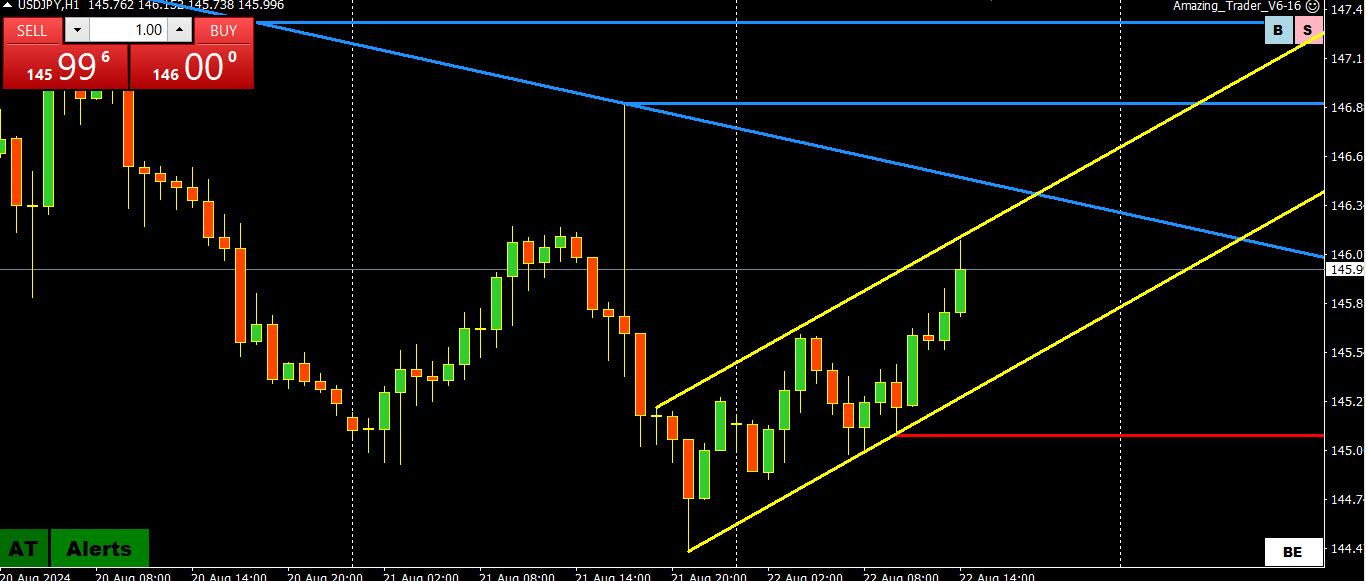
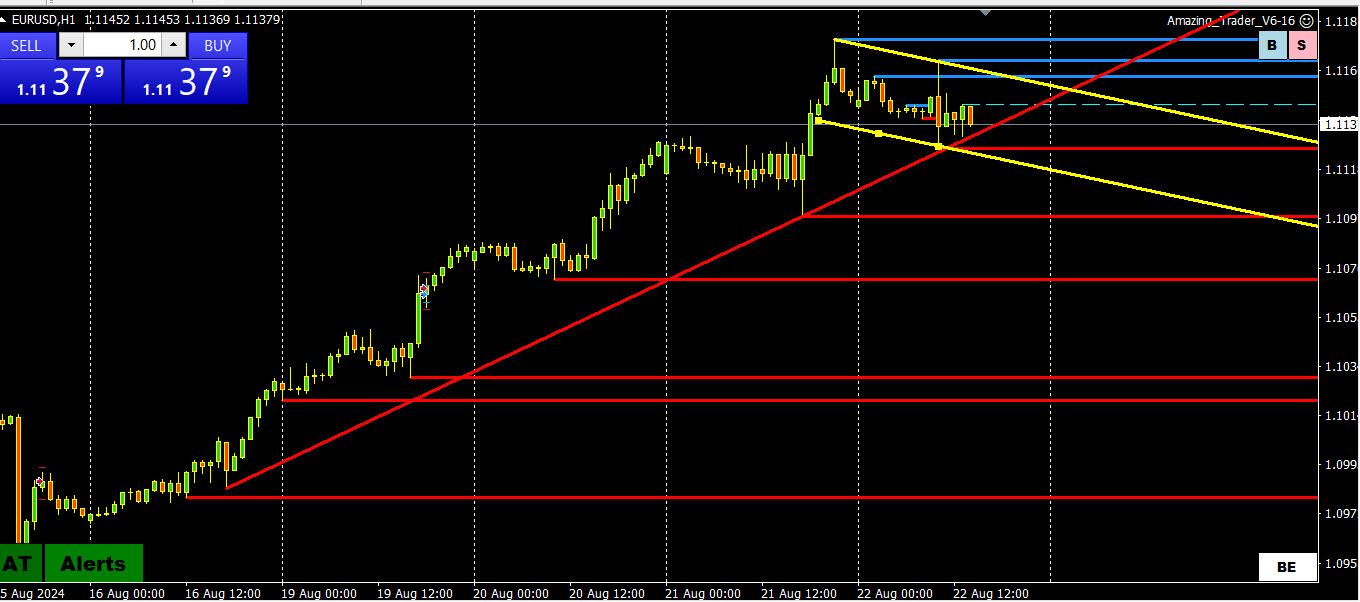
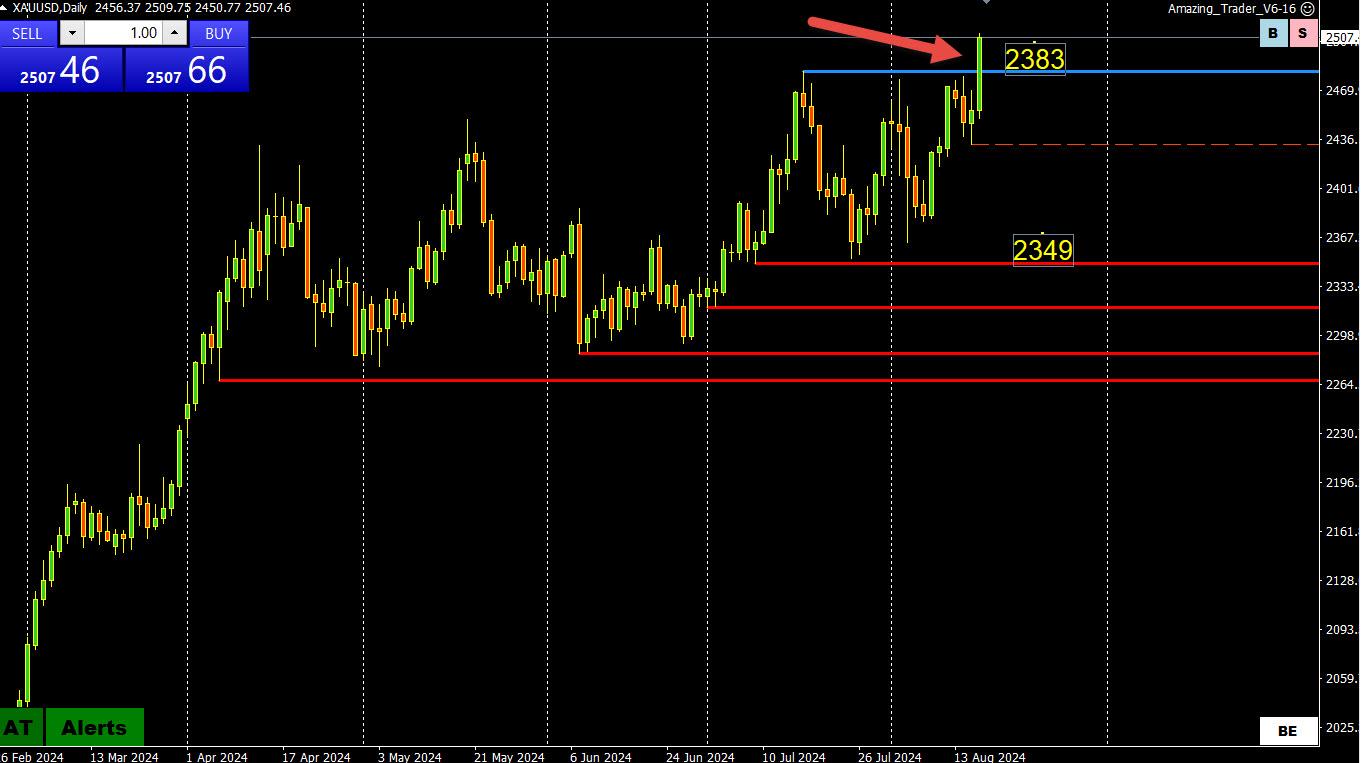
This is so far a correction – as it can be just a sideways one, I would watch for those two Red lines below : sharp angle and horizontal one.
My personal style of trading differs from yours, and for me before I see Pattern emerging , I am flat.
But Buying on Angled Red line would be technically correct , with the Stop just below the second red line – horizontal one.
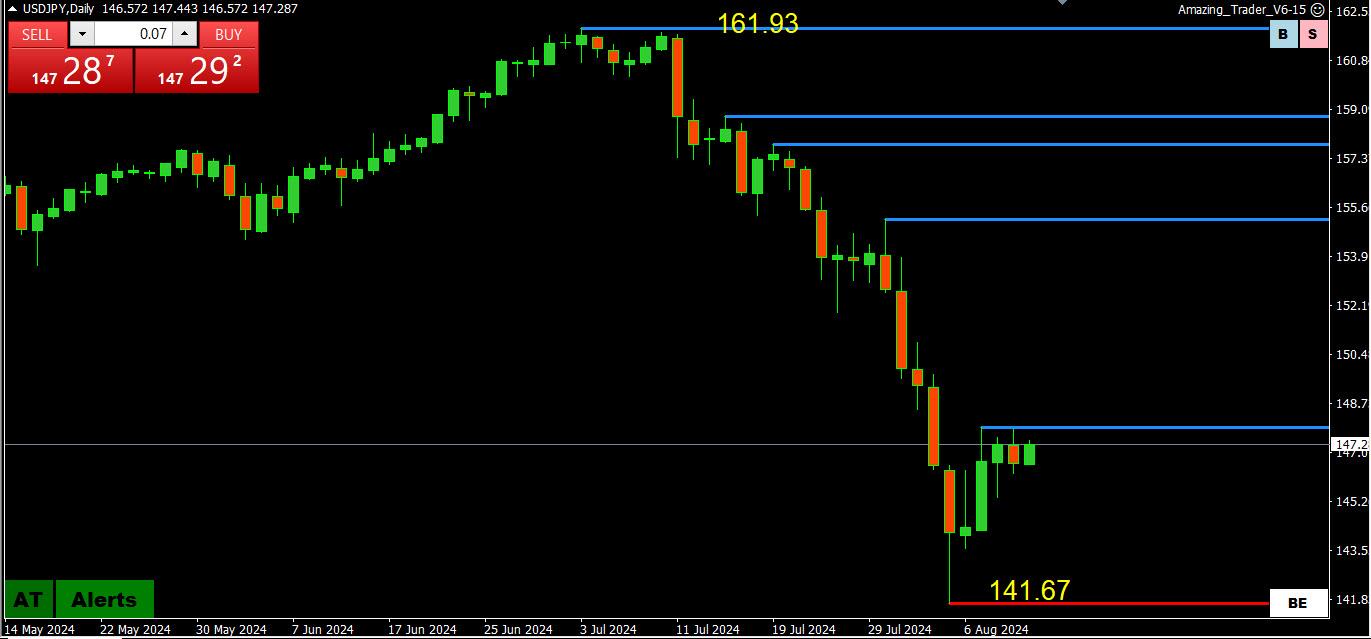
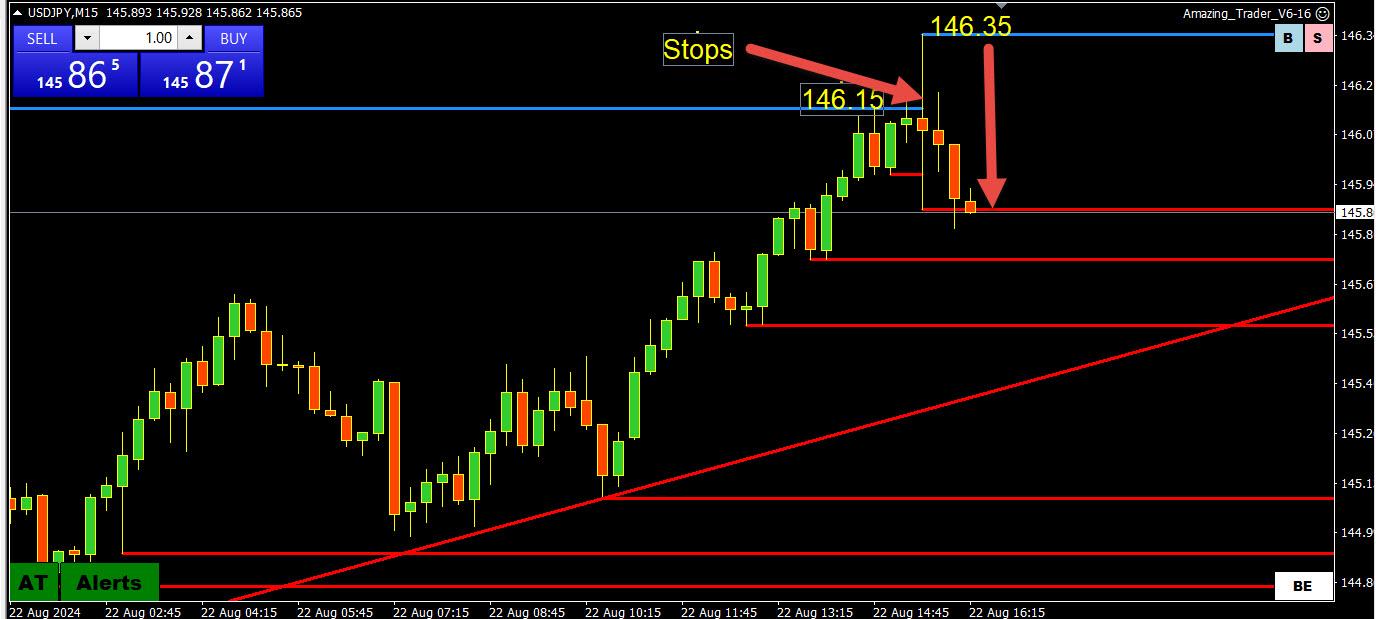
And for USDJPY, Buying till that Blue angled downtrend line. If it holds, again waiting for my patter and Sell.
Pretty simple really….I have an itch to incorporate that algo of yours in my trading, but hate changes of any kind 😀 Enough that I have to live with market changing all the time…
We’ll have to try to come up with a bit advanced version of it , incorporating my Patterns and MA’s J
As for the time frame that works the best with Continuation and/or Reversal patterns, although it works on all time frames , but bigger time frame – better / more sure results.
4H and Daily seem the best to trade on .
There are other chart patterns and formations that are way more suited for smaller time frames and we’ll talk about it way later…
As for Gold – yes it should be considered a Bullish Rectangle – but mind you that I said pretty clear a day ahead that it’s gonna break it and go to the new high – and that was NOT based on a crystal ball 😀 but on the above mentioned short term patterns that I have developed/collected over decades.
I need a full understanding of the market and charting from all the members to be able to explain/teach about it…So later J
David, I will post several lessons in coming days about Formations and Patterns – this is just the basic stuff – once we pass the basic level, I’ll go with more specific things…
Have you ever seen this disclaimer on a trading site;
Past performance is no guarantee of future results.
It is no difference with the so called order blocks.
Just because there was buying (or selling) at some level in a former trend, there is no guarantee that there will be buying (selling) this time as market conditions have likely changed.
First of all, read what Jay wrote on the issue of so called “order blocks” – just scroll it a bit down.
I have no idea who came up with that story on order blocks, but it is a pure BS.
As for the liquidity that you are mentioning – there is a liquidity 24/7 – just sometimes it gets pretty high…Trying to figure out the reasons behind the move are not productive – it is never the same reason….and it is the past tense…
All the info on the Rate of any instrument is on the Chart – you just have to learn to “read” it correctly.
Look at the bigger time frames charts , like 1h , 4h and even daily…there you will find a reason for market not moving as you have anticipated.
You must stay away from the anticipations and go with the flow – meaning – detect the wave forming ( up or down) on the time frame of your choice and once you get a confirmation, go with it…
Stay on it ( the wave ) till your profit target is met.
To decide on the profit target, you start from your stop – if the stop is 5 pips, your target should be at least 10 pips.
That is the system.
But if you continue trying to predict the future, you gonna fail.
You should trade only what you see – not what you think.
I saw this market as a bullish trend but it is an inducement because the liquidity above have not yet taken, so price is going there to pack people’s or trader’s stop losses, the chance direction to the down side to look for another liquidity, both internal and external, am I right? I just need more explanation

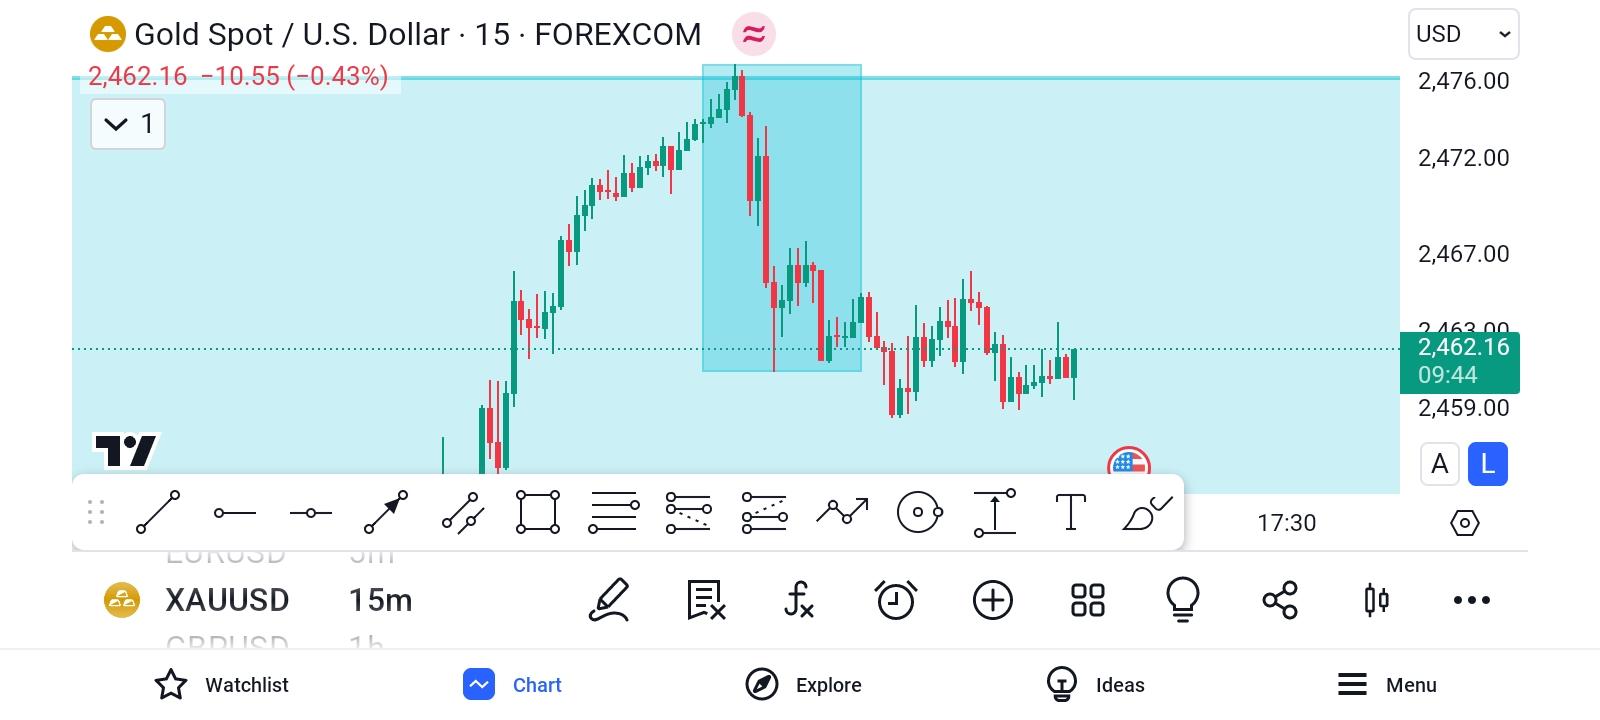 I saw this market as a bullish trend but it is an inducement because the liquidity above have not yet taken, so price is going there to pack people’s or trader’s stop losses, the chance direction to the down side to look for another liquidity, both internal and external, am I right? I just need more explanation