- This topic has 11,679 replies, 48 voices, and was last updated 4 months, 3 weeks ago by GVI Forex 2.
-
AuthorPosts
-
February 28, 2025 at 4:05 pm #20245February 28, 2025 at 3:56 pm #20244
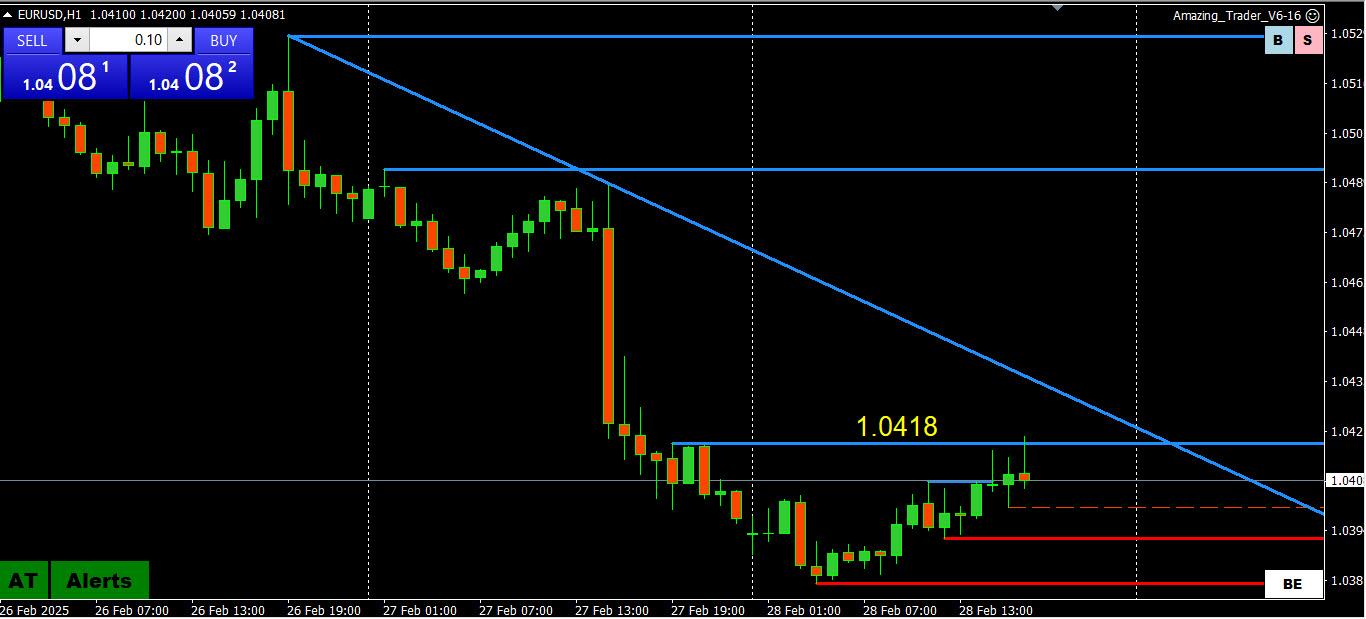
EURUSD 1 HOUR CHART – Upside capped

1.0418 AMAZING TRADER resistance so far capping the upside.
1.0400 former key support_is pivtoal
Beware of Trump headlines although focus today should be on Zelensxky’s meeting.
February 28, 2025 at 3:26 pm #20243February 28, 2025 at 3:14 pm #20242February 28, 2025 at 2:34 pm #20239February 28, 2025 at 1:52 pm #20238February 28, 2025 at 1:49 pm #20237February 28, 2025 at 1:33 pm #20236February 28, 2025 at 12:47 pm #20235It pays to take a moment to revisit this artice, especially given the sharp moves down in stockx this month
February 28, 2025 at 11:57 am #20234February 28, 2025 at 11:54 am #20233February 28, 2025 at 11:48 am #20232A look at the day ahead in U.S. and global markets from Mike Dolan
The S&P500 stock benchmark plunged into the red for the year this week as an Nvidia-led selloff, economic slowdown fears and re-ignited trade war fears jarred while the dollar surged anew.
Following Big Tech megacaps and small cap indexes into negative territory for 2025, the S&P500 plunged 1.5% on Thursday as U.S. jobless claims saw their biggest weekly jump in five months and President Donald Trump warned more tariff rises are coming as soon as next week.
Morning Bid: S&P500 in red for 2025 as trade war fears ratchet
February 28, 2025 at 11:36 am #20231
US OPEN
ES/NQ gain ahead of US PCE, sentiment hit amid trade angst but off worst levels
Good morning USA traders, hope your day is off to a great start! Here are the top 4 things you need to know for today’s market.
4 Things You Need to Know
European bourses are in the red, but with sentiment off lows; ES/NQ gain ahead of US PCE.
USD remains underpinned by trade angst; Antipodeans lag given the risk-tone.
Bonds bid after Trump’s latest on tariffs & tech pressure, though benchmarks are off highs.
Commodities lower on month end and ahead of weekend uncertainty.
February 28, 2025 at 11:21 am #20230looking ahead … (at month-end)
US 10-YR 4.252% -0.035
8:30 – personal consumption expenditures price index — the Federal Reserve’s preferred inflation metric“Economists polled by Dow Jones expect the measure of price changes for consumers to rise 0.3% from December for an annualized gain of 2.5%. Excluding volatile food and energy prices, so-called core PCE is expect to increase by 0.3% month over month and 2.6% year over year.”
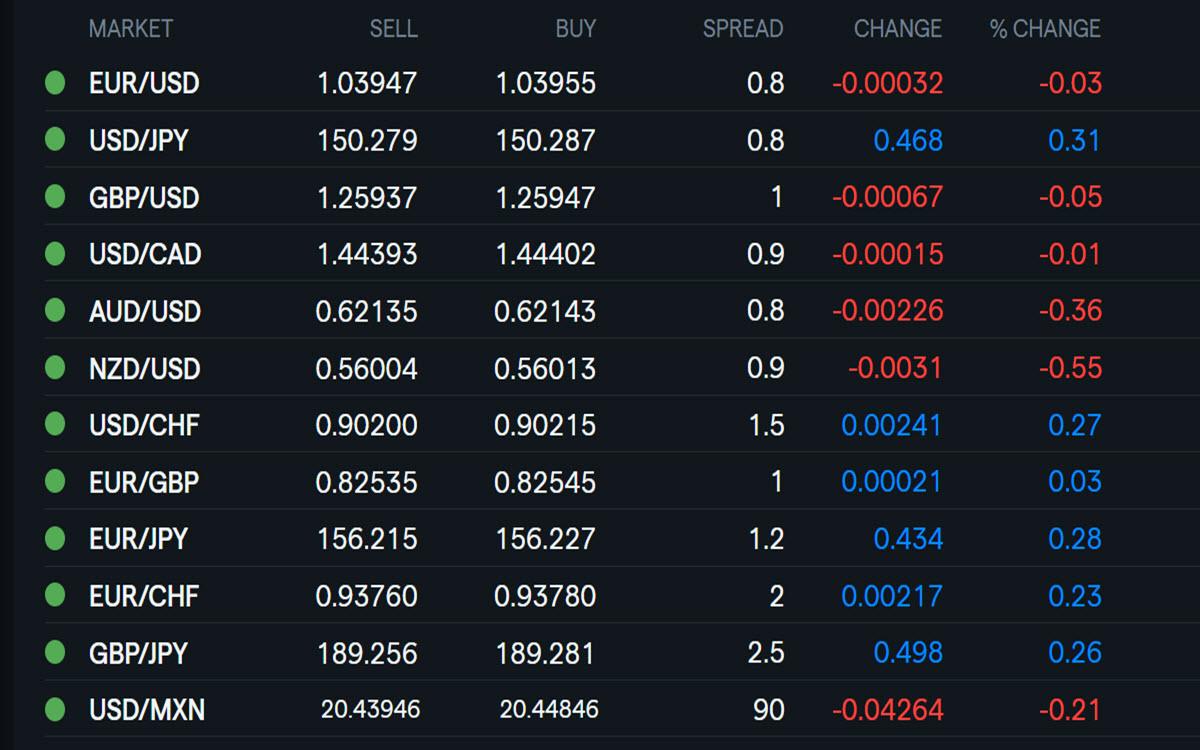
eurdlr 1.0390-ish, dlrchf .9029 gbpdlr 1.2590
tuesday march 4th = d day for President Trump’s 25% tariffs on things Canadian
dlrcad 1.4437February 28, 2025 at 10:29 am #20229February 28, 2025 at 10:19 am #20228XAUUSD 4 HOUR CHART – Outside week

At a minimum, the 8 week pattern of higher lows/higher highs was broken by an outside week. This leaves the focus on last week’s low at 2877 to see iit finishes the day below it for an outside week key reversal.
So far, 2852 support has held, which is close enough to the pivotal 2850 to make this level the one to watch on the downside (I always pay attention when the “50” level is involved). Below that is 2834 and then a void to aub-2800.
On the upaise. A close above 2777 and a move above 2888 would be needed to ease the risk
February 28, 2025 at 10:05 am #20227Using my platform as a HEATMAP

Liquidating markets across asset classes taking no prisoners.
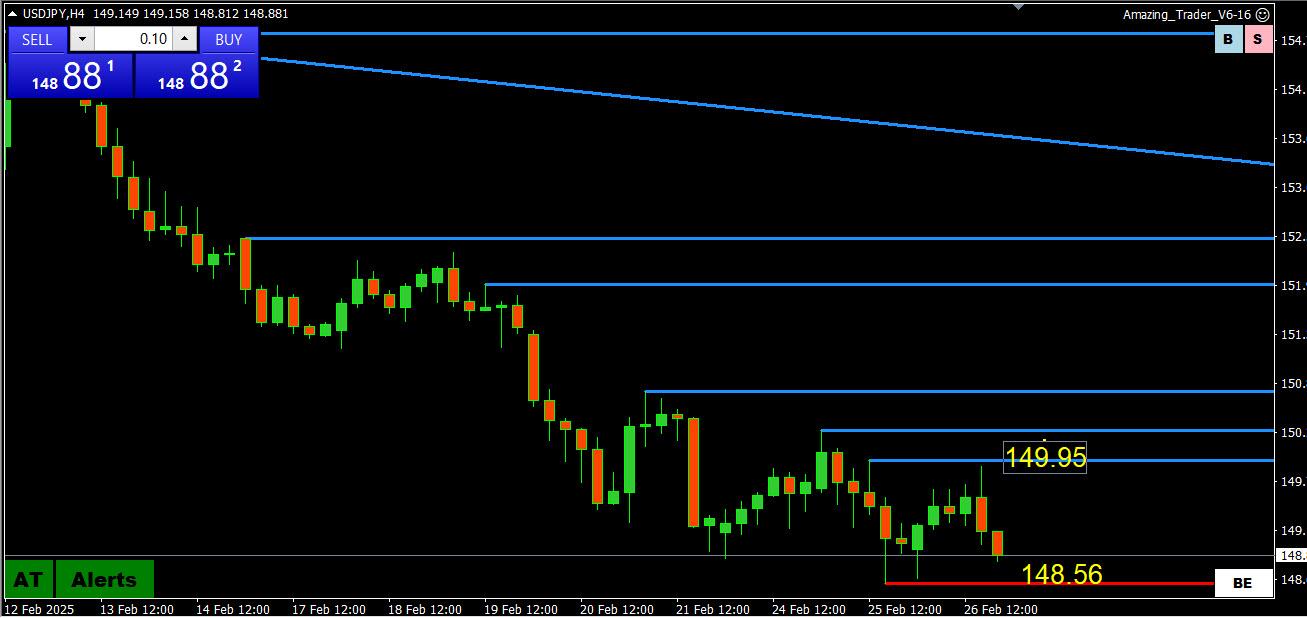
The dollar holding firm at month end with USDJPY back above 150 and AUD and NZD underperforming. .
Watch month end rebalancing flows to see whether a risk of dollar buying (hard to say how much has already taken place) given weaker stocks. I read bank report earlier in the week indicating it expects EURUSD selling given the underperformance of US stocks relative to European stocks
This is not an exact science so keep an eye on what looks like real money flows, especially ahead of the 4 PM month end London fixing
Elsewhere;
Golfdextending its retreat.
Cryptos down sharply
US bond yields falling further but off earlier lows.
US stocks finding some support but the day is young.
Looking ahead
US PCE (watch the core reading) is the key data release… See a detailed preview
Watch for Trump comments, especially after the carnage triggered by his tariff comments yesterday.
February 27, 2025 at 11:04 pm #20226February 27, 2025 at 10:27 pm #20225February 27, 2025 at 9:10 pm #20212https://global-test.financialmarkets.media/

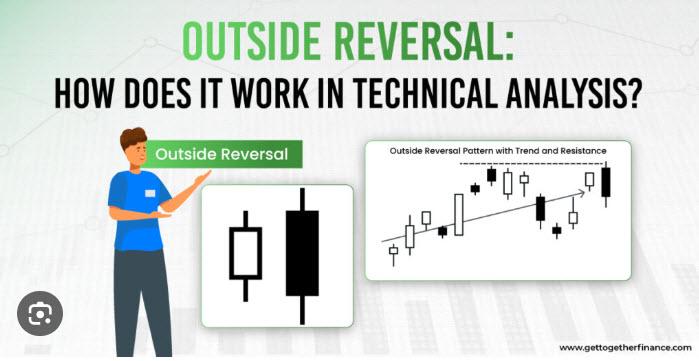
An Outside Month Key Reversal is a technical analysis pattern that signals a potential trend reversal in financial markets, often seen in stocks, commodities, or forex.
What is it?
It happens when the price action of the current month:
1. Trades both higher and lower than the previous month’s range (making an outside bar).
2.Closes above the previous month’s high (for a bullish reversal) or closes below the previous month’s low (for a bearish reversal).
Bullish Outside Month Key Reversal
• Current month low is lower than the previous month’s low.
• Current month high is higher than the previous month’s high.
• Close is above the previous month’s high.
• This signals a possible uptrend reversal.
Bearish Outside Month Key Reversal
• Current month high is higher than the previous month’s high.
• Current month low is lower than the previous month’s low.
• Close is below the previous month’s low.
• This signals a possible downtrend reversal.
Key Points:
• The larger the volume, the stronger the signal.
• It works better after a prolonged trend.
• Monthly charts provide stronger signals than daily or weekly charts.
(From the internet)
-
AuthorPosts
- You must be logged in to reply to this topic.
© 2024 Global View


