- This topic has 11,679 replies, 48 voices, and was last updated 4 months, 3 weeks ago by GVI Forex 2.
-
AuthorPosts
-
May 9, 2024 at 10:10 am #5992May 9, 2024 at 10:10 am #5991May 9, 2024 at 10:00 am #5990
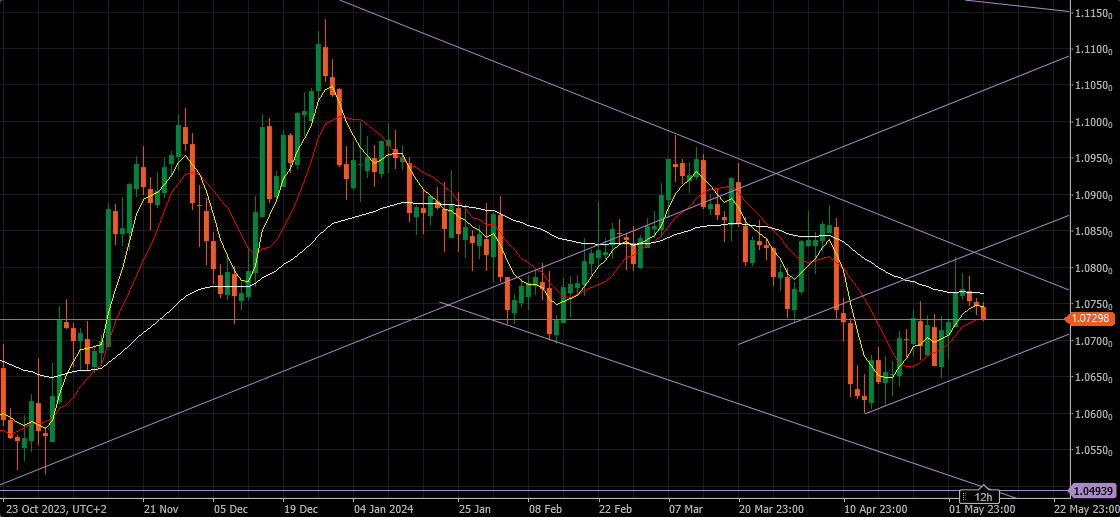
EURUSD Daily
Trendline’s Supports and Resistances
Supports :
1.06650 , 1.04950 & 1.04700
Resistances :
1.08150 , 1.08250 , 1.10500 & 1.11500
Currently in a Buy Mode – as long as we are above 1.06650 we have to treat it as Bullish.Moving Average’s Supports and Resistances:
Supports :
None
Resistances:
1.07300, 1.07450 & 1.07650
Currently in a Sell Mode – as long as bellow 1.07650 it is Bearish May 9, 2024 at 9:50 am #5988
Summary
BoE expected to keep Bank Rate at 5.25%
Investors watching for hints of a rate cut in June
ECB expected to move next month, Fed going more slowly
UK inflation heading for 2% target but wage growth strong
LONDON, May 9 (Reuters) – The Bank of England is likely to take another step towards its first interest rate cut in four years on Thursday as inflation falls, but will probably be cautious about signalling that a move is imminent.
Bank of England likely to move closer to first rate cut since 2020
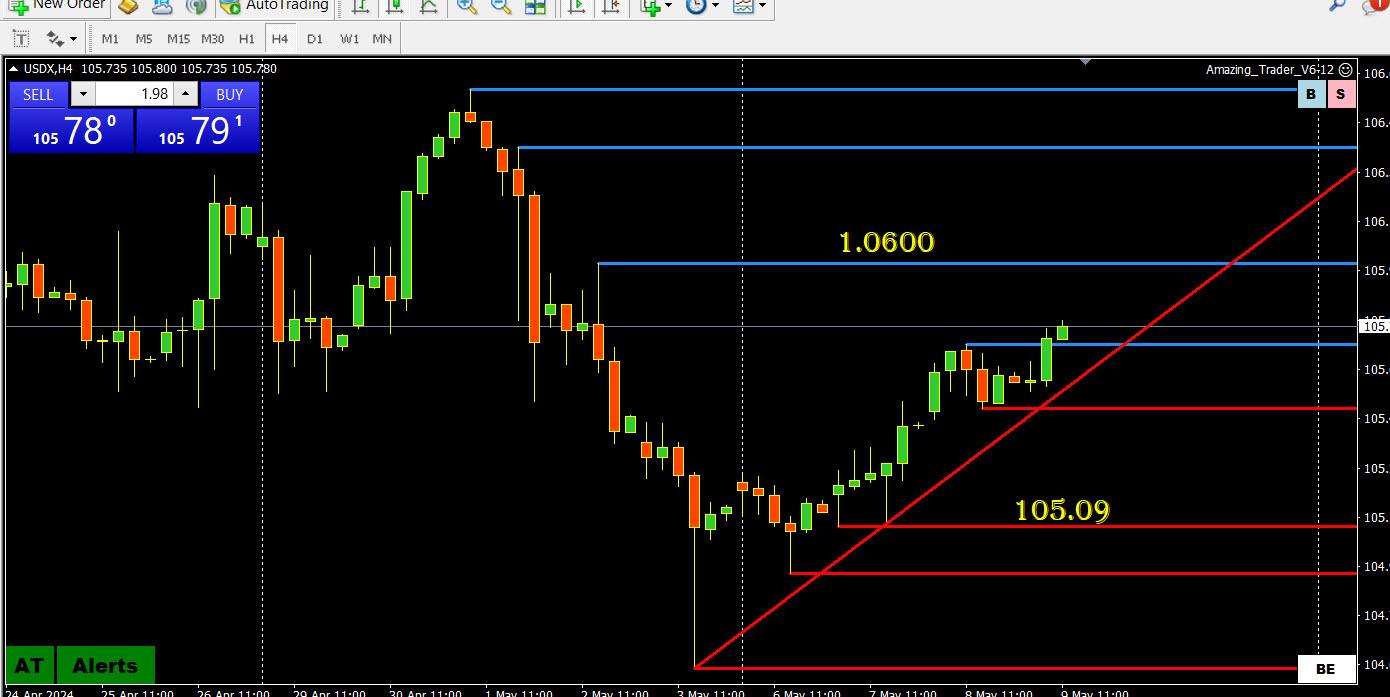
May 9, 2024 at 9:48 am #5985USDX 4 HOUR CHART – Why I look at USDX

Why am I looking at USDX if I don’t trade it?
I take a look at USDX as part of my daily routine. With EURUSD representing 57.6% of the index, it often acts as a proxy for this currency.
More than half the battle is to identify the side to trade and this index helps confirm (or not) what I see on a EURUSD chart.
Looking at this chart. USDX continues to recover from last week’s post-US jobs report fall.
It is trying to build momentum to the upside but still faces a key resistance at 106.00. It would likely need EURUSD to extend its retreat to challenge this level.
May 9, 2024 at 9:44 am #5983DLRCHF 9095-ish
–
technically this is potentially next directionally determining price level
when it broke down the r-shoulder of the H&S formation on may 3rd (ref hrly chart) and now back to it.Break-out N would signal that players have shifted their trading theme as suggested by neel k. Good idea to check odds (and pricing) of frequency and date expectations for FED’s inflation fighting action(s)
May 9, 2024 at 8:10 am #5981US 10-YR 4.516% +0.033 LAST | 4:03:32 AM EDT
on the uP …
–
just as I suspected glancing at DLRCHFmaybe kashkari’s earlier yikyak about higher for longer got some concideration but only some
I think the FED has painted itself into a corner by leading players into lower at some point soon — wishful thinking.
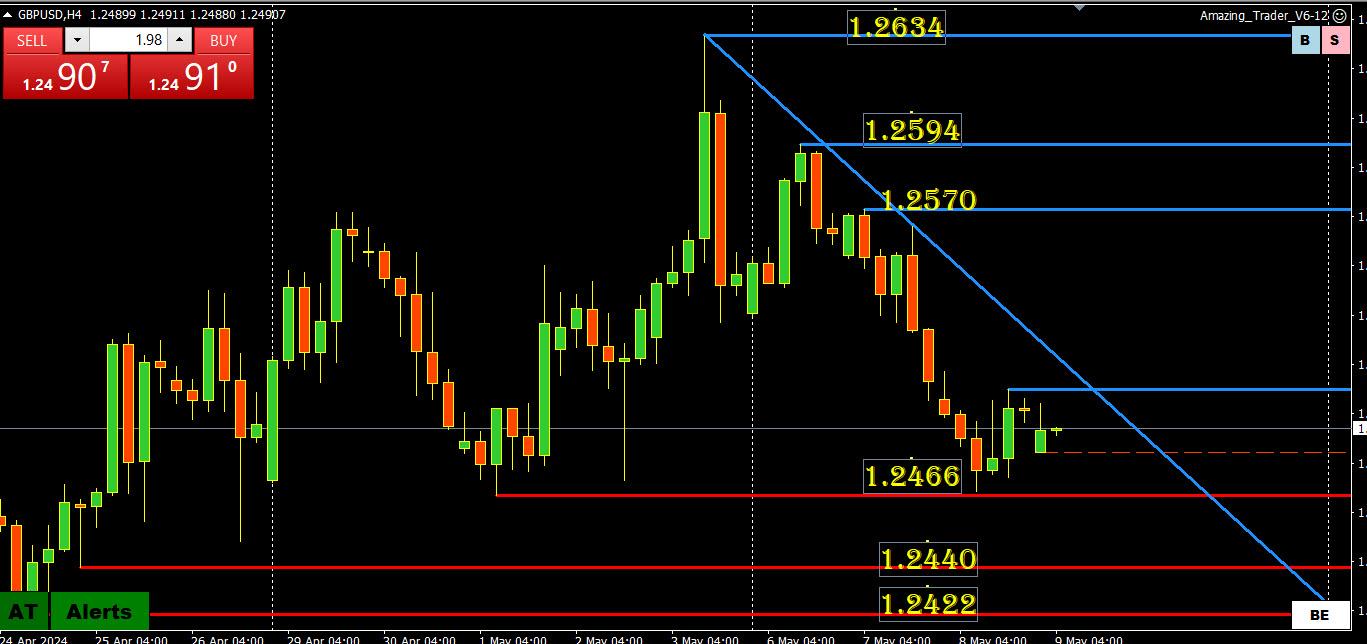
May 9, 2024 at 1:19 am #5980GBPUSD 4-HOUR CHART – WAITING FOR BOE

The market is expecting a dovish tilt so the surprise would be if the BOE is less dovish.
On this chart 1.2466 on the downside, the trendline and 1.2594 on the upside are levels to watch (major support is not until 1.2298.
But toss technical levels out the door and focus on 1.25 as that will dictate the tone post-BOE
May 8, 2024 at 10:27 pm #5979THE NEXT KEY EVENT IS THE BOE MEETING ON THURSDAY. BE PREPARED BY SEEING THE FULL PREVIEW AND ANALYSIS.
 May 8, 2024 at 10:20 pm #5978May 8, 2024 at 8:16 pm #5971May 8, 2024 at 8:09 pm #5970May 8, 2024 at 7:58 pm #5969May 8, 2024 at 6:47 pm #5965
Jay – 10yr is at 4.46+ with a flat curve (mis-typed, working fast), curve is at 3.51 a year ago,, it means the curve is a higher but bit flat right now. 2yr curve is declining at 4.84 from 3.99 a year ago. So near term yields (especially monthly) are declining, the 10 is flat, the 15-20-30 are all moving up. So the market is pricing in higher yields further out, with a stagnant mid-term, and a declining near term. If I got it right.
May 8, 2024 at 6:22 pm #5964May 8, 2024 at 6:20 pm #5963May 8, 2024 at 5:54 pm #5962Since its slow:
Just a note – The 6month yield is essentially flat at 5.06% and the 10yr is essentially flat at 3.51 on the yield curves. The only ones with a positive curve are the 15yr, the 20 yr, and the 30yr if I am reading the numbers correctly. I would love to hear from some of the viewers out there who never comment about what they think of that.
May 8, 2024 at 5:28 pm #5961May 8, 2024 at 5:25 pm #5960May 8, 2024 at 5:12 pm #5959 -
AuthorPosts
- You must be logged in to reply to this topic.
© 2024 Global View

