- This topic has 11,679 replies, 48 voices, and was last updated 4 months, 3 weeks ago by GVI Forex 2.
-
AuthorPosts
-
May 13, 2024 at 8:51 am #6136May 13, 2024 at 8:02 am #6135
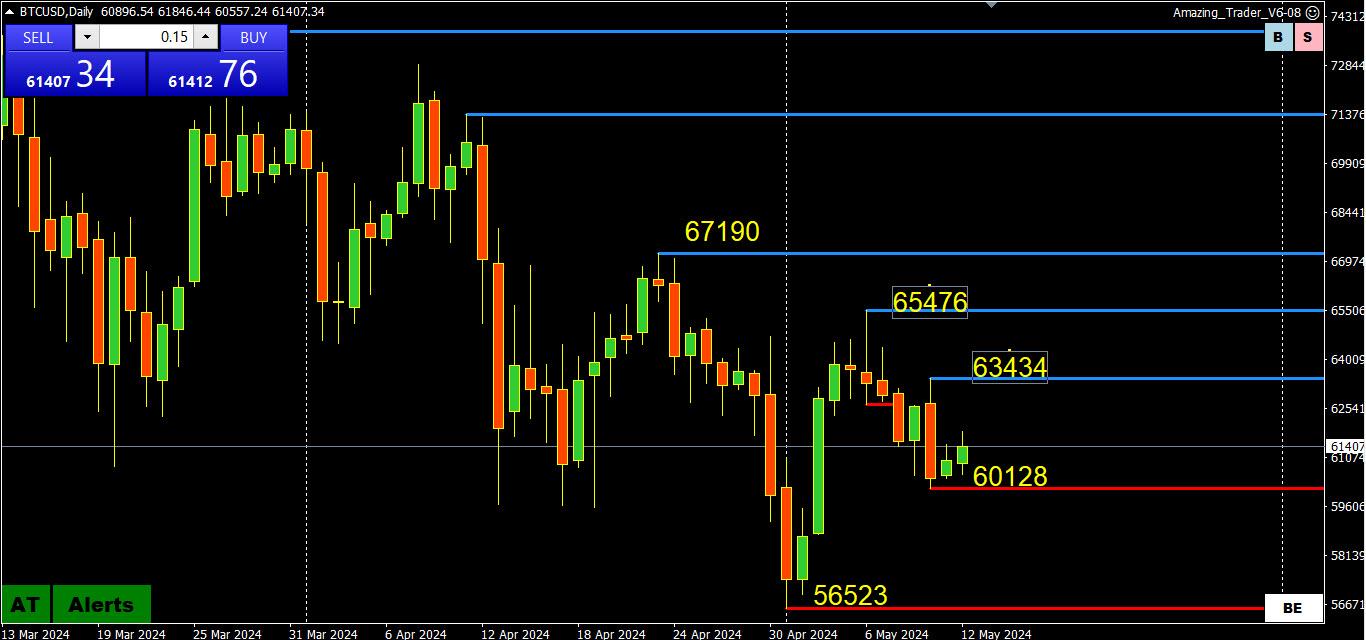
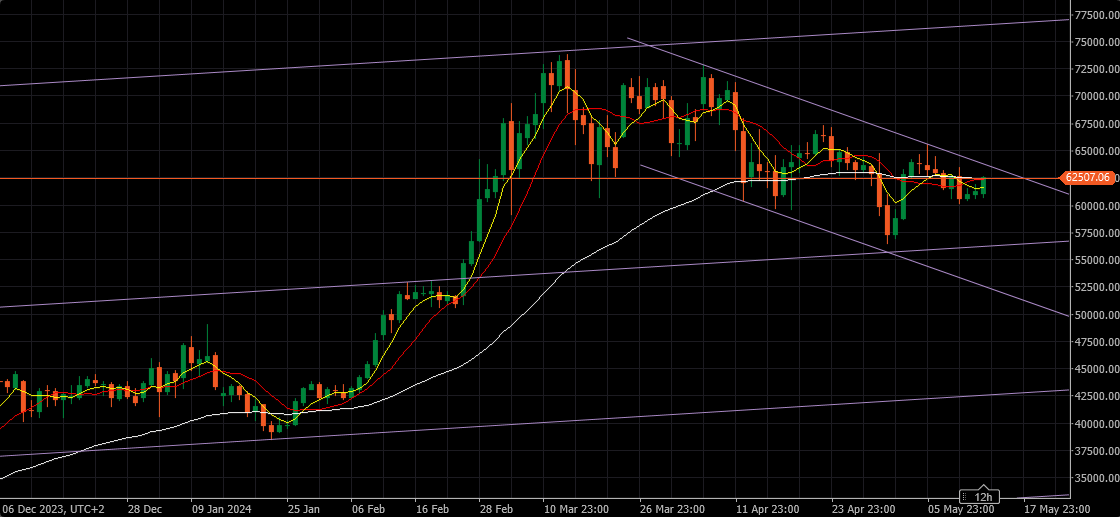
BTCUSD Daily
Resistance 63555.00
Support 60750.00
Almost 3.000$ …interesting…
As this is not exactly your average currency ( if it is a currency at all – in my opinion more of a commodity that crazed the world ), I am using some Thumb analysis on it..
Similar pattern emerged a year ago and it took 2 months of this kind of a correction before it continued Up in almost straight line…
I am not saying that it will repeat , as we lack a real historical data on this one, but just curious…
 May 13, 2024 at 7:52 am #6134May 13, 2024 at 7:44 am #6133May 13, 2024 at 7:31 am #6132May 12, 2024 at 11:21 pm #6131
T

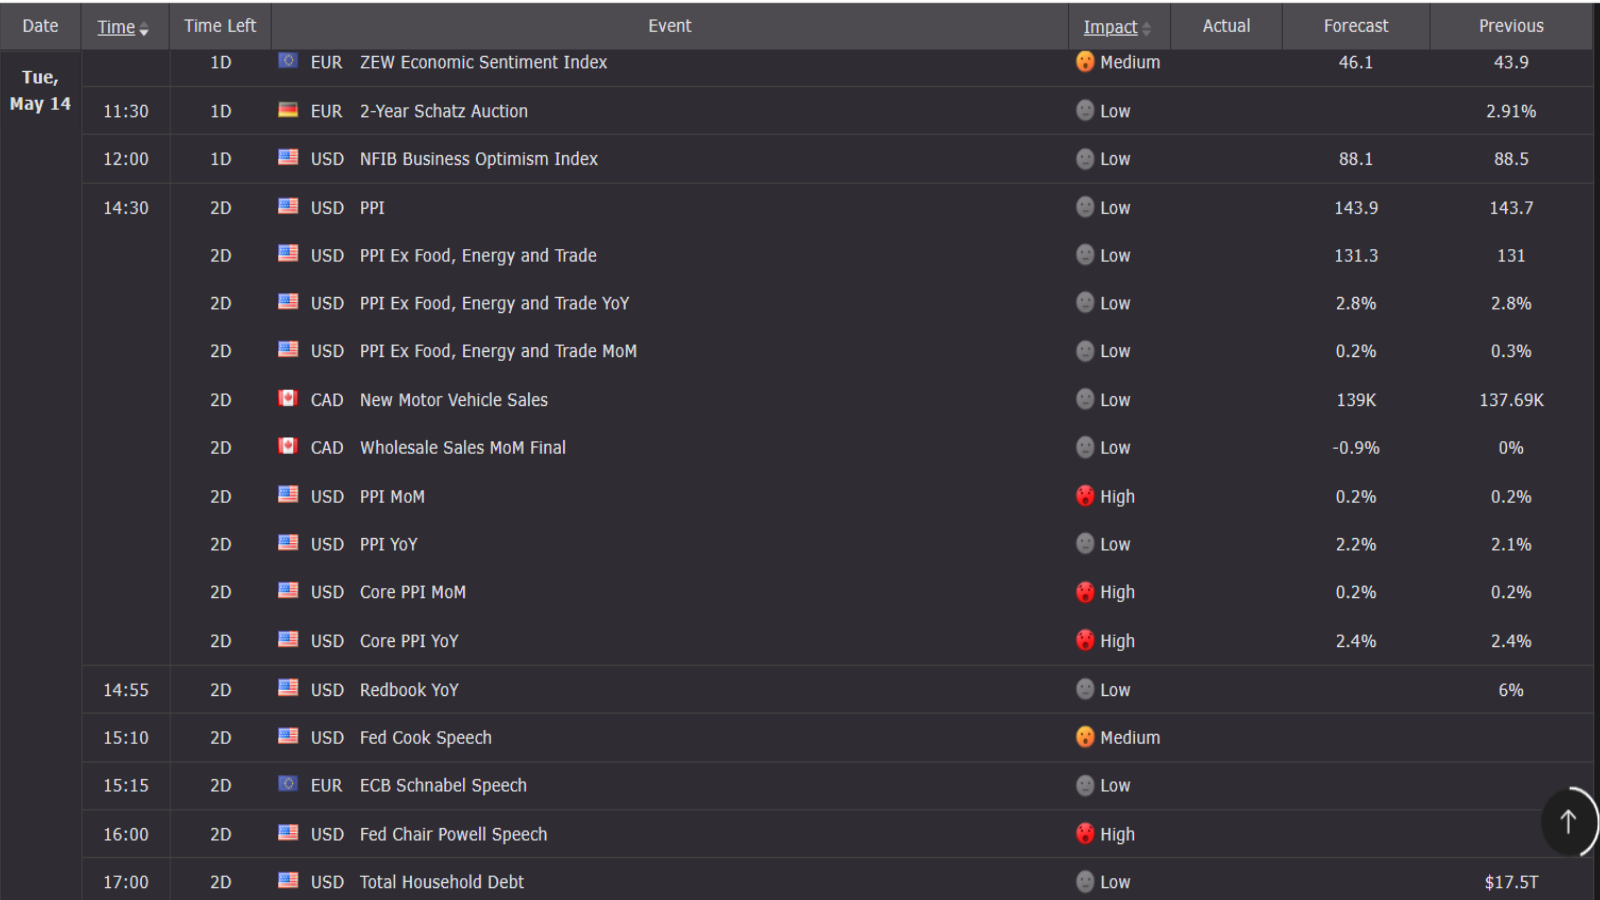
Indian consumer prices open the calendar on Monday and are expected to remain steady just under 5 percent and nearly a point above the Bank of India’s target. Wages in Tuesday’s UK labour market report, at a consensus 5.4 percent, are expected to cool slightly but more than justify the Bank of England’s decision to hold rates steady.
Marginal moderation is the call for US consumer prices on Wednesday, to a 3.4 percent rate overall and 3.6 percent for the ex-food ex-energy core. US retail sales on Wednesday and industrial production on Thursday are both expected to show limited gains.
Contraction is expected for Japan’s first estimate of first-quarter GDP on Thursday, pulled down by both consumer spending and business investment. Australia’s labour force report also on Thursday is expected to show a rebound in hiring.
The week closes with Chinese industrial production and retail sales on Friday; noticeable acceleration is expected for both.
Econoday
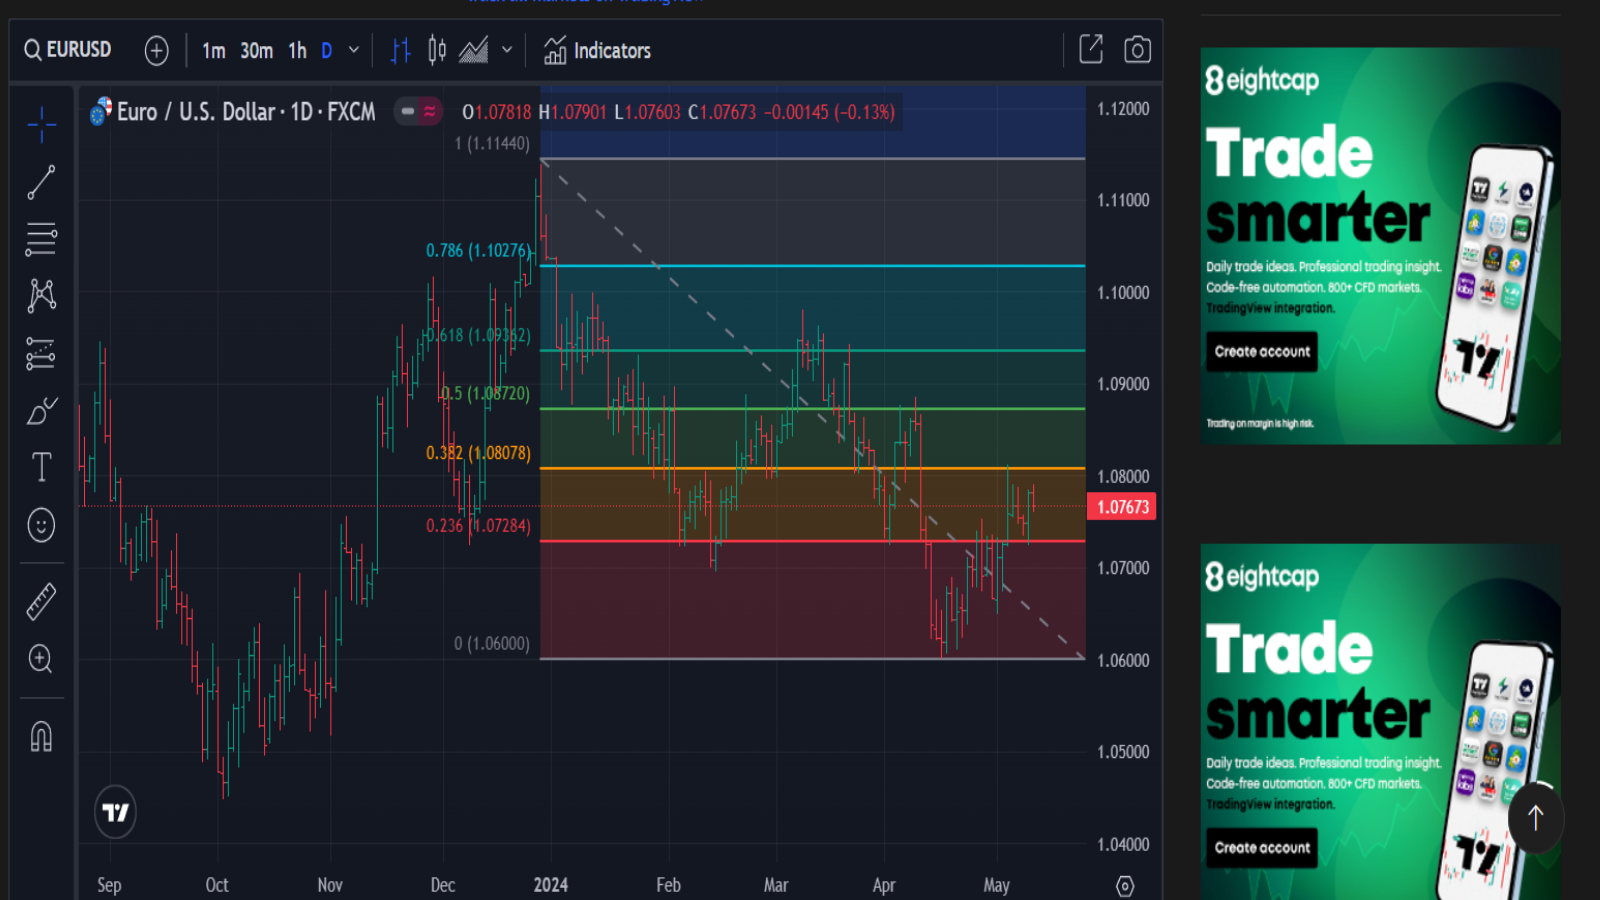
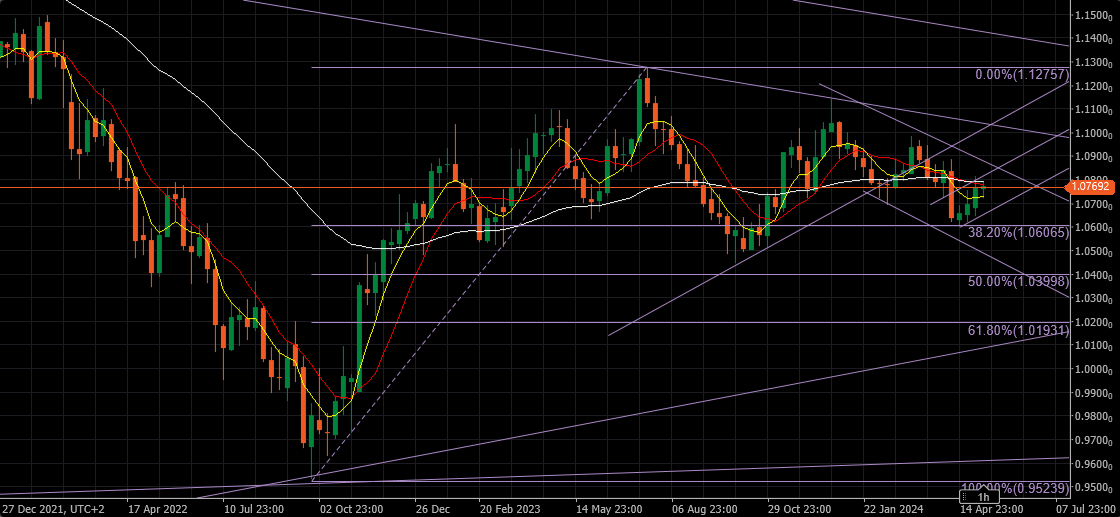
May 12, 2024 at 10:20 pm #6130May 12, 2024 at 7:14 pm #6125EURUSD Weekly
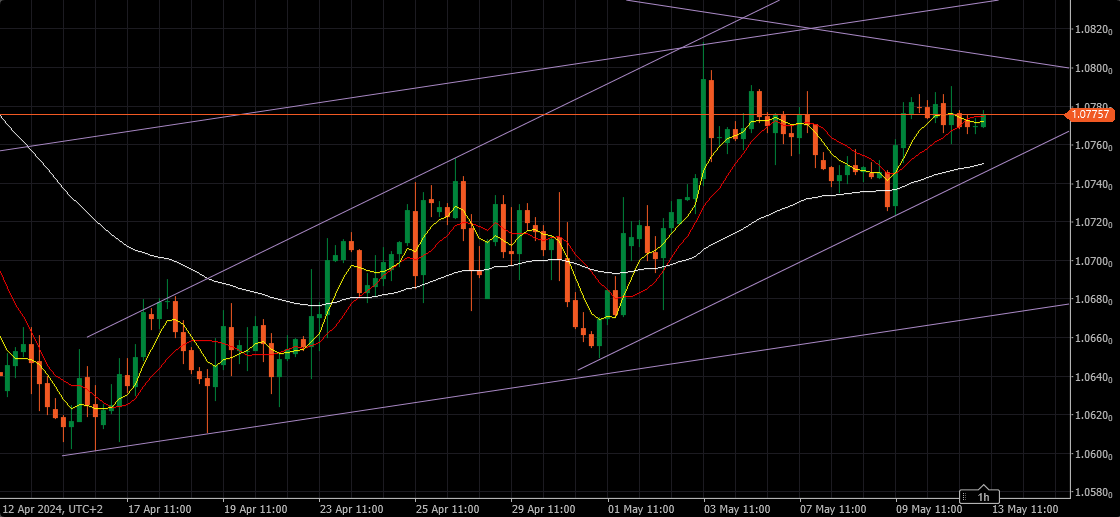
With Fibo Retracement levels and Trend lines
Just looking at the chart and trying to avoid being opinionated – as I usually preach…and it doesn’t matter what I wish to happen, or think that might happen, the pair on Weekly is showing me a Bullish Pattern – or at least that is how I see it.
For this 3 weeks move to continue Up it has to stay above 1.07300.
Any failure to do so, any weakness will turn this picture to fully Bearish.
But if 1.08150 first and then 1.08400 taken out, I will have to accept it and join the Bulls in buying it.
It is way easier for me to sell it anytime , and I have to fight myself when it comes to buying it…sometimes even the most obvious signals are not good enough for me.
We have some important data next week and of course we have to be ready for the unexpected.
 May 12, 2024 at 5:36 pm #6124May 12, 2024 at 1:49 pm #6116
AUDUSD DAILY CHART – WILL CONSULTATION BE BROKEN?
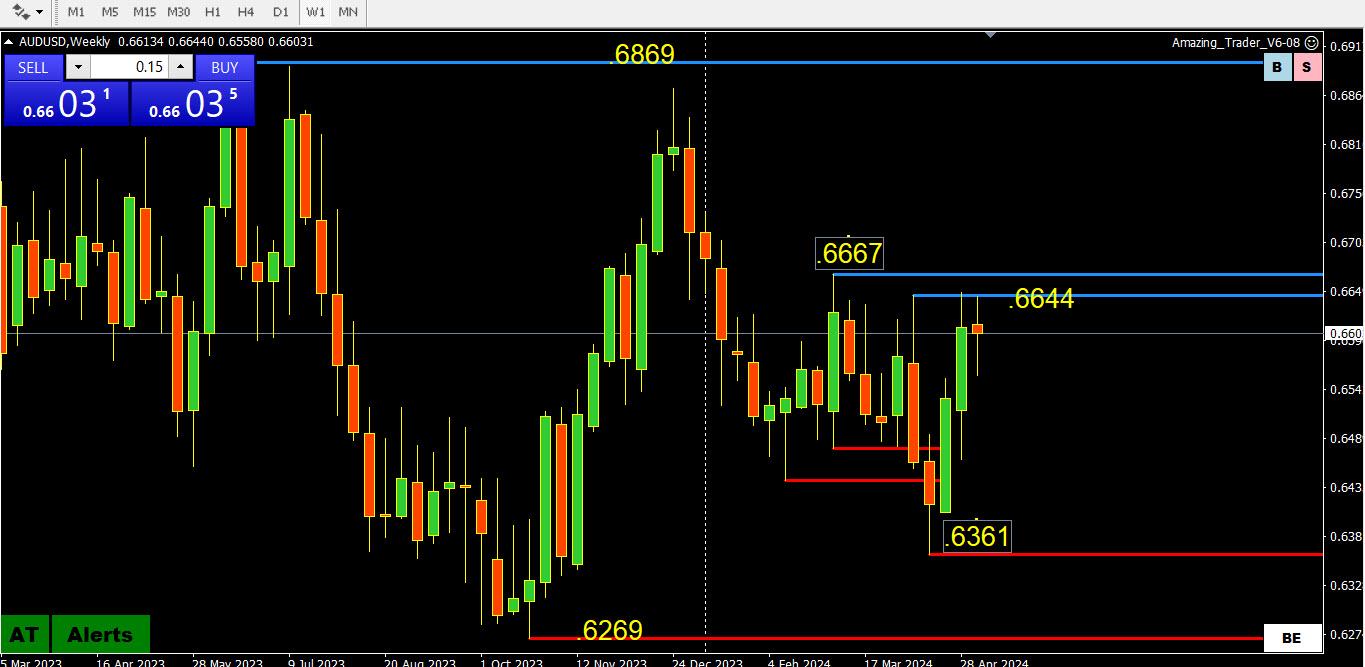
if you take a step back and a deep breath you will see that the AUSUSD has been consolidating within the broad .6269-.6869 range for the whole year-to-date
The range has been narrowed to .6361-.6667, so you can see why .6600 has become pivotal as a break of .6667 would out the .6869 level in play.
Looking at a 4-hour chart, there is a double top around .6644 and a key support at .6558
May 12, 2024 at 12:13 pm #6112May 12, 2024 at 12:08 pm #6111May 12, 2024 at 11:45 am #6110May 12, 2024 at 11:39 am #6109USDJPY 4 HOUR CHART – IF I WAS IN THE BOJ’S SHOES
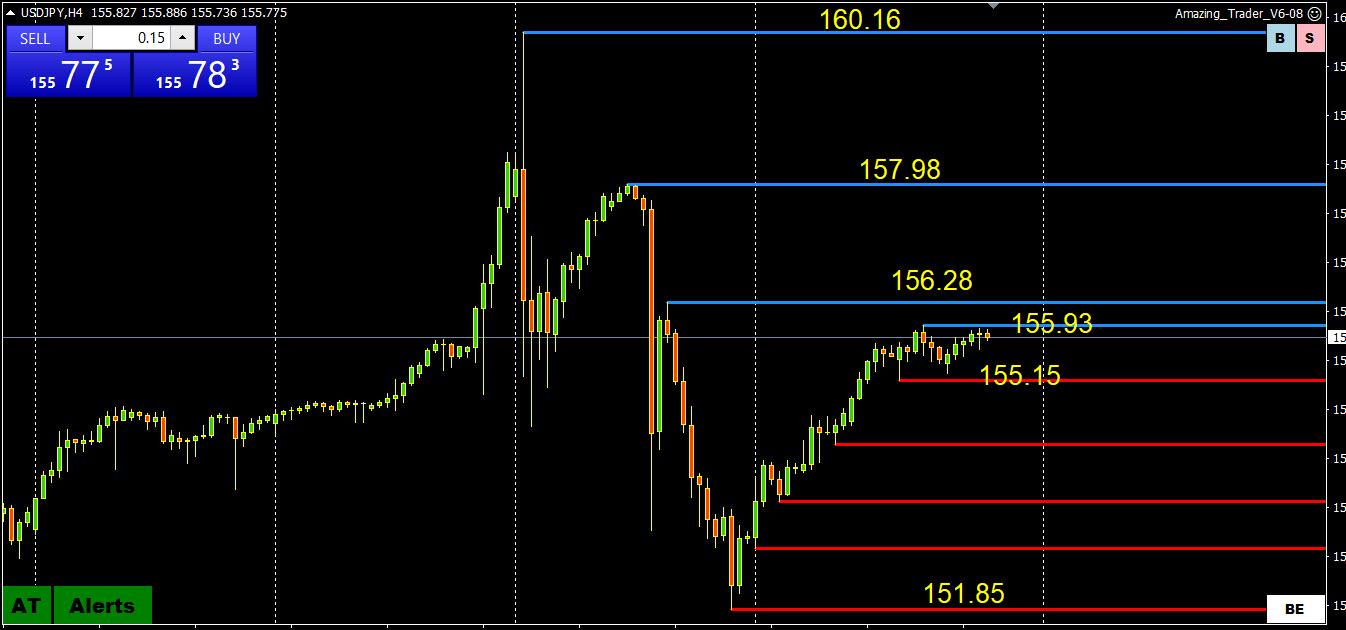
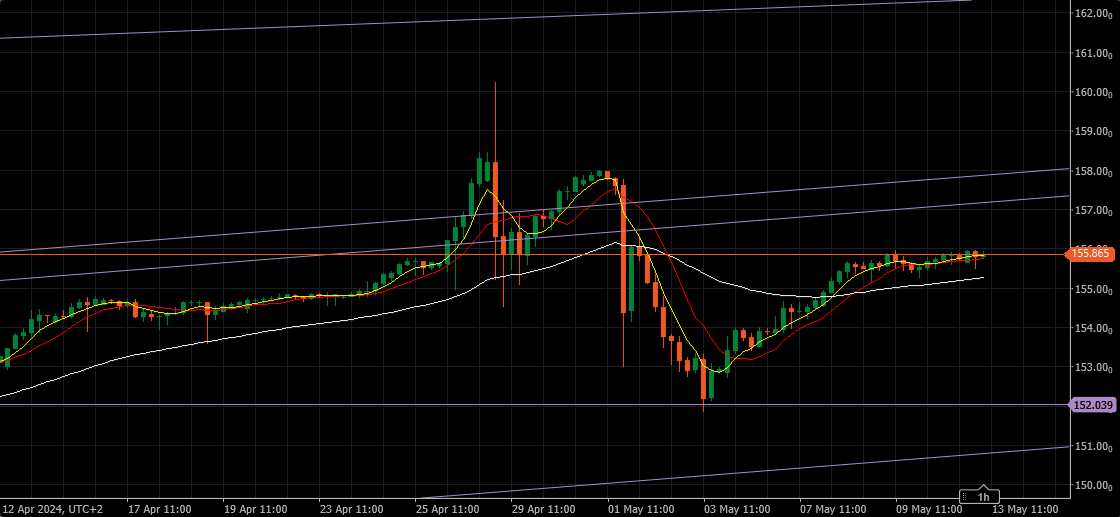
I ask this question whenever I post about USDJPY, “If I was in the BoJ’s shoes, what would I do?”
I would look at technical levels and which ones I do not want to see trade.
The answer depends on what time frame chart I was looking at
On a 4-hour chart, there are 156.28, 157.98, and of course 160.16
On a daily chart, it is only 157.98 and 160.16
On the downside, the initial goal is to get USDJPY back below 155.
Tactics: Do nothing at least until mid-week and see what US data shows,
Otherwise, with technicals currently pointing up, 158 seems like the level I would not want to see trade.
May 12, 2024 at 10:23 am #6108By now you should agree that the reaction to news is more important than the news itself when it comes to trading. So let’s take the next step and see…
How to Trade By Taking Advantage of News Rather Than Letting News Take Advantage of You

How to Trade By Taking Advantage of News Rather Than Letting News Take Advantage of You
May 11, 2024 at 6:24 pm #6103NVIDIA Weekly
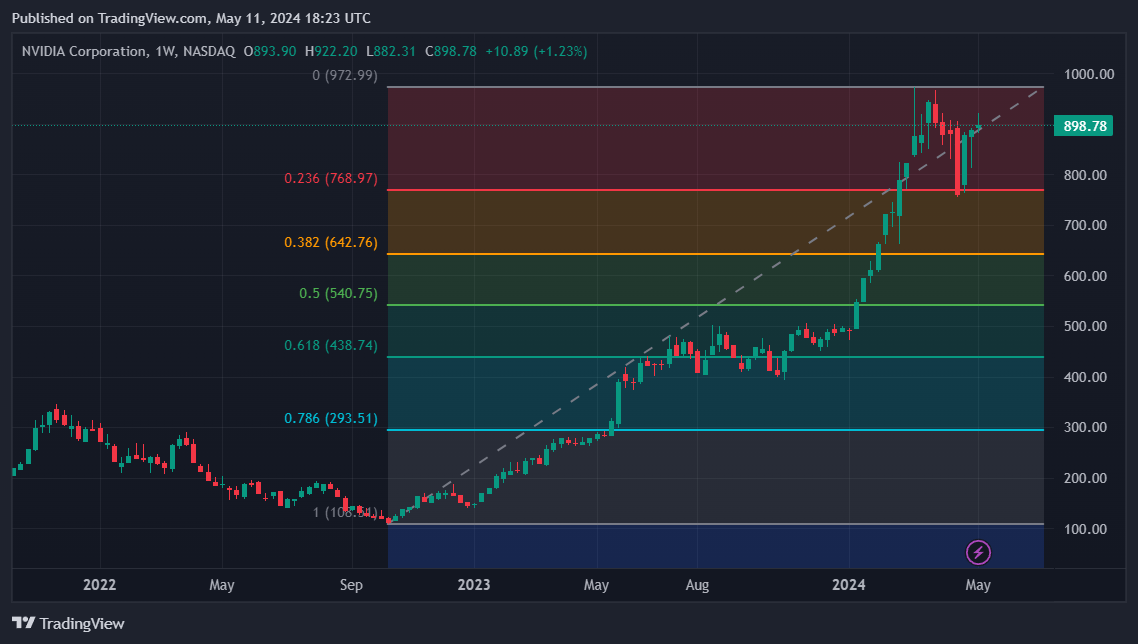
Stock price ended at $898.78 on Friday, after gaining 1.27%.The NVIDIA stock price gained 1.27% on the last trading day (Friday, 10th May 2024), rising from $887.47 to $898.78. During the last trading day the stock fluctuated 2.43% from a day low at $892.33 to a day high of $914.00. The price has been going up and down for this period, and there has been a 2.44% gain for the last 2 weeks. Volume fell on the last day by -4 million shares and in total, 33 million shares were bought and sold for approximately $29.86 billion. You should take into consideration that falling volume on higher prices causes divergence and may be an early warning about possible changes over the next couple of days.
 May 11, 2024 at 6:19 pm #6102
TSLA Weekly
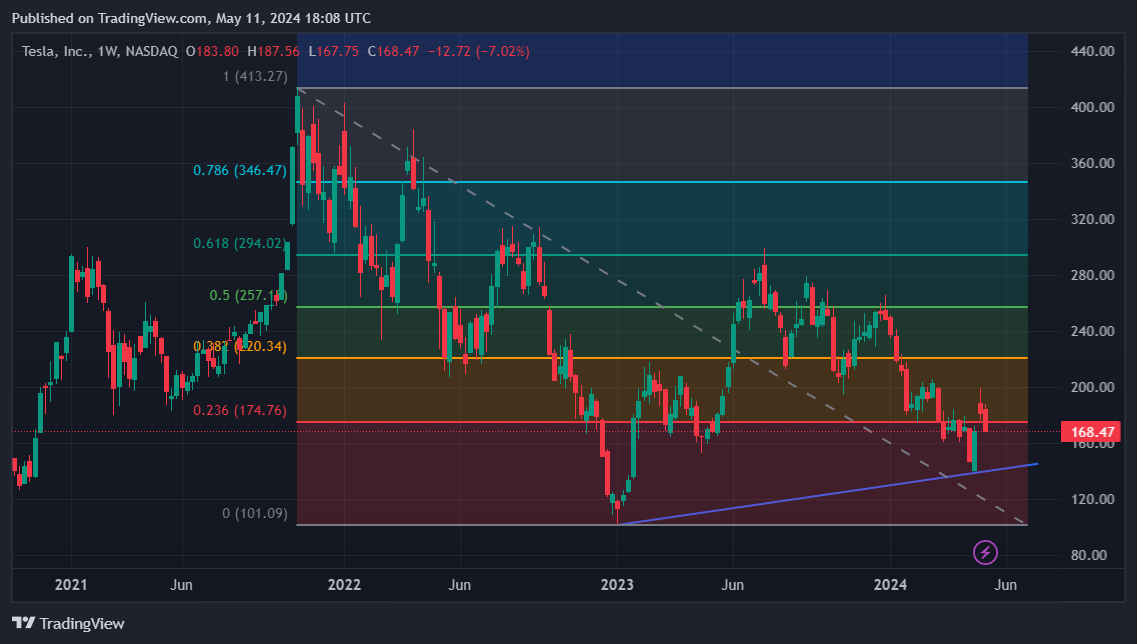
Tesla stock downgraded from Hold/Accumulate to Sell Candidate after Friday trading session.
The Tesla stock price fell by -2.04% on the last day (Friday, 10th May 2024) from $171.97 to $168.47. It has now fallen 4 days in a row. During the last trading day the stock fluctuated 3.17% from a day low at $167.75 to a day high of $173.06. The price has fallen in 6 of the last 10 days but is still up by 0.11% over the past 2 weeks. Volume has increased on the last day by 6 million shares but on falling prices. This may be an early warning and the risk will be increased slightly over the next couple of days.
 May 11, 2024 at 12:17 pm #6097
EURUSD WEEKLY CHART – PREPARING FOR THE WEEK AHEAD
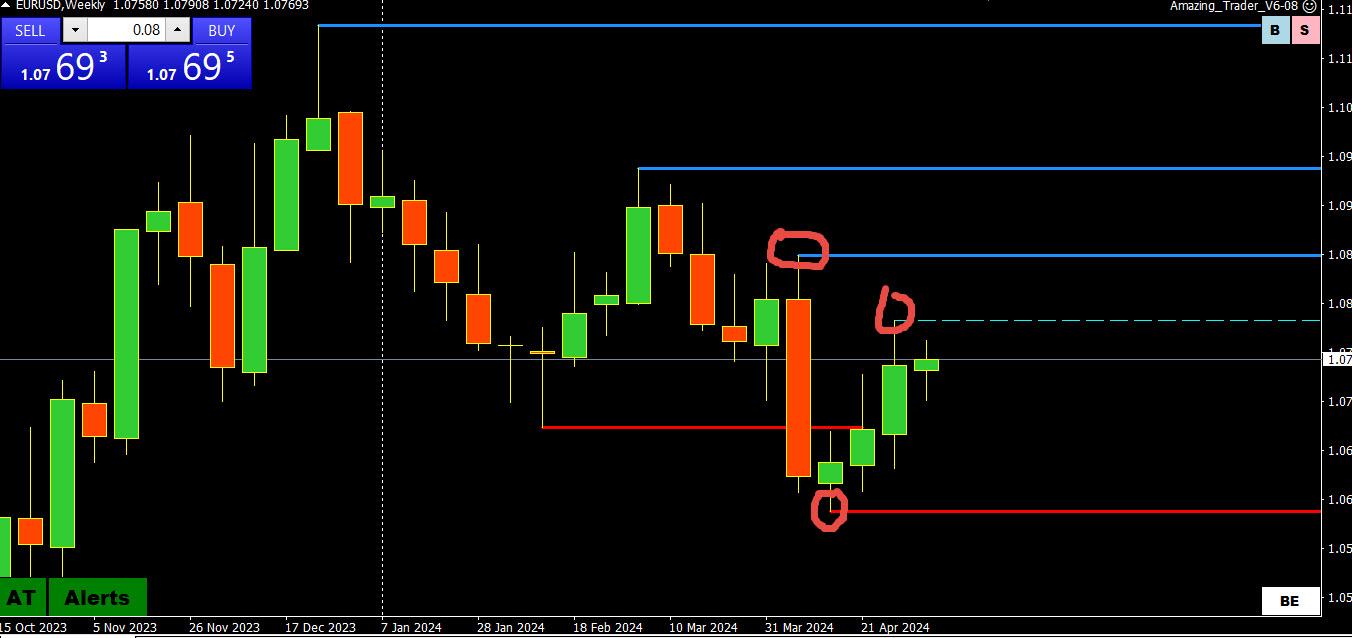
When you prepare for the week ahead you can start with a weekly chart to put the bigger picture in perspetive. I am using the EURISD weekly to illustrate I call it a checklist to prepare for the week ahead..
Write down the prior week’s range. (1.0724-91). These are the initial key levels to start the week.
Is there momentum in the weekly? (2 weeks of higher lows/highs so up momentum coming into this past week)
Was it a higher low or higher high or inside week? (inside week)
If an inside week, what was the previous weekly high? (1.0812)
What is the 4-week high or low (See The Four Week Trading Rule).
When you go through a checklist you will identify what the “real money” traders are looking at, identify the key levels and where there may be stops, determine whether there is momentum, and thereby prepare yourself for the week ahead no matter what time frame you are trading.
As I have said many times, udentifying the side toi trade is more than half the battle in being a successful trader.
May 11, 2024 at 11:41 am #6096May 11, 2024 at 10:43 am #6095 -
AuthorPosts
- You must be logged in to reply to this topic.
© 2024 Global View

