- This topic has 11,679 replies, 48 voices, and was last updated 4 months, 3 weeks ago by GVI Forex 2.
-
AuthorPosts
-
May 17, 2024 at 1:03 pm #6443May 17, 2024 at 12:46 pm #6442May 17, 2024 at 12:41 pm #6441May 17, 2024 at 11:17 am #6430May 17, 2024 at 10:52 am #6424
This is one of our most popular articles and on a day like this it is worth showing again, for those who have not read it and as a reminder for those who have read it as well.
Here is a test: Check your emotions and see how a currency feels like it is trdoing when it is above/below the “50” level
eurusd 1,0850 (currently below)
gbpusd 1.2650 (currently above)
audusd .6650 (flirting with it)
My Favorite Trading Secret: The Power of the “50” Level

My Favorite Trading Secret: The Power of the “50” Level
May 17, 2024 at 10:34 am #6422May 17, 2024 at 10:28 am #6420May 17, 2024 at 10:18 am #6419A look at the day ahead in U.S. and global markets from Mike Dolan
After a week of worldwide stock market records, Friday seems set for a breather – with attention switching to the deepening Chinese housing bust and sweeping government plans to stop the rot there.
May 17, 2024 at 10:14 am #6418May 17, 2024 at 9:18 am #6417GBPUSD 4 HOUR CHART – LOWER BUT LAGGING
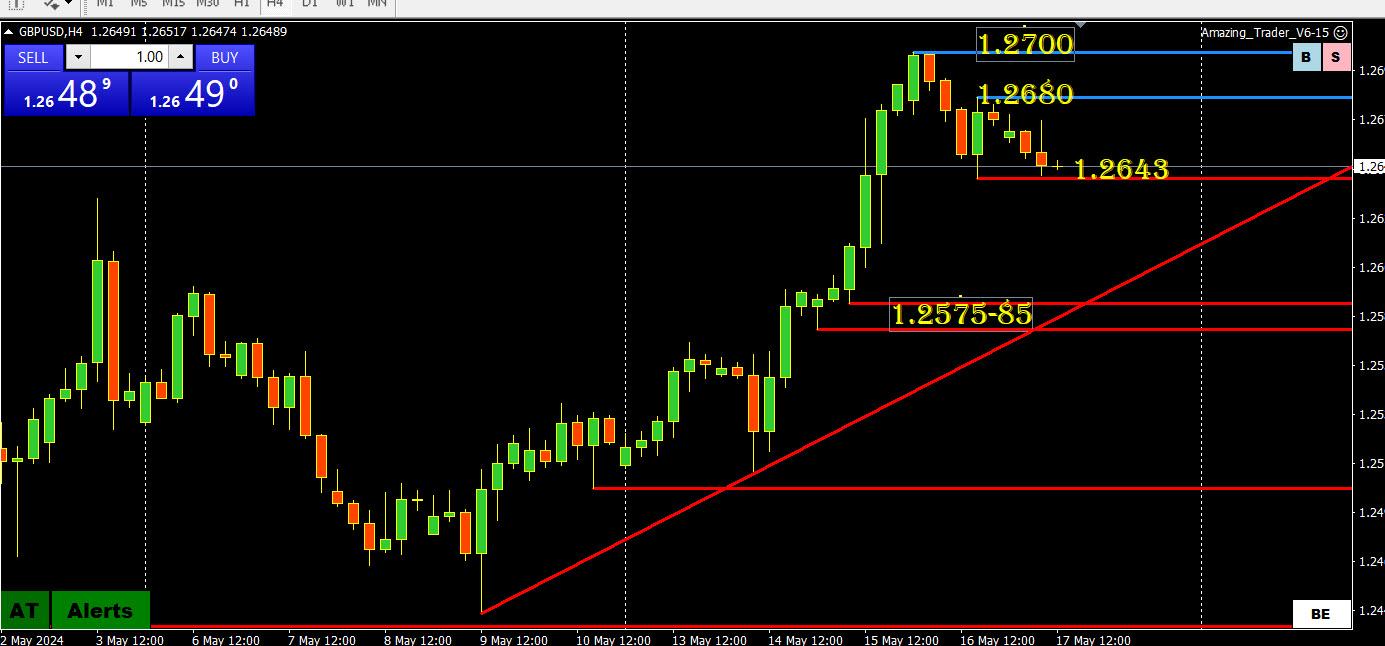
GBPUSD is lower but lagging EURUSD as EURGBP slips.
You can see the importance of 1.2643 as there is a void of supports until 1.2575-85 on this chart. This also means there are no obvious stops to go after until that level.
This suggests using shorter time frame charts to trade this currency.
May 17, 2024 at 8:49 am #6416EURUSD 30 MINUTE CHART – REALITY CHECK
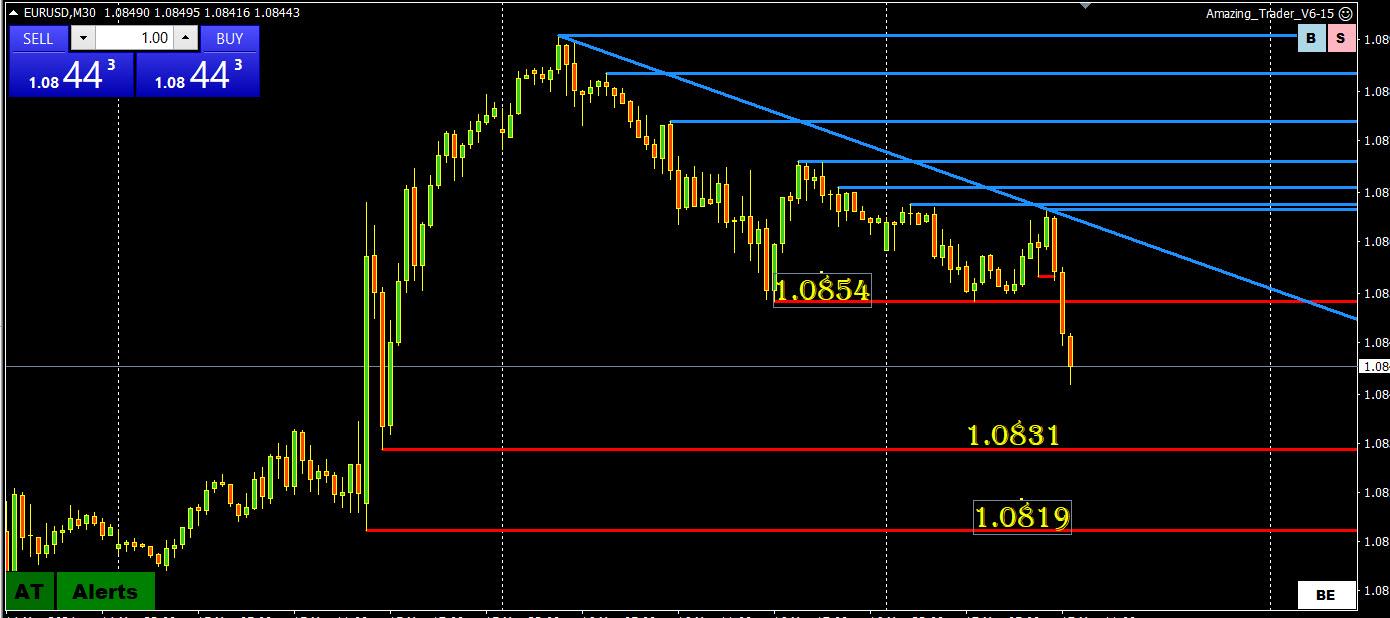
It appears markets are getting a reality check that the Fed is likely to stay tight for longer vs. the euphoria of rate cut expectations after the latest CPI report. That’s what news reports are saying anyhow. Equities though are so far little changed on the day.
This chart shows 1.0831 and 1.0819 as supports (also 1.0813 not seen on this chart)
On the upside, 1.0854 is a key level, as it has to stay below it to keep the retracement risk on the downside and a double top at 1.0869 above it.
May 17, 2024 at 12:28 am #6414May 17, 2024 at 12:15 am #6413May 16, 2024 at 9:34 pm #6412Seeking Alpha curtesy
–
Vladimir Putin has landed in Beijing for a two-day state visit, where he was greeted by Chinese leader Xi Jinping with a red-carpet welcome and a full military band. The trip will build on their commitment to the “no limits” relationship they signed at the Winter Olympics in 2022, just before the full-scale invasion of Ukraine. As Russia becomes isolated from the West on the world stage, it has sought to boost trade in the East and elsewhere, helping prop up its economy in the face of sanctions.Quote: “Relations between Russia and China are not opportunistic and not directed against anyone,” Putin declared. “Our cooperation in international matters is one of the stabilizing factors in the international arena.” Xi echoed the sentiment, adding that China will “work together to achieve the development and rejuvenation of our respective countries” and “to uphold equity and justice in the world.”
Trade between the two nations has soared to record levels, rising 26% last year to $240B and hitting targets ahead of schedule. Russia has even overtaken Saudi Arabia as China’s main oil supplier, while the latter sends back key commodities, vehicles and other consumer goods. Trade has also seen Russia’s economy top expectations to expand by 3.6% in 2023, according to the IMF, despite Western efforts aimed at draining the Kremlin’s war coffers.
Reaction? Wall Street Breakfast ran a survey last November, and again this week, on how the U.S. should manage its economic relationship with China. The biggest changes over the past six months showed that more subscribers have less faith in rapprochement and trade deals (24% to 15%), while a greater number believe decoupling and sanctions are the way to go (11% to 19%). It’s noteworthy as Washington has recently threatened additional sanctions on Chinese banks and entities that handle Russian trade involving dual-use goods that can be used for both civilian and military purposes. How does all of this factor into your investing decisions?
May 16, 2024 at 9:21 pm #6411AUDUSD 4 HOUR CHART – Consolidating?
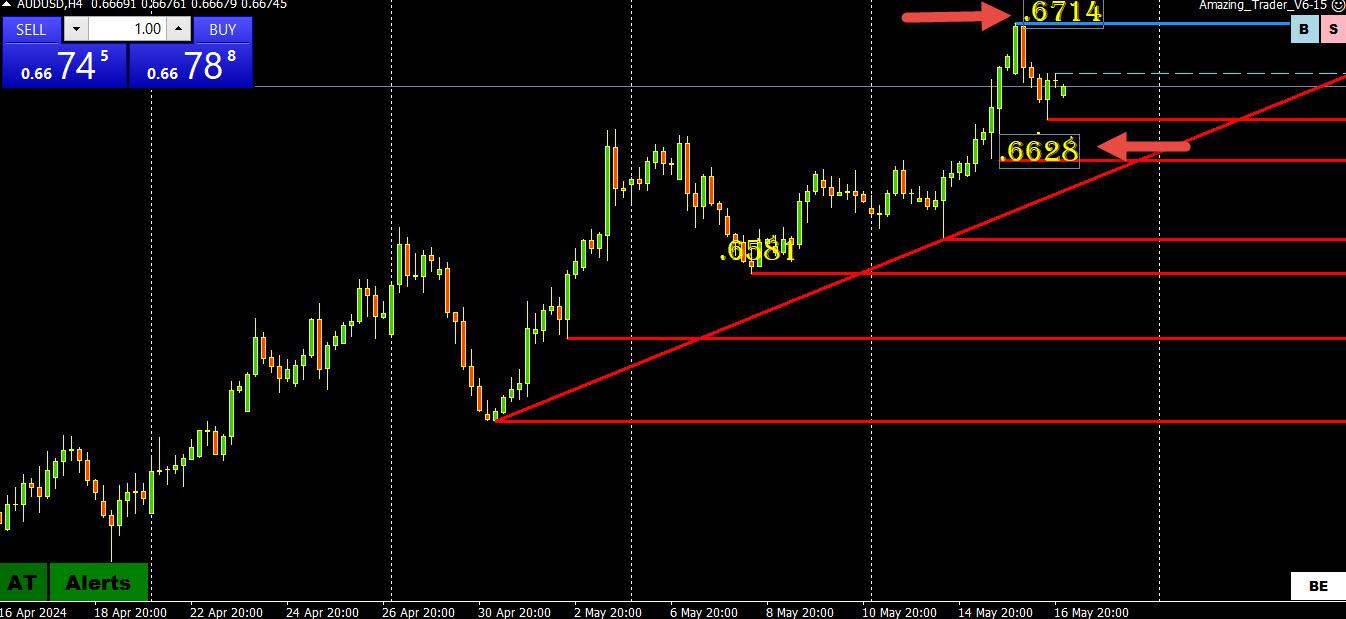
AUDUSD will likely follow the general USD lead on Friday
Key levels are highlighted on this chart, anything within them would just be a consolidation
Judging by the pause above .6650, this level will be pivotal in keeping a bid focused on .67+
Below .6650-55 would put .6628 in play.
Given the way risk on has helped drive the USD lower, keep an eye on US stocks as they could influence the fx market.
May 16, 2024 at 7:50 pm #6410NAS100 4 HOUR CHART – READY FOR A BREATHER?
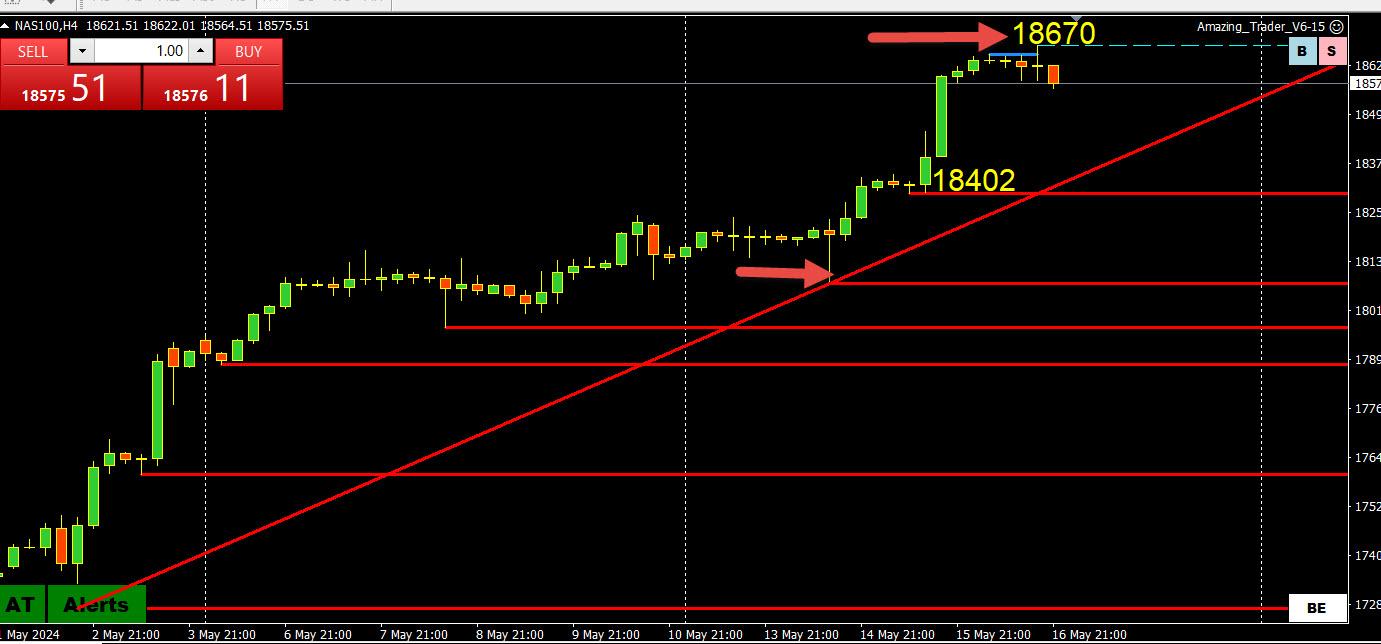
Those trying to pick a top in US stock indices have found it a painful experience and I am not going to do so now.
With that said, perhaps the DJIA’s failure to hold its long-awaited test of 40000 is saying it is time to take a breather.
What I have done on this chart is highlight the key levels.
On the upside, the only level that matters on top is the new record-high
On the downside, line up the highlighted red support line. on your vhartt
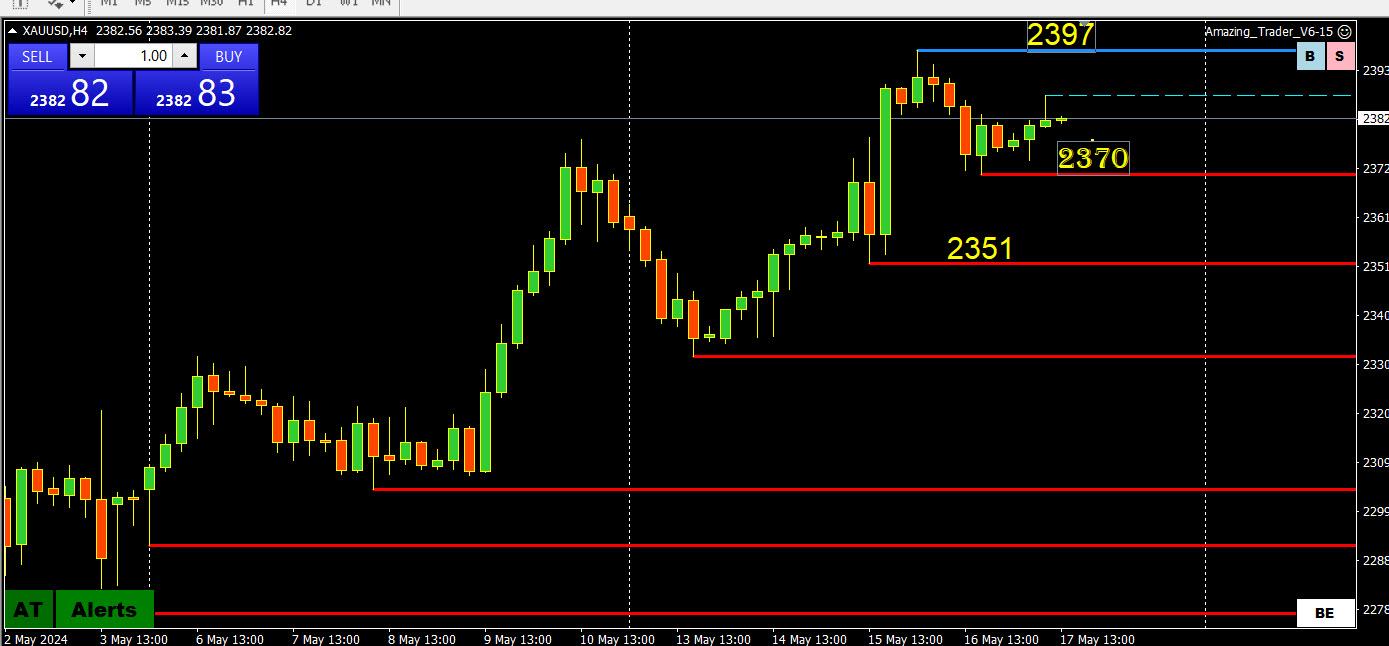
May 16, 2024 at 7:46 pm #6409May 16, 2024 at 7:18 pm #6408May 16, 2024 at 7:15 pm #6407XAUUSD 4 HOUR CHART – Taking a breather
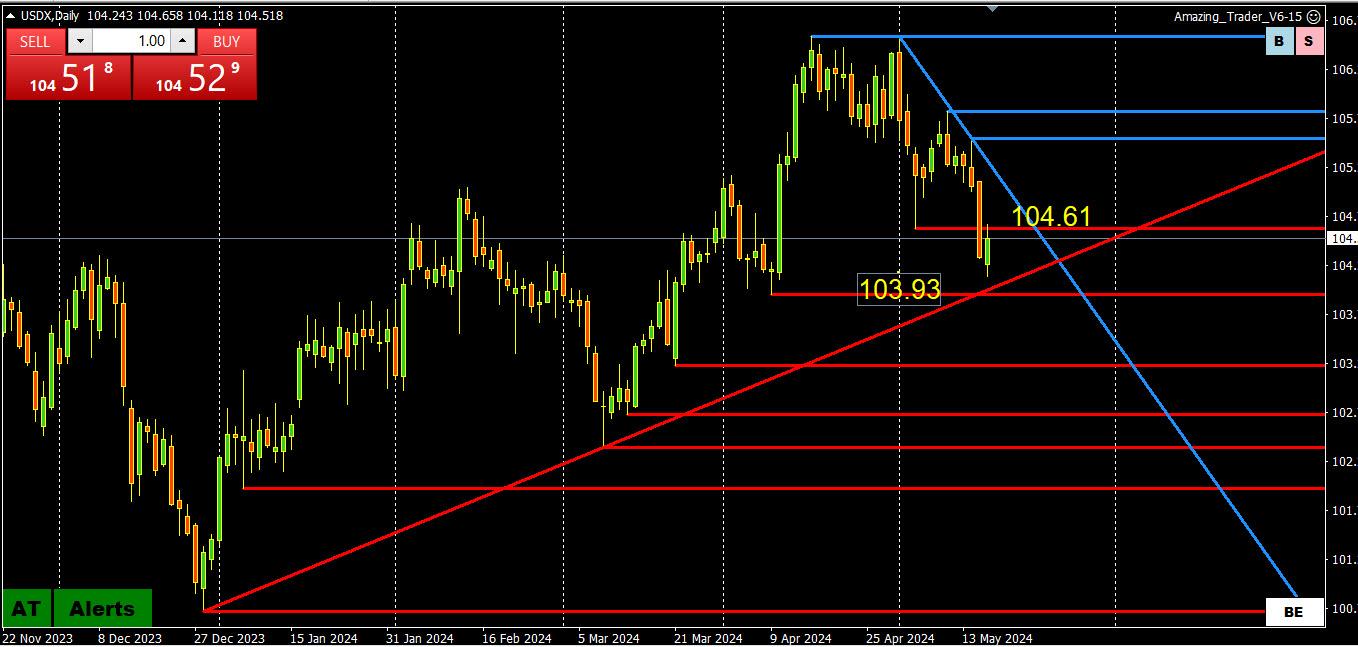
I must be doing something right as there is no change to what I posted earlier
XAUUSD CAME CLOSE TO 2400 BUT HAS BACKED AWAT. MAJOR LEVEL REMAINS ABOVE 2400.
RISk IS STILL POINTED UP AS LONG AS IT STAYS ABOVE 2351 (DOES THIS LEVEL, I.E. 2350, SOUND FAMILIAR> BUT ANYTHING XAUUSD CAME CLOSE TO 2400 BUT HAS BACKED AWAT. MAJOR LEVEL REMAINS ABOVE 2400.
RISk IS STILL POINTED UP AS LONG AS IT STAYS ABOVE 2351 (DOES THIS LEVEL, I.E. 2350, SOUND FAMILIAR> BUT ANYTHING OTHER THAN A BREAK OF 2430 KEEPS THE CURRENT RANGE OTHER THAN A BREAK OF 2430 KEEPS THE CURRENT RANGE
May 16, 2024 at 7:08 pm #6406 -
AuthorPosts
- You must be logged in to reply to this topic.
© 2024 Global View

