- This topic has 11,679 replies, 48 voices, and was last updated 4 months, 3 weeks ago by GVI Forex 2.
-
AuthorPosts
-
May 20, 2024 at 9:33 am #6496
XAUUSD DAILY CHARTT – WHEN WILL IT PAUISE?
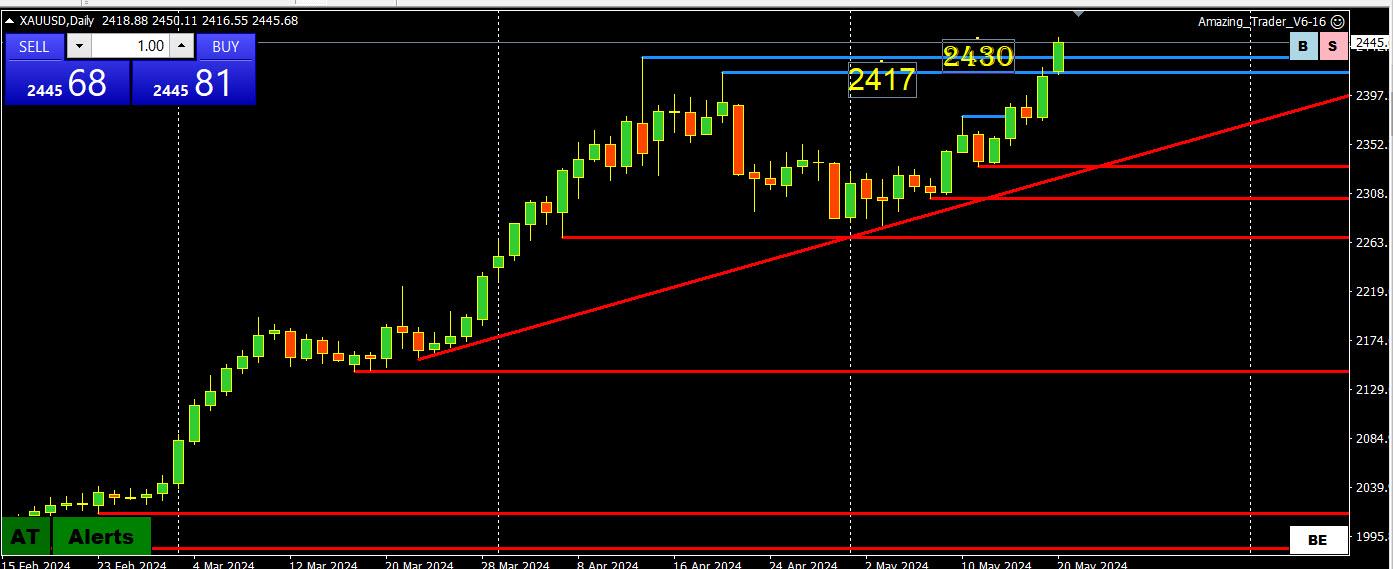
XAUUSD is on a tear and surging again into fresh new record highs.
Trying to predict a top in gold is pure guesswork as it is in unchartered waters.
With that said, one potential level is 2450, the “50” level. If it fails to cause a pause then 2500 will be on the radar.
On the downside, former highs at 2417-30 need to hold to keep the strong bid.
May 20, 2024 at 9:25 am #6495EURUSD 4 HOUR CHART – Watch the “50” level
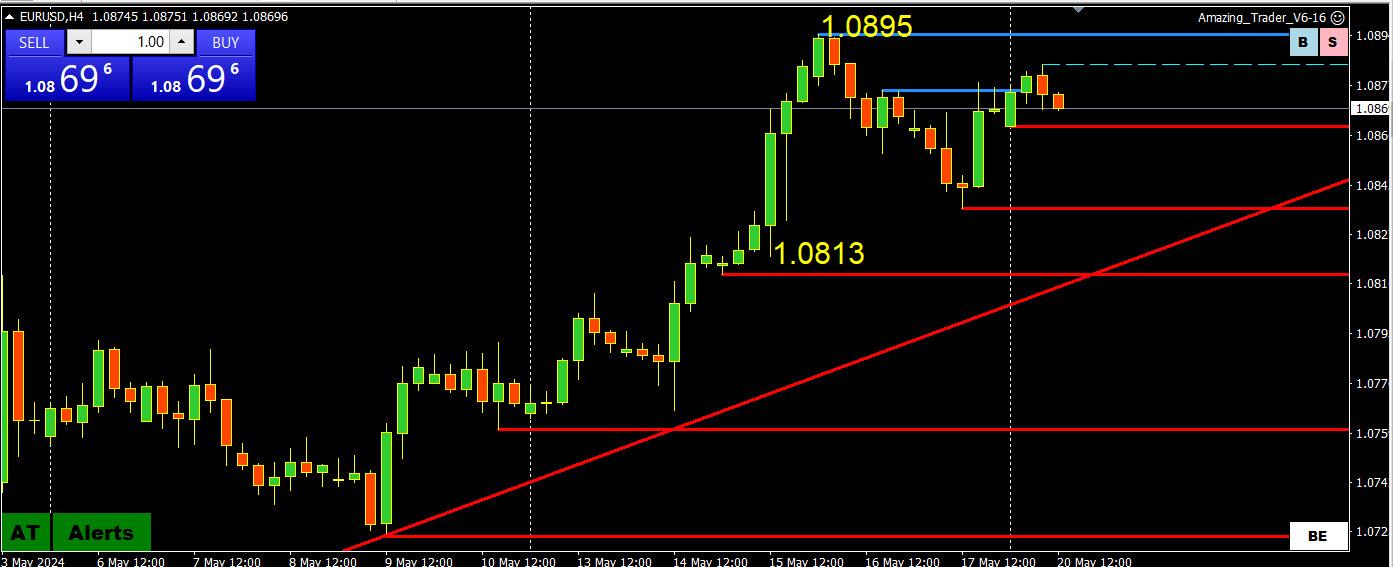
The way I look at it, there are only 2 key levels on this chart that would trigger key stops, 1.0813 and 1.0895.
This leaves it consolidating within a break 1.08-1.09 range where 1.0850 will likely set its bias and what side is at risk.
Market down today’s range, especially the high for EURUSD and other currencies, and see if it produces a Monday Effect week (I will post a link to an article on this)..
May 20, 2024 at 9:16 am #6494May 20, 2024 at 3:06 am #6493May 20, 2024 at 3:00 am #6492May 19, 2024 at 11:17 pm #6491THIS WEEK’S MARKET-MOVING EVENTS (all days local)
No action is the wide consensus for both the Bank of New Zealand on Wednesday and the Bank of Korea on Thursday. The People’s Bank of China is not expected to cut its loan prime rates on Monday after the government’s move in the prior week to stabilize the housing sector. As for the US, Wednesday’s FOMC minutes may prove less useful than usual given how outspoken Federal Reserve officials have become in pushing back the outlook for rate cuts.
Canada’s CPI on Tuesday is expected to moderate to 2.7 from 2.9 percent as is Japan’s CPI on Friday to 2.4 from 2.7 percent, while the UK’s CPI on Wednesday is seen falling a full percentage point to a normal looking 2.2 percent. Thursday will see May’s run of PMI flashes which are expected to hold steady, showing general contraction for manufacturing and moderate expansion for services. UK retail sales on Friday are expected to be soft.
Econoday
May 19, 2024 at 11:04 pm #6490Tight eh ?
Best view , ie most recent indication of what is going on currently is to click the 1Y view
May 19, 2024 at 10:39 pm #6489May 20 (Reuters) – A look at the day ahead in Asian markets.
Broadly speaking, the global backdrop for Asian markets is still bright, with investors confident that the Fed will soon cut U.S. interest rates keeping the dollar, bond yields and volatility in check, and boosting risk assets.
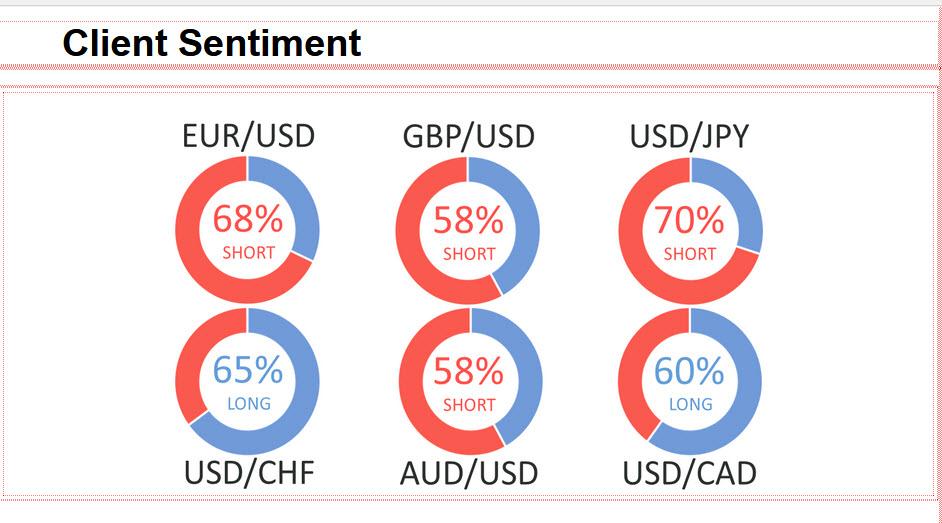
May 19, 2024 at 5:23 pm #6487 According to IG
A majority of IG traders are long US dollar against key currencies like EUR and GBP after soft CPI inflation data led to substantial dollar weakness on Wednesday of last week. In USD/JPY, however, 70% of IG traders with open positions are short as the pair continues to trade above 150.00—not far from historic highs.
 May 19, 2024 at 2:51 pm #6478May 19, 2024 at 11:52 am #6477
NAS 100 (NASDAQ) DAILY CHART – WHEN IN UNCHARTERED TERRITORY
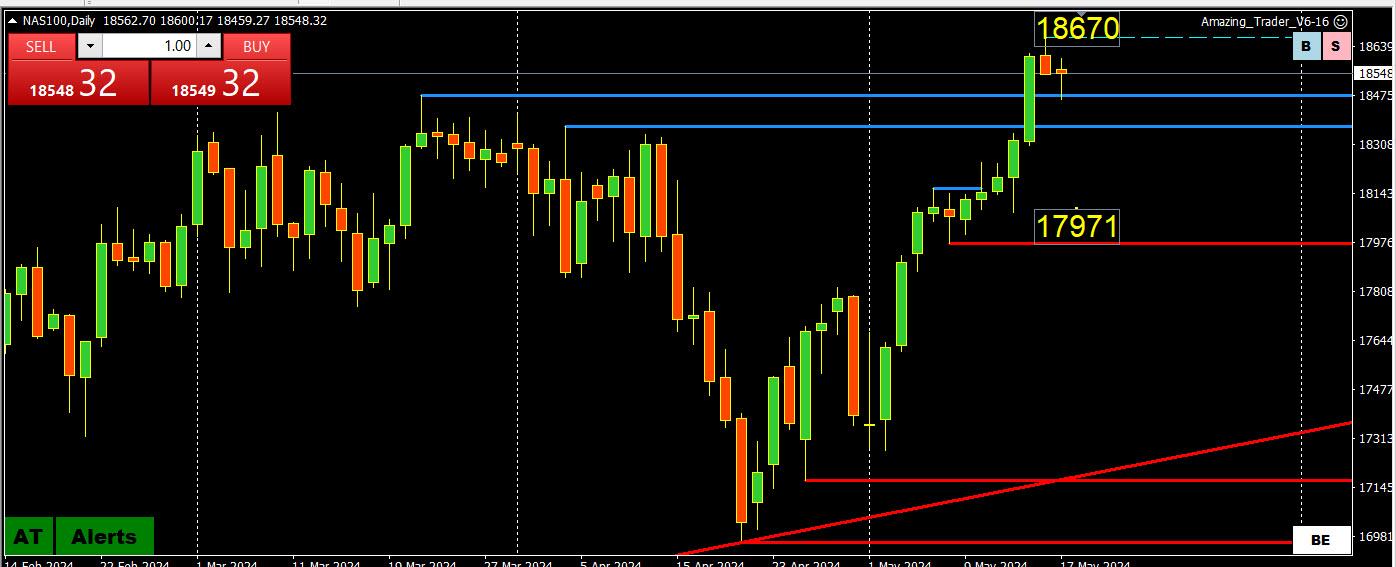
When trading in record high territory, the only resistance that matters is at the most recent record high. Trying to forecast where the ultimate peak may be is pure guesswork so keep an eye on the record high since it is the only level that matters
Expect support as long as it trades above 18000.
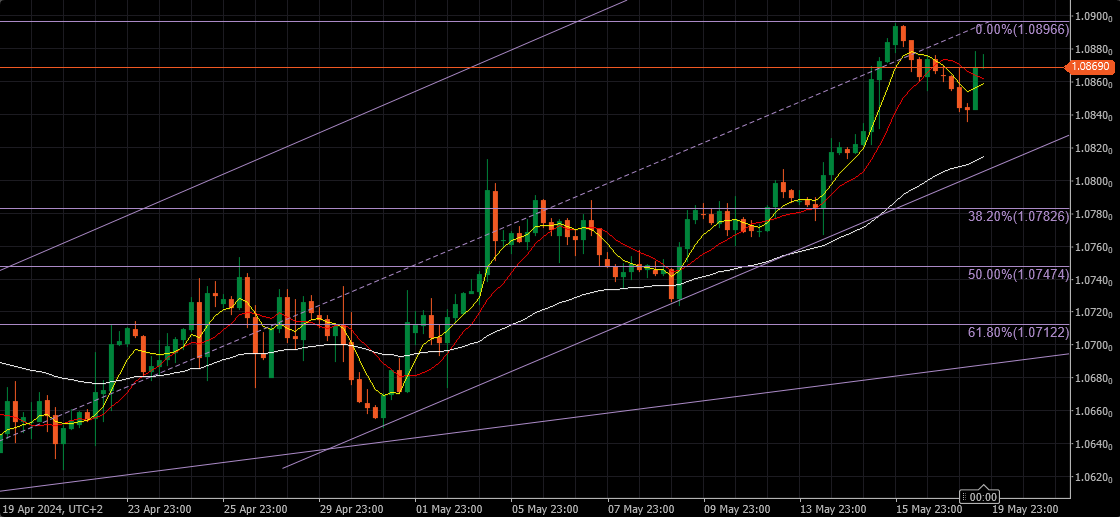
May 19, 2024 at 10:59 am #6476EURUSD 4h Prior to Opening tonight
Support at : 1.08400, 1.08250 & 1.08100
Resistance at : 1.08850 , 1.09000 & 1.09200
Friday’s close indicates continuation of Up move .
I expect Supports to be visited prior to another leg up.
In the case it fails to reach new high , deeper correction will be on it’s way.
 May 19, 2024 at 10:11 am #6475
In the week ahead there is a light US economic calendar but as we have seen lately even 2nd or 3rd tier data can have an exaggerated impact in these hyper-sensitive markets, This should keep the focus on non-US data in what is generally a light data week ahead of the long US Memorial Day holiday weekend.
 May 18, 2024 at 4:39 pm #6474
Monedge is an institutional grade investment/trading analytics organization, and is actively seeking one or more individuals with technical skills which may assist in the development of wireless and site applications pertaining to market participation.
If you may have attributable skills and would like to inquire, please visit our website at http://www.monedge.net and inquire in the contact section where there is a very simple contact submission that only takes a few seconds. Thank you in advance, we look forward to hearing from you
Posted with permission of Global-View.
May 18, 2024 at 12:17 pm #6473There are many reasons why online traders struggle to succeed but the one I am focusing on today is the Psychology of Trading. It is hard enough to make money that you don’t need psychological factors to work against you but that is the reality. As with all my discussions, everything I say comes from experience and not from anything I have read in a textbook.
Psychology of Trading. This article may change the way you look at trading

Psychology of Trading. This article may change the way you look at trading
May 18, 2024 at 11:11 am #6472USDX DAILY CHART – WHERE ARE THE FLOWS GOING?
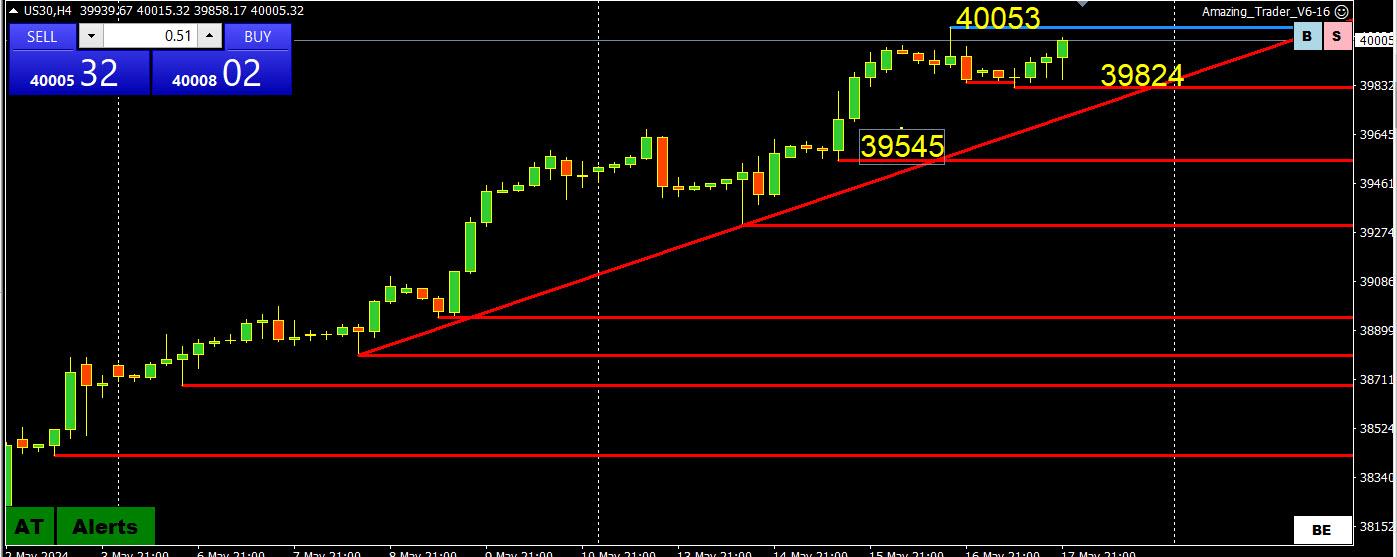
While the US Dollar Index (USDX) closed about unchanged, the currency market traded mixed with EURUSD closing about unchanged, GBPUSD higher, and the CHF and JpY weaker. The star of the day was gold.
CLOSE VS PRIOR % CHANGE
EURUSD 1..0869 VS 1.0865 +.03
USDJPY 155.65 VS 155.414 +.15
GBPUSD 1.2701 VS 1.2672 +.22
USDCAD 1.3615 VS 1.3612 -.02
AUDUSD 6692 VS .6682 +.16
USDCHF .9092 VS .9061 +.34
XAUUSD 2515 VS 2377 +1.55Do the math.
GBPJPY was the outperformer with GBPJPY coming in second.
XAUUSD outperformed all currencies with a wide margin and weakness in JpY and CHF suggests there might have been XAUJPY and XAUCHF carry trades involved.
May 18, 2024 at 10:06 am #6471May 17, 2024 at 8:47 pm #6469US 30 4 HOUR CHART – DJIA CLOSE ABOVE 40000
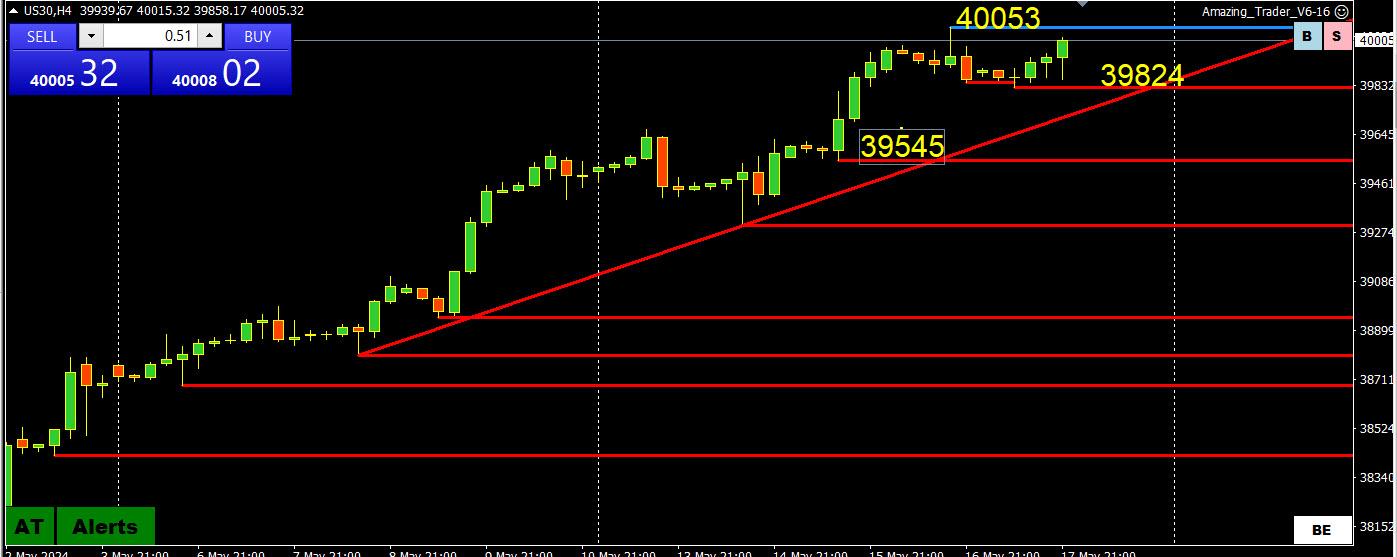
While US30 closed just above 40000, it stayed below the 40053 high
Looking ahead, there is only one level to watch and that is 40000. If it becomes support and 40053 is taken out next target would be a guess.
Of course, a failure to break the high and hold above 40000 would suggest a faikure but there is noi percentage to stand in from of a fast-moving train.
Of interest is all markets ignored a rise in US bond yields today
Next week sees a very light US economic calendar.
May 17, 2024 at 8:21 pm #6468BTC DAILY CHART – LAGGING BUT…
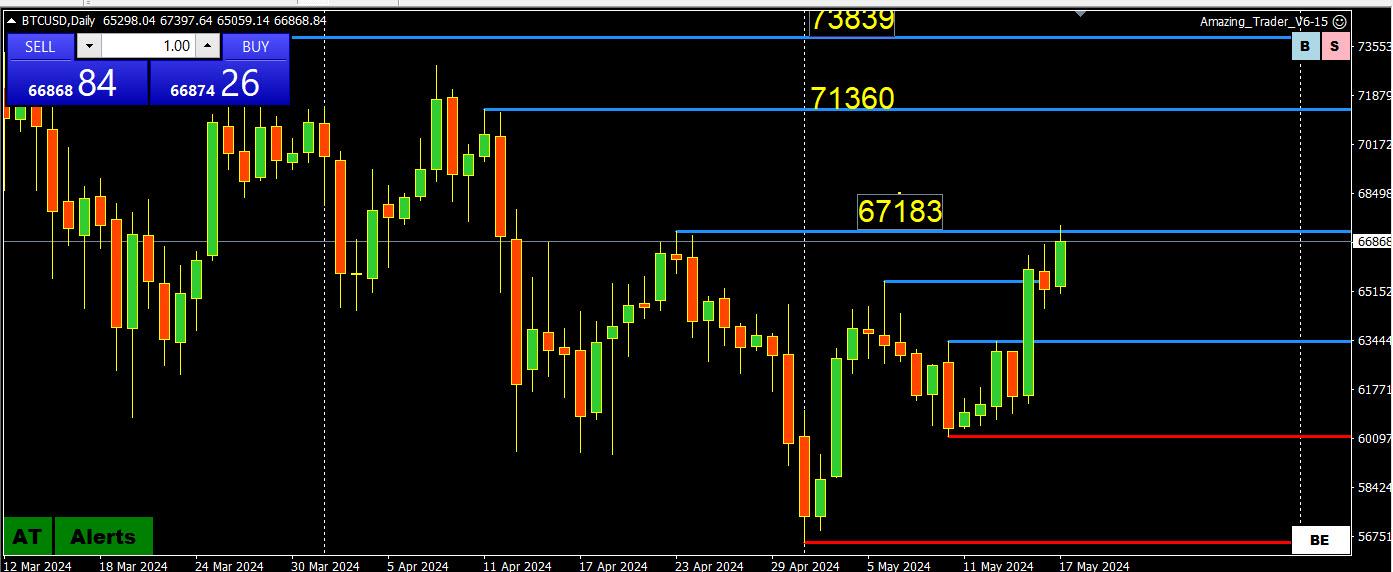
Since BTC trades over the weekend let’s see where the risk lies.
As I have noted many times, I look at round number levels like 60k, 65k, 70k
In this regard, if BTC can hold above 65K then the focus will turn to 70K
If not, then the choppy trade will continue.
So far, BTC has been lagging the move up in gold so see now if it tries to play catch-up.
May 17, 2024 at 5:15 pm #6467US 10-YEAR TREASURY – NON-CORRELATION DAY
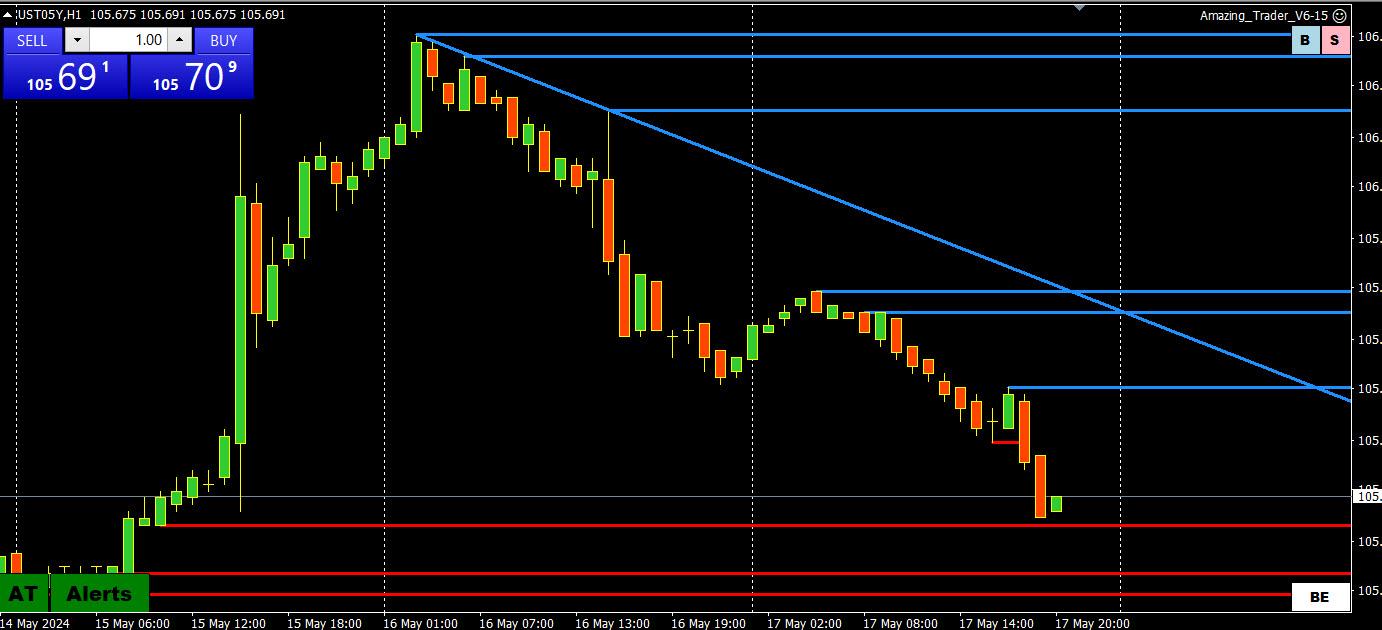
Note the price of bonds is inverse to the yield. 10-year is currently at 4.418%, the high of the day (low for the bond price)
If the forex market was correlating with the yield in bonds it would be a different story today but such is not the case.
Yields up, USD down gold up. stocks mixed.
Note USD was up earlier with firmer yields but has since decoupled.
This chart is using The Amazing Trader and what amazes me, and I created the charting algo, is how it performs with any instrument your broker offers and in any time frame.
-
AuthorPosts
- You must be logged in to reply to this topic.
© 2024 Global View
