- This topic has 11,679 replies, 48 voices, and was last updated 4 months, 3 weeks ago by GVI Forex 2.
-
AuthorPosts
-
May 23, 2024 at 12:58 pm #6740
r the
For the FIBO fans
EURUSD
1.0854 = 50% of 1.0895=1.0812
1.0863 = 61.8%
May 23, 2024 at 12:43 pm #6735May 23, 2024 at 12:10 pm #6734Next up is Weekly Jobless Claims, which have taken on greater importance.(see our Economic Calendar)
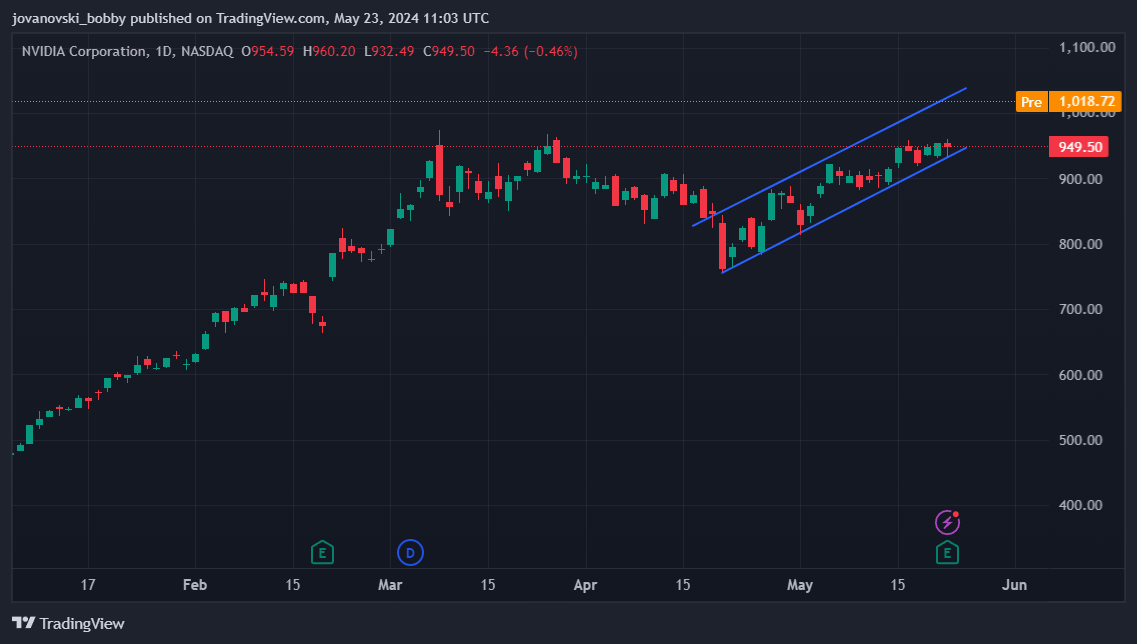
Risk on after Nividia but US yields ticking lower
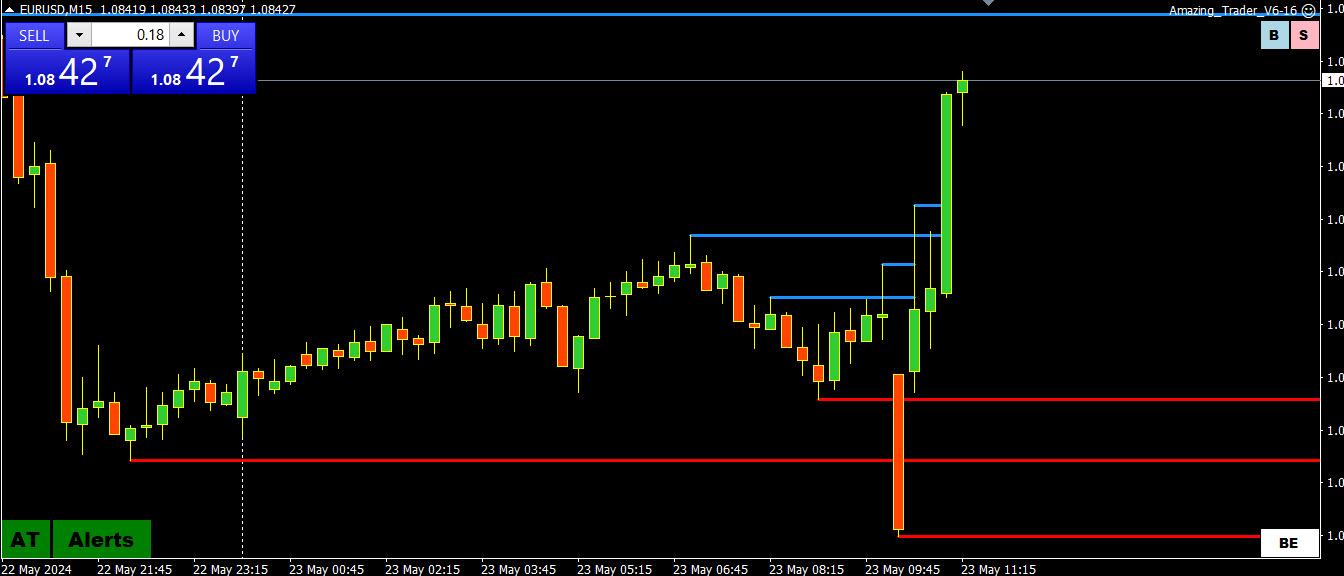
EURUSD testing 1.0850 (sets day tone) after a PMI whipsaw, down on weaker French, up on better Germany
EURGBP, my focus earlier, is off its high, cutting short GBPUSD dip which held above 1.27.
USDJPY backing off toward 156.40 after failing to reach 156.98
Disappointing on no follow-through from yesterday but typical of this market of late.
May 23, 2024 at 11:12 am #6732USDJPY 4 HOUR CHART – WHY FOCUS ON A 4-HOUR CHART?
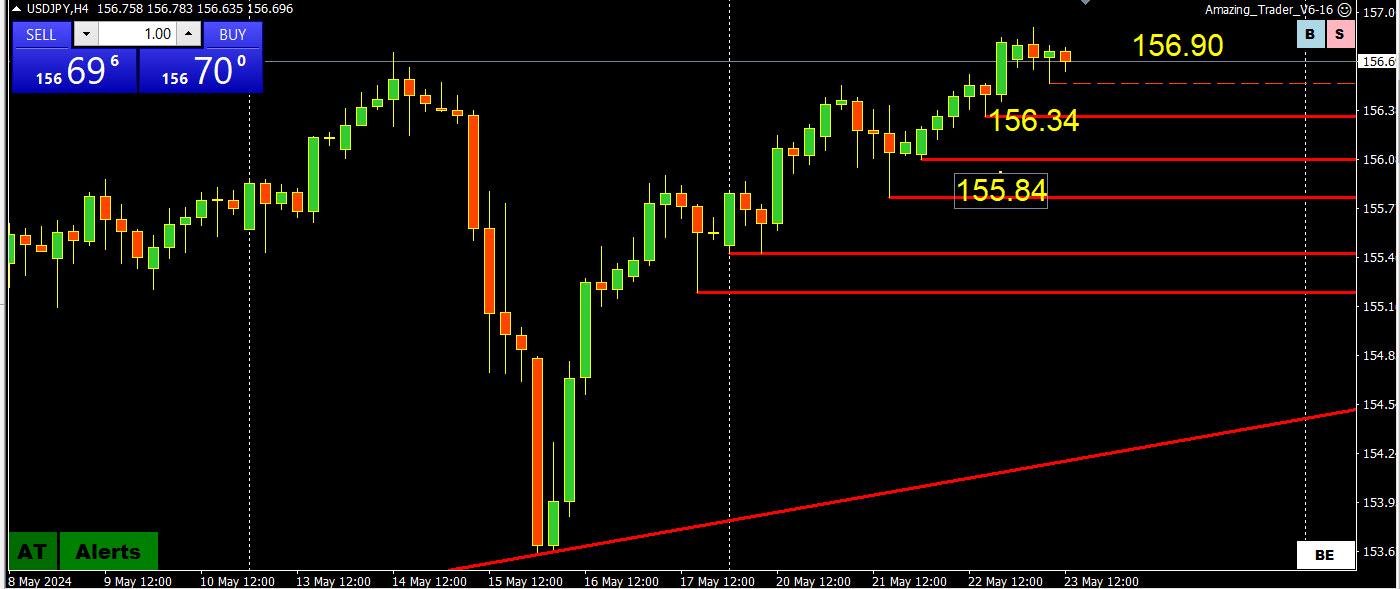
One reason I like to look at a 4 hour chart is to give me a clue as to whether there is momentum/trend on a longer-term chart or whether there is a risk of a retracement or reversal and thus a clue as to what side is most at risk.
I then scroll down to a shorter time frame chart and look for setups to trade using the 4-hour to help identify what side to trade.
In any case, I continue to put myself in the BoJ’s shoes and would like to keep USDJPY below the 61.8% retracement level at 156.98.
With that said, momentum is tilted to the upside.
May 23, 2024 at 11:05 am #6729May 23, 2024 at 11:02 am #6728May 23, 2024 at 10:41 am #6727May 23, 2024 at 10:25 am #6726May 23, 2024 at 10:22 am #6725May 23, 2024 at 10:11 am #6724A look at the day ahead in U.S. and global markets from Mike Dolan
Yet another quarterly earnings beat from AI-chip behemoth Nvidia (NVDA.O), opens new tab catapulted Wall St stock futures higher again on Thursday – batting away hawkish Federal Reserve meeting minutes, military tension around Taiwan and news of a July UK election.
May 23, 2024 at 9:47 am #6723As outsiders, we need as much information as possible to get in sync with what flows are driving the FX market at any point in time. This is one reason why I posted the series of charts to show the influence of EURGBP on EURUSD and GBPUSD. It creates sort of a tug-of-war to see which side (in this case EURUSD buying or GBPUSD selling) the market would have more difficulty absorbing. It is explained in more detail in the following:
How You Can Use Currency Crosses to Trade Spot Forex
 May 23, 2024 at 9:42 am #6722
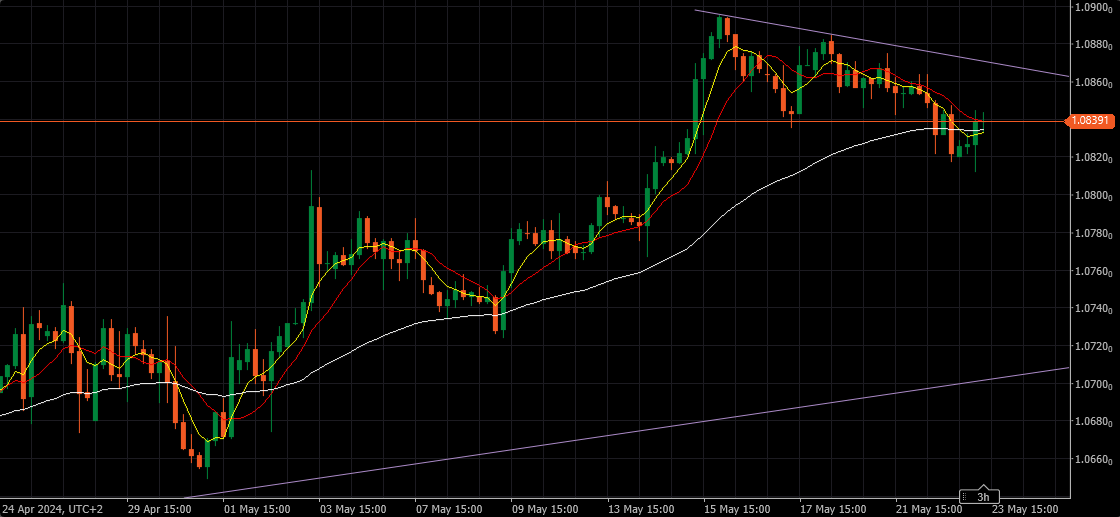
EURUSD 4h
So far supports holding – 1.08150 & 1.0800 ( always give or take a pip or two – it all depends on precision of charting station , actual real rates and of course your own hand/eyes )
Point is in the overall picture.
Right now this looks as a typical correctional move, with the resistance at 1.08500 & 1.08700.
Unless they’re taken out, we need at least a test Up, to be able to determine next move and it’s strength.
 May 23, 2024 at 9:27 am #6719
GBPUSD 4 HOUR CHART – EURGBP GIVING A CLUE
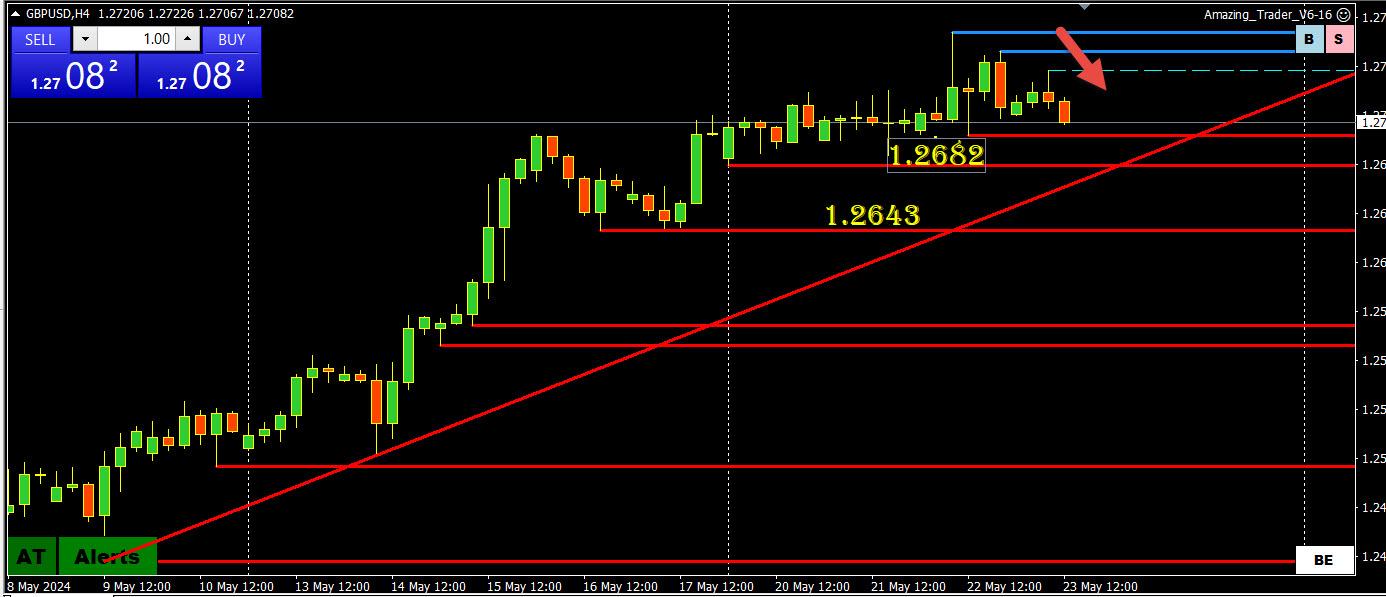
The bounce in EURGBP (last .8526) has put some downward pressure on GBPUSD, as also indicated by the 2 blue AT lines drawn off the high on this chart, which shows the potential for a shift in directional risk.
With EURUSD unable to test 1.0847, offsets have taken over and this has seen GBPUSD dip. This is what I refer to as Using Crosses to Trade Spot FX.
With that said, at a minimum, 1.2682 and then 1.2643 would need to be broken to confirm a high is in for now. For that to occur, 1.27 would need to be broken. Low so far has been 1.2705.
May 23, 2024 at 8:53 am #6717USDX 4 HOUR CHART – 3-PART CHECKLIST
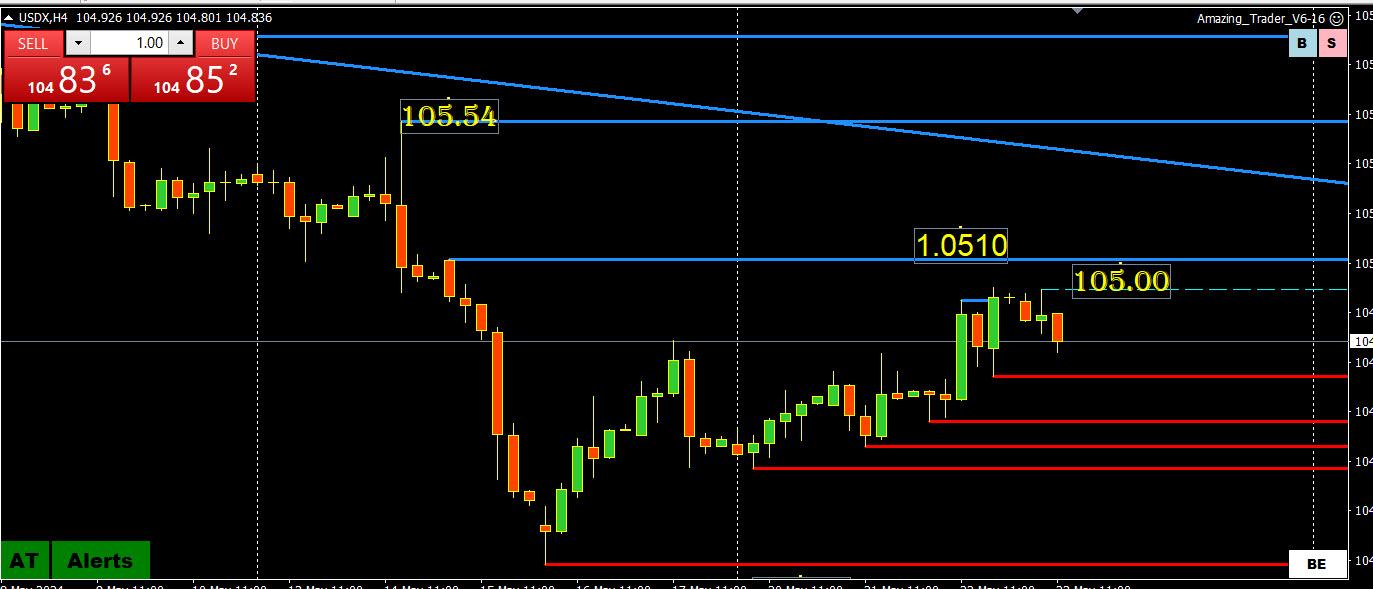
While I do not trade USDX, it is part of my 3-part checklist if I am trading the EURUSD (note EURUSD is 57.6% of the index). I look at the following:
1) EURUSD
2) EURGBP (cross influence of EURUSD)
3) USDX (often a proxy for the EURUSD)
Looking at this chart, USDX paused below 105.10, which suggests EURUSD might pause as well.
May 23, 2024 at 8:44 am #6716EURGBP 4 HOUR CHART – BOUNCED OFF PIVOTAL LEVEL

Certain pivotal levels can have a greater impact than a technical chart point.
I call them “magic” levels.
One of these would be .8500, which was nicked on the EZ PMI volatility.
The bounce from it suggests the potential for a low or at least a pause but would need to get back above .8541-51 to confirm the bottom is in.
Note, UK flash PMI just came out, mixed bag but above 60.
May 23, 2024 at 8:30 am #6715May 23, 2024 at 8:17 am #6712EURUSD 4 HOUR CHART – BOUNCED OFF SUPPORT

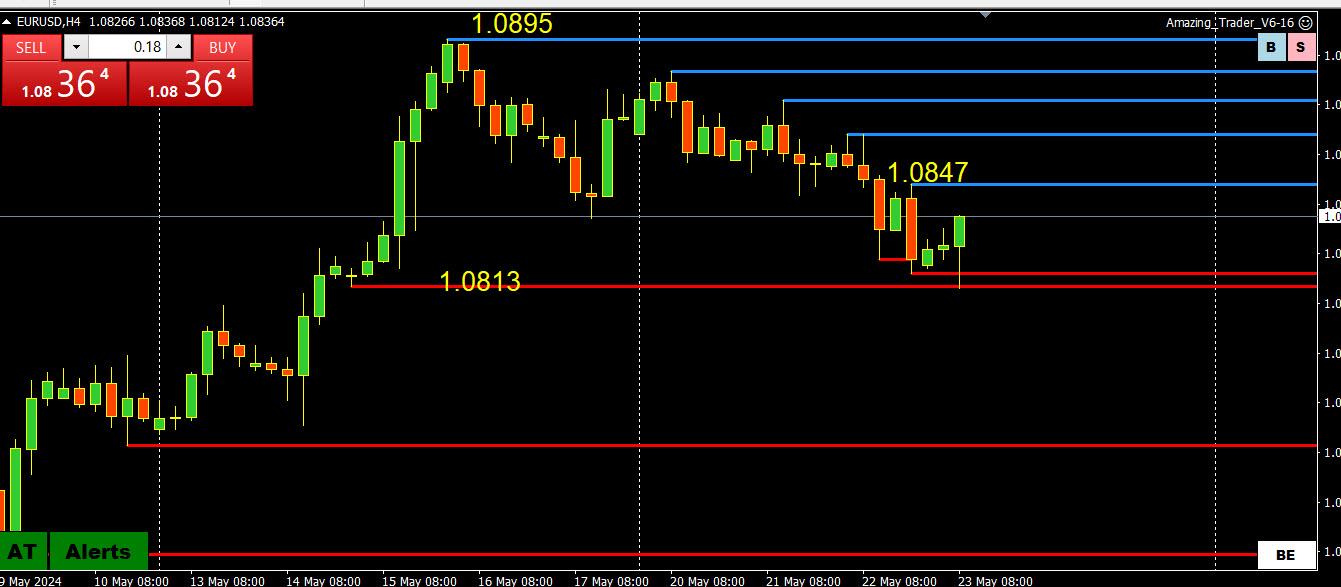
It appears there was some volatility around flash PMI reports (see our Economic Calendar<) => EURUSD DOWN THEN UP,
A brief move down bounced right off 1.0813 support =THIS IS A KEY LEVEL THE WAY I USE THE AMAZING TRADER as it is the last low before the run up to 1.0895.
On the upside, 1.0847-53 resistance.needs to hold to contain this bounce.
May 23, 2024 at 12:24 am #6707May 23, 2024 at 12:02 am #6706May 22, 2024 at 11:16 pm #6705BOSTON, May 22 (Reuters) – Goldman Sachs (GS.N), opens new tab CEO David Solomon said on Wednesday he does not expect the Federal Reserve to cut interest rates this year.
“I’m still at zero cuts,” Solomon said at a Boston College event. “I think we’re set up for stickier inflation.”
-
AuthorPosts
- You must be logged in to reply to this topic.
© 2024 Global View

