- This topic has 11,679 replies, 48 voices, and was last updated 4 months, 3 weeks ago by GVI Forex 2.
-
AuthorPosts
-
May 24, 2024 at 1:08 pm #6808
US500 4 HIUR CHART – BOUNCING BUT..
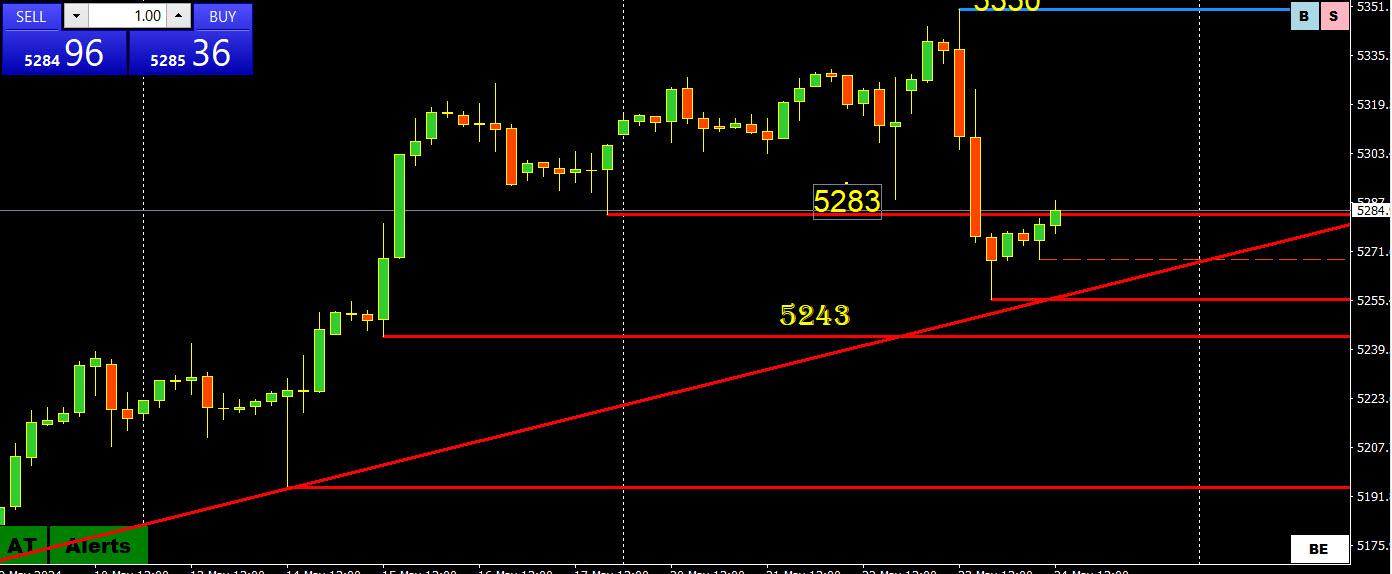
US5– bounce would need to at least recover above 5283 and hold there to ease the risk on the downside.
Keep an eye on US bond yields with the 10-year hovering again just below the pivotal 4.50% level
Note your price s may differ as CFDs prices can vary from broker to broker. Look for a similar pattern or line on your chart.
May 24, 2024 at 1:08 pm #6807May 24, 2024 at 12:31 pm #6803May 24, 2024 at 12:28 pm #6801May 24, 2024 at 12:16 pm #6800May 24, 2024 at 12:15 pm #6799USDCAD 4 HOUR CHART -backing Off But…
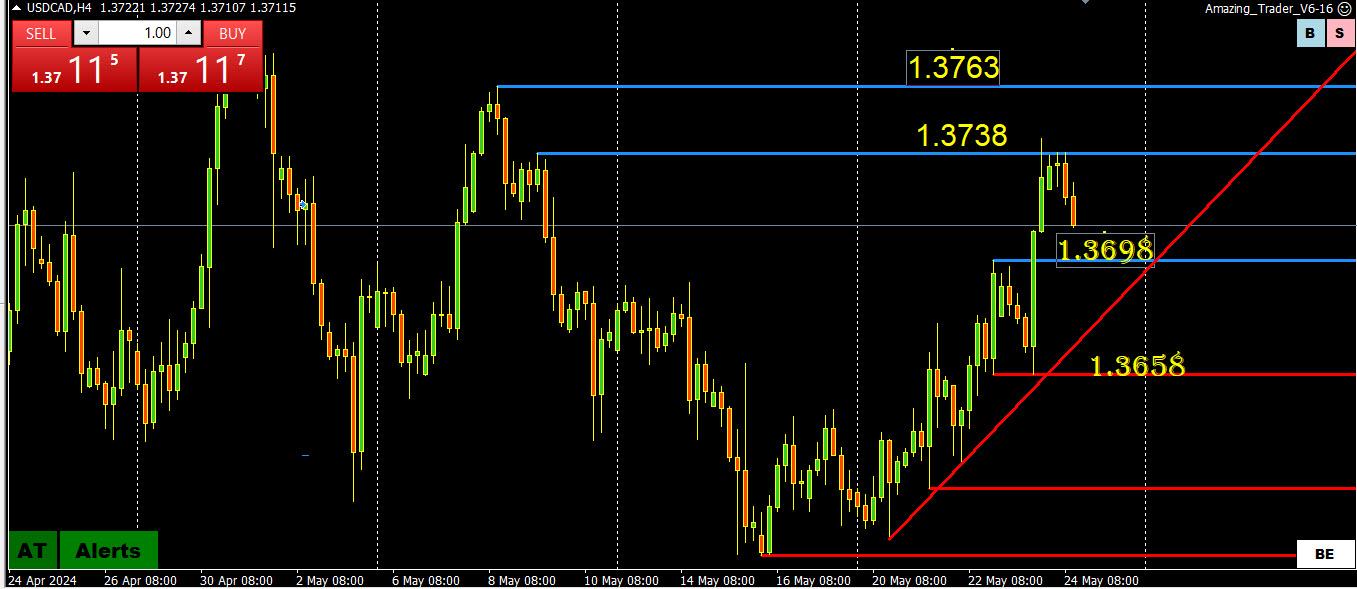
USDCAD followed general USD moves and backed off after failing to stay above 1.3738 and not testing 1.3763.
Now needs to hold 1.3698 to keep these levels for a strong bid but expect support as long as the trendline and 1.3658 hold.
Next up: Canadian Retail Sales – See our Economic calendar
May 24, 2024 at 10:41 am #6798BTC 4 HOUR CHART – WATCH THE PATTERNS
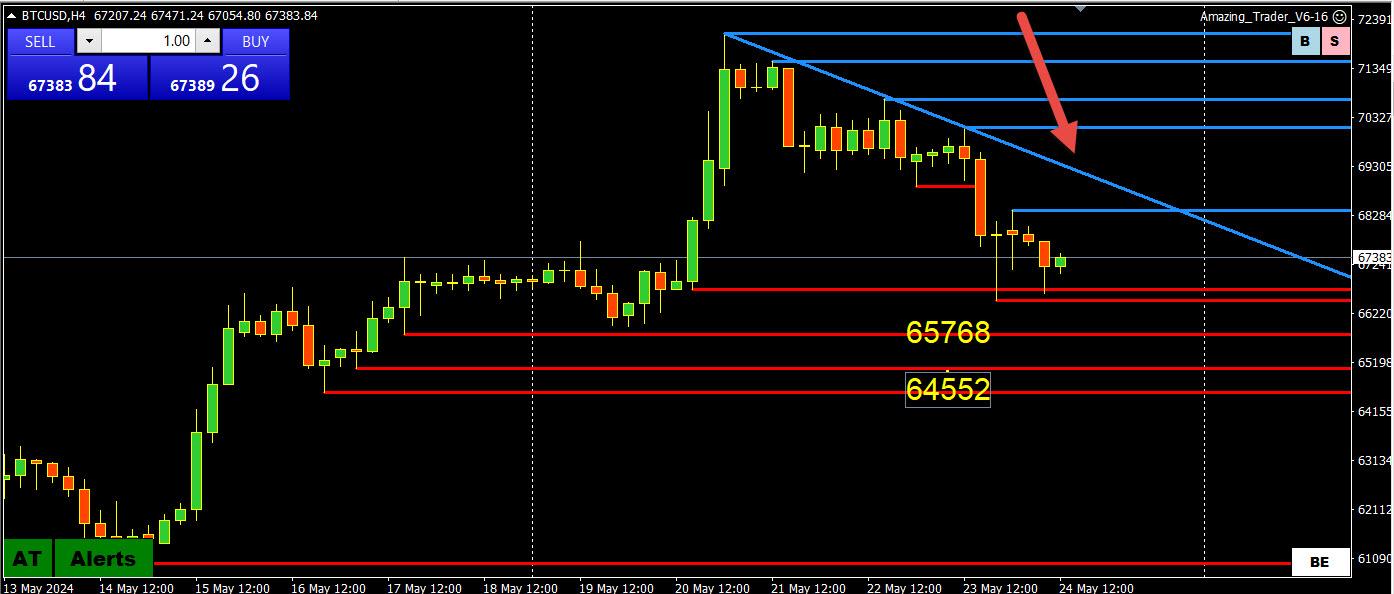
As I have noted, any instrument that can move 5-10% in a day makes it hard to focus on technical levels.
I prefer to look at the patterns on the chart and as The Amazing Trader blue ladder lines show, the risk had shifted to the downside.
As I have also noted, I prefer to look at pivotal levels, which in this case are 65k and 70k, above 65k keeps the focus on 70k despite the softer tone.
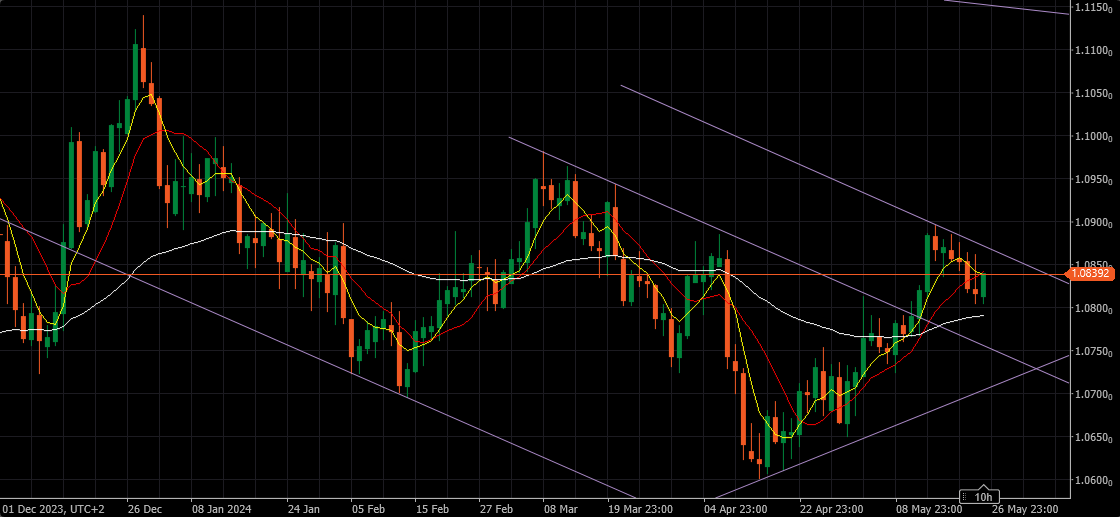
May 24, 2024 at 10:39 am #6797EURUSD Daily
As I have said numerous times : when you see some trend lines on my charts that seem like coming from nowhere and contradicting basic trend line drawing rules – I am bringing them from the past – historical angles rules.
Combined with MA’s and Patterns / Formations I try to predict the future.
I put aside any and all Fundamental analysis and come up with few scenarios that might unfold – it is NEVER just one scenario.
Then I check out same scenarios on Weekly and Monthly .
Most of the time one of those scenarios comes through – fundamentals align, patterns clear and trade begins.
Trade is executed on smaller time frames like 30 min and lasts only one bar!
It is maybe not a rocket science, but it is really not that far away from it…
I will put together more detailed explanation for the blog edition over the weekend….
 May 24, 2024 at 10:16 am #6796
A look at the day ahead in U.S. and global markets from Mike Dolan
And then there was one.
In an extraordinary turnabout in just five months, financial markets now fully price just one quarter-point interest rate cut from the Federal Reserve this year – compared to the six built into futures prices at the start of 2024.
May 24, 2024 at 10:10 am #6795USDX 4 HOUR CHART – DAILY CHECKLIST
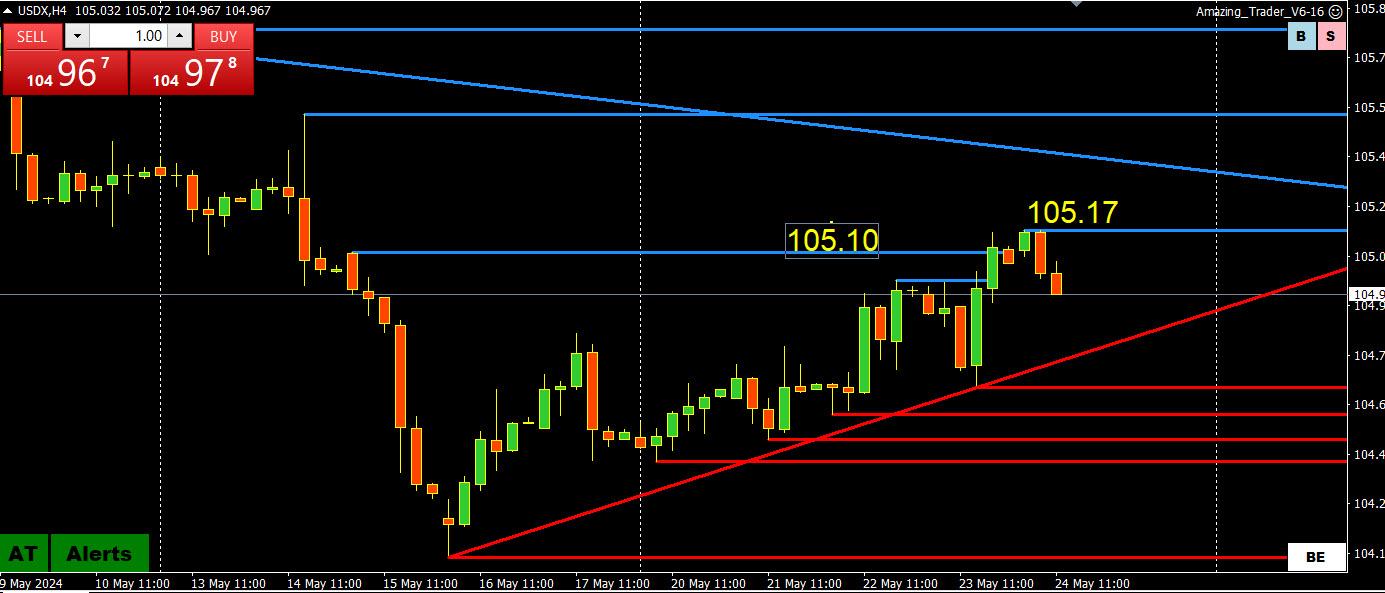
As I noted yesterday, USDX is part of my daily checklist to see if I can use it as a EURUSD proxy (57.6% of the index).
The break of 105.10 has not followed through but will treat EURUSD bounce as a retracement within the range as long as the trendline holds.
with that said, the EURUSD range is 5 pips inside of either side of 1.08-1.09 (1.0805-1.0895), MAKING 1.0850 THE NEUTRAL LEVEL.
May 24, 2024 at 10:04 am #6794on deck today
directly from reykjavik … (iceland)
–
Reykjavík Economic Conference – Keynote address by Christopher J. Wallercertainly not taking a sailboat. why not use zoom
ahh well that is another topicMay 24, 2024 at 9:33 am #6793May 24, 2024 at 8:57 am #6792May 24, 2024 at 8:51 am #6791May 24, 2024 at 8:20 am #6790HOW IS THIS FOR A NICKNAME FOR THE JPY. WE HEARD THIS TERM FIRST MANY YEARS AGO FROM A FORUM MEMBER AND I NEVER FORGOT IT.
LONDON, May 23 (Reuters Breakingviews) – For more than two decades, investors lost their shirts in Japan. In a trade that became known as a “widowmaker”, they sold short Japanese government bonds with their tiny yields, yet suffered as long-term rates crept ever lower and bond prices rose. Today, taking a long position in Japan’s currency is similarly threatening to shorten the lifespans of investors in the Land of the Rising Sun. Over the past three years, the yen has fallen by around 50% against the U.S. dollar. But there are good reasons that painful bet may pay off sooner.
May 24, 2024 at 8:18 am #6789May 24, 2024 at 8:01 am
GVI ForexFailed (so far) to test 1.08 today as well as held just above yesterday’s 1.9804 low
Resistance is at 1.09831, which would need to be taken out to negate the current risk to 1.08 or below.
—————————————————————
Jay, are you checking who is reading your posts by noticing your mistakes or you simply still sleeping? 🙂
May 24, 2024 at 8:17 am #6788XAUUSD 4 HOUR CHART – Levels to watch
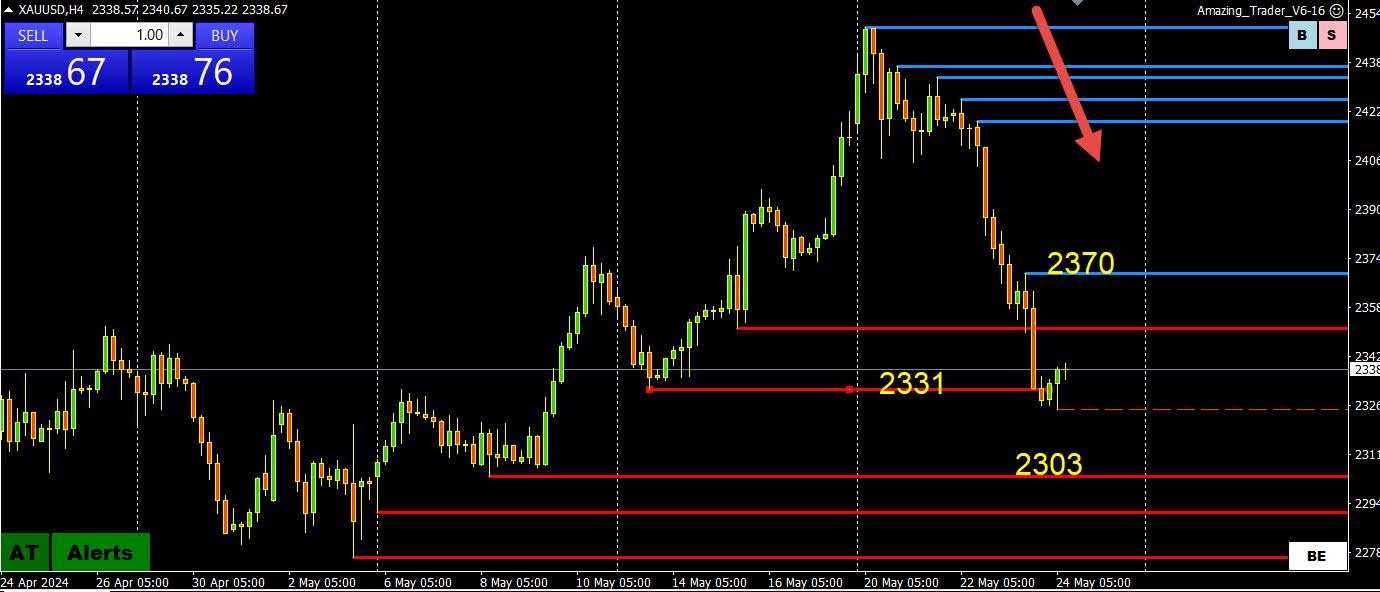
Blue Amazing Ytader ladder lines gave a clear shift in directional risk to the downside as it extendds its retreat from the record 2450 high.
Levels to watch
Would need to establish below 2331 to out 2303 (remember that level!) in play (low so far 2324)
On the upside, 2370 is resistance that needs to hold to maintain the current momentum
May 24, 2024 at 8:01 am #6787EURUSD 1 HOUR CHART – 1.08 UNTOUCHED
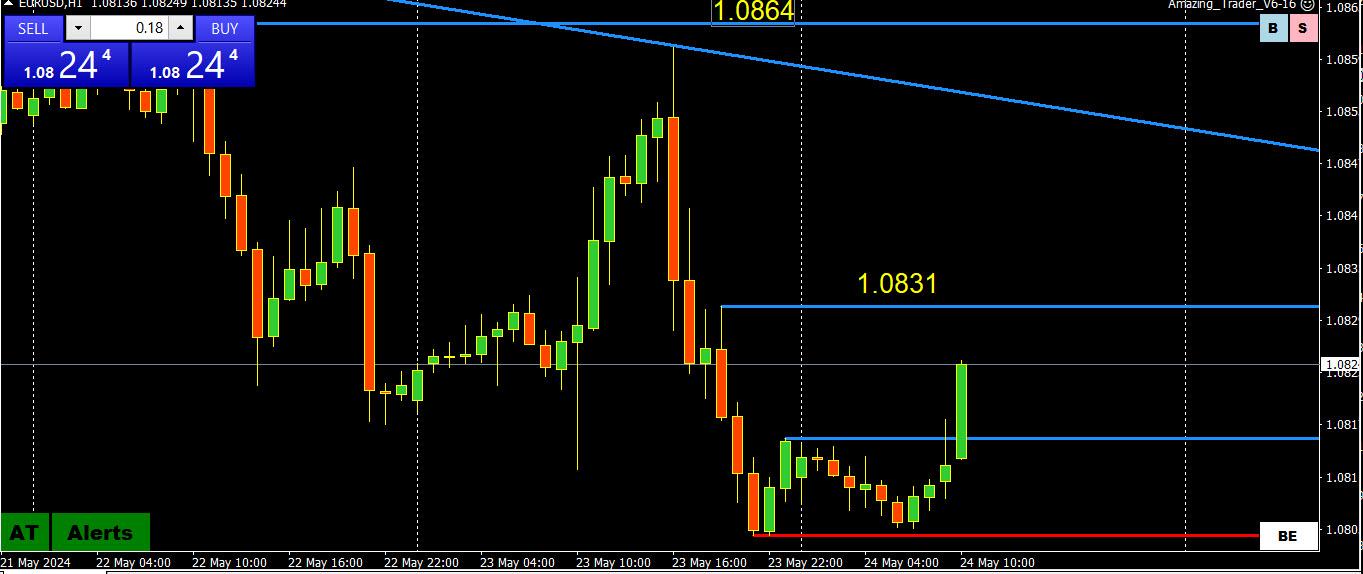
EURUSD picture is clear
Failed to test 1.0864 yesterday
Failed (so far) to test 1.08 today as well as held just above yesterday’s 1.0804 low
Resistance is at 1.0831, which would need to be taken out to negate the current risk to 1.08 or below.
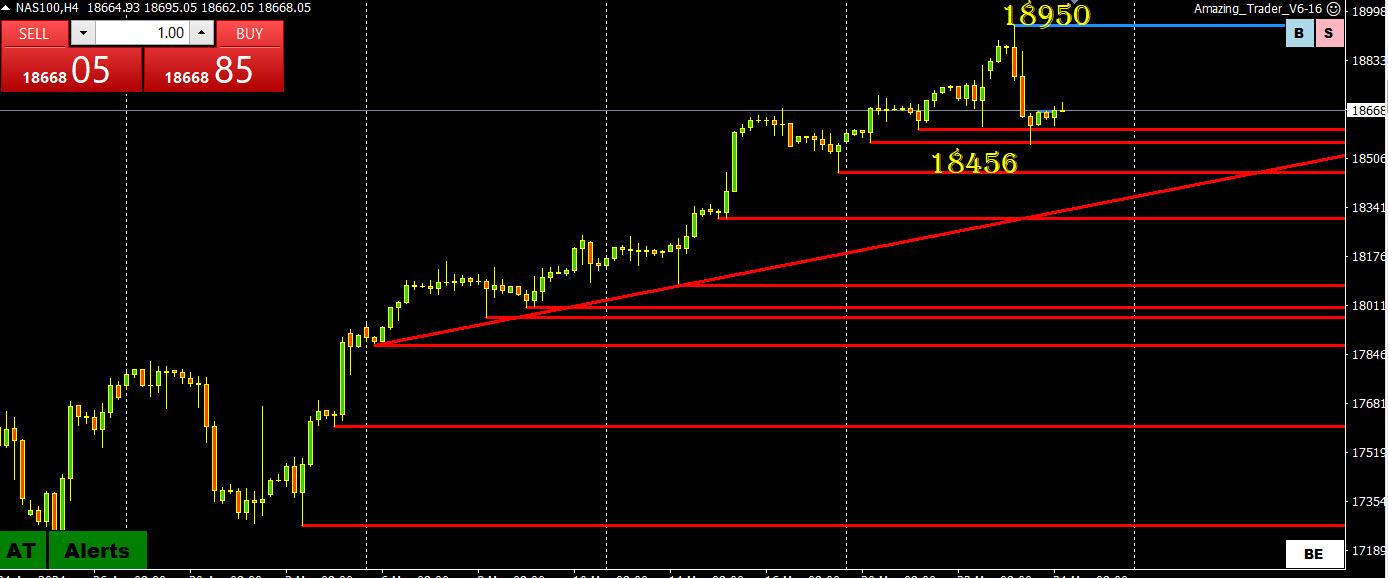
US equities have steadied overnight and will be a focus today.
Note, US markets will thin out today ahead of the 3-day holiday weekend.
May 23, 2024 at 11:12 pm #6786Anyone trading these days has seen how hyper-sensitive markets are to any news that might impact interest rate expectations. While markets have always reacted to the news, such as economic data, it is now reacting to 2nd and 3rd tier reports like they are 1st tier.
So why are markets reacting this way? Read this article to see
 May 23, 2024 at 11:01 pm #6785
USDJPY 1 HOUR CHART – INTERVENTION SCARE?
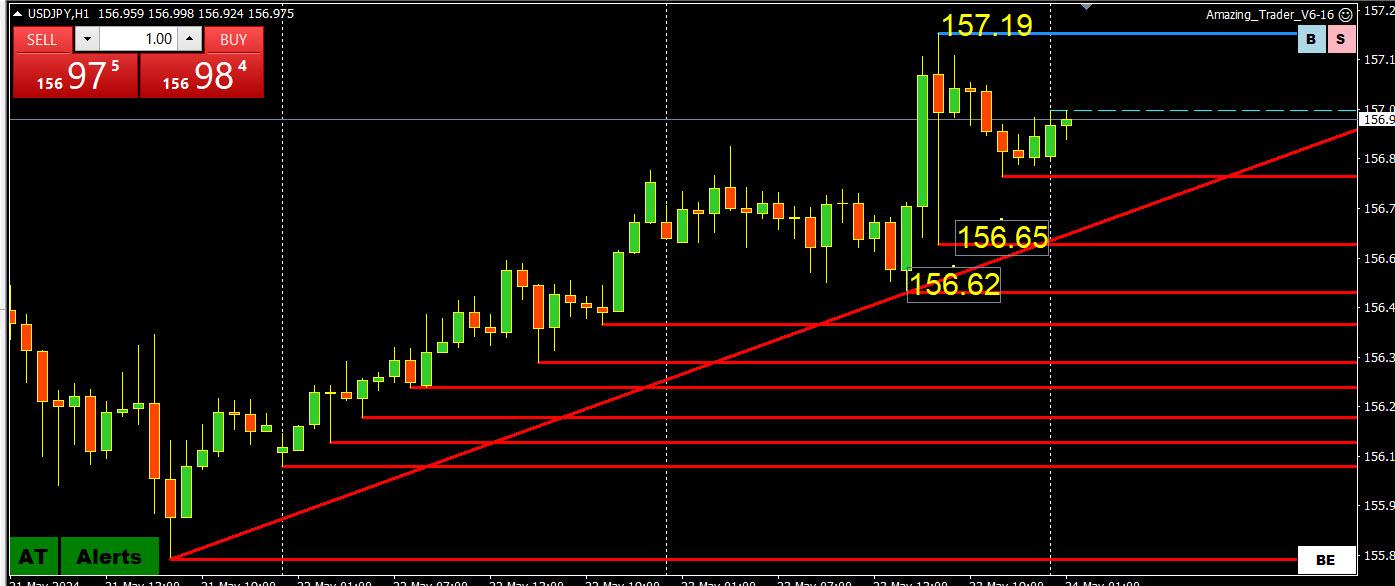
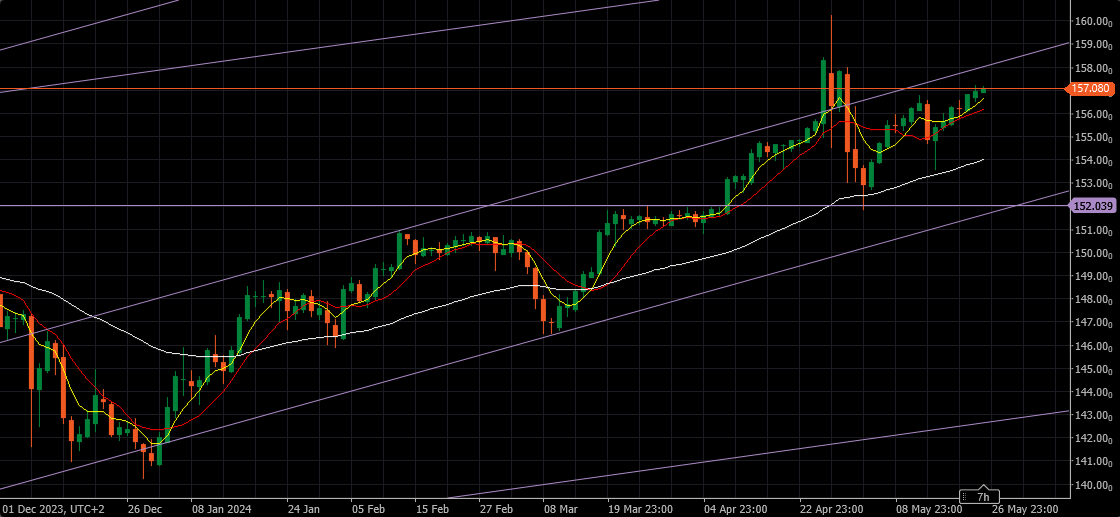
If you scroll through prior posts you will see one about the air pocket that saw USDJPY drop about 50 pips from the 157.19 high and then quickly recover.
Whether it was intervention or not I am sure the MOF/BOJ were paying attention as the next key chart level is around 158, the last obstacle to the 160.16 high.
Otherwise, USDJPY got somewhat of a reprieve from the risk-off session but will find support as long as it holds above 156.52.
-
AuthorPosts
- You must be logged in to reply to this topic.
© 2024 Global View

