If you take a step back and look at the daily chart you will see that USDJPY spent the month of May trading below the 160.16 high and almost the entire month below 157.99.
As I have been saying, if I was in the BoJ’s shoes I would want to keep it trading below 158.00 lest the focus shift to 160.16 if above it,
There have been bouts of what seems like interventiion (not confirmed) that found support on deep dips (last one was at 156.34).
On the downside, it is easier to focus on the midpoint of 150-160 and use 155 as the pivotal level to set the tone within this range (finds support while above it).
On the upside, expect a limit if it stays below 158.
Normally I would say mark down the prio month;s range but in this case mark down 151.85-160.16.
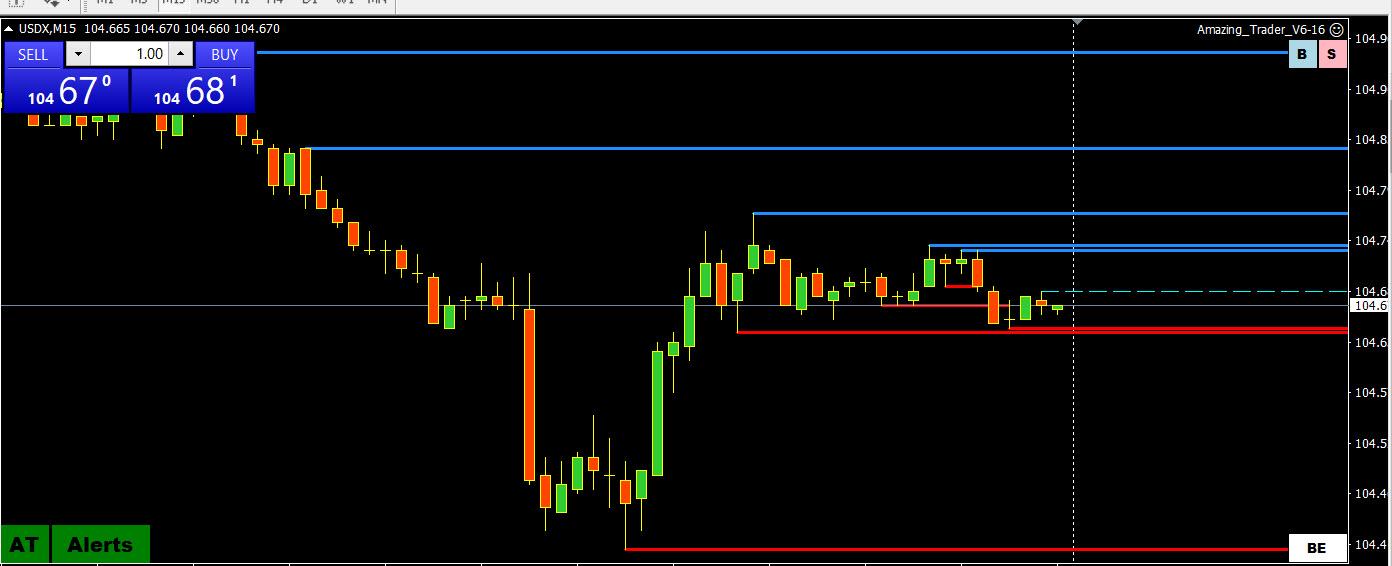
USDZ 15 MINUTE CHART – EURUSD PROXY (57.6% OF THE INDEX)
Why am I posting a 15-minute chart on a Saturday?
The reason is to show how the index ended the week in a well-defined range, reflecting how EURUSD settled into one trading around the neutral 1.0850 level.
Keep an eye on this level into the new week unless either side of 1.0801.09 is decisively broken.
Fed stance on higher for longer is not changing any time soon without something dramatic. The bid on UsdCad and UsdChf especially have been good to monedge and look bright going forward.
A strength of my creation, The Amazing Trader charting algo, is the levels on its charts. I created it and it still amazes me how well the levels work.
Look at this US500 chart, which reached my 5200 target and its low was dead on at the Amazing Trader key 5194 chart support.