- This topic has 11,679 replies, 48 voices, and was last updated 3 months ago by GVI Forex 2.
-
AuthorPosts
-
July 14, 2024 at 4:41 pm #9114
SINGAPORE, July 14 (Reuters) – Saturday’s shooting at U.S. former President Donald Trump’s election rally raises his odds of winning back the White House, and trades betting on his victory will increase this coming week, investors said on Sunday.
July 14, 2024 at 3:36 pm #9113July 14, 2024 at 10:56 am #9104Week Ahead 15th-19th July: Highlights include US & UK Retail Sales, Japan, NZ, UK and Canada inflation, and the ECB Policy Announcement
July 14, 2024 at 9:35 am #9102I have not mentioned the assasination attempt on ex-President Trump as it will not have any market impact.
One of the reasons Global-View has worked so well over its 28+ years as a community is that given our diverse membership and visitors we only post political news to the extent it might affect trading,
July 14, 2024 at 9:30 am #9101BTC WEEKLY CHART – ONLY A RETRACEMENT?
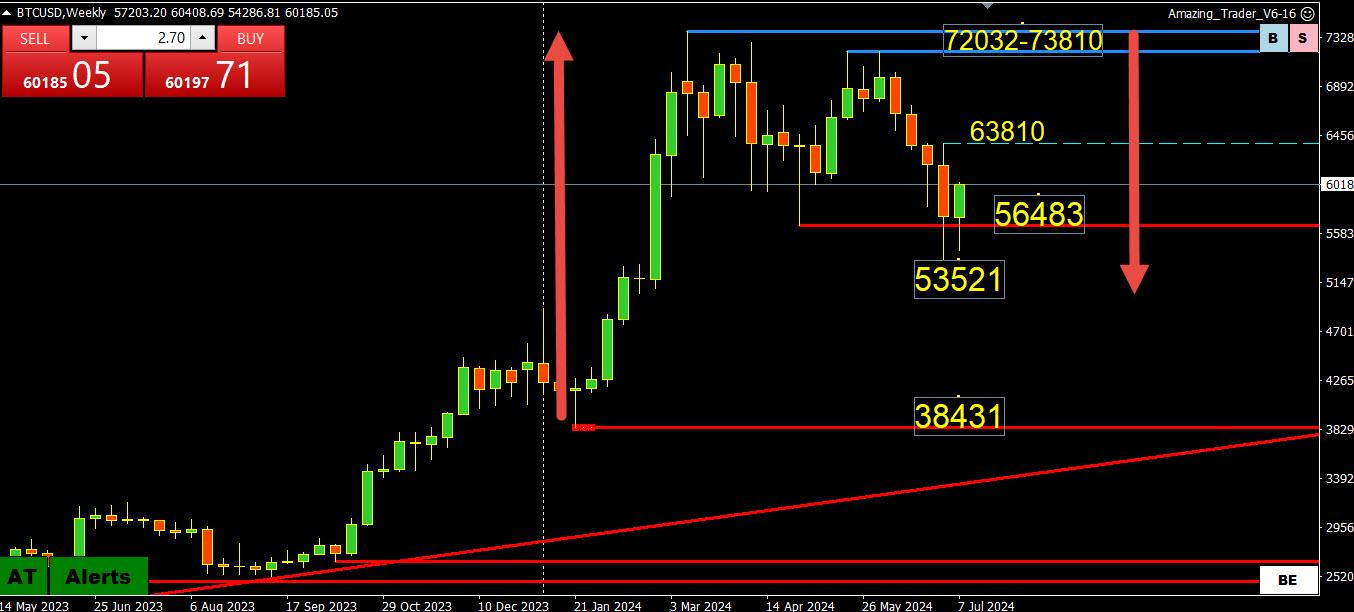
Using 38431 => 73810, 61.8% = 51946 vs. the low at 53521 … See our Fibonacci calculator
For the bull side then, a case can be made that the 15000+ pip drop is still within the realm of a retracement given the pause above the 61.8% level.
On the upside, 63819+ would be needed to confirm a bottom and shift the focus back to 65000.
In any case, the failure to hold below 56483 shifts the focus back to 60000, which will dictate whether this rebound has legs but unless the low is taken out, there are no key stops left to run on the downside.
As I have noted, I prefer to look at pivotal big figures in BTC. In this regard, 55K, 60K and 65K are the current levels to watch.
July 13, 2024 at 9:32 am #9097Global-View Trading Club Membership
Members get Full Trading Education through weekly Classes, accompanied with real time discussions, tailored for different levels of knowledge ( Basic, Advanced & Pro), Access to Exclusive Informational Material (written and video ), Trading Hot Line Help , Weekly market Updates on Major Currencies, Indices, Gold etc with Support, Resistance and Direction, Real Time Charting and Analysis Tutoring, Prop Challenge Preparation… Free trial period available
July 13, 2024 at 9:20 am #9096July 13, 2024 at 9:17 am #9095July 13, 2024 at 9:02 am #9094July 13, 2024 at 8:54 am #9093USDJPY WEEKLY – BOJ TO THE RESCUE
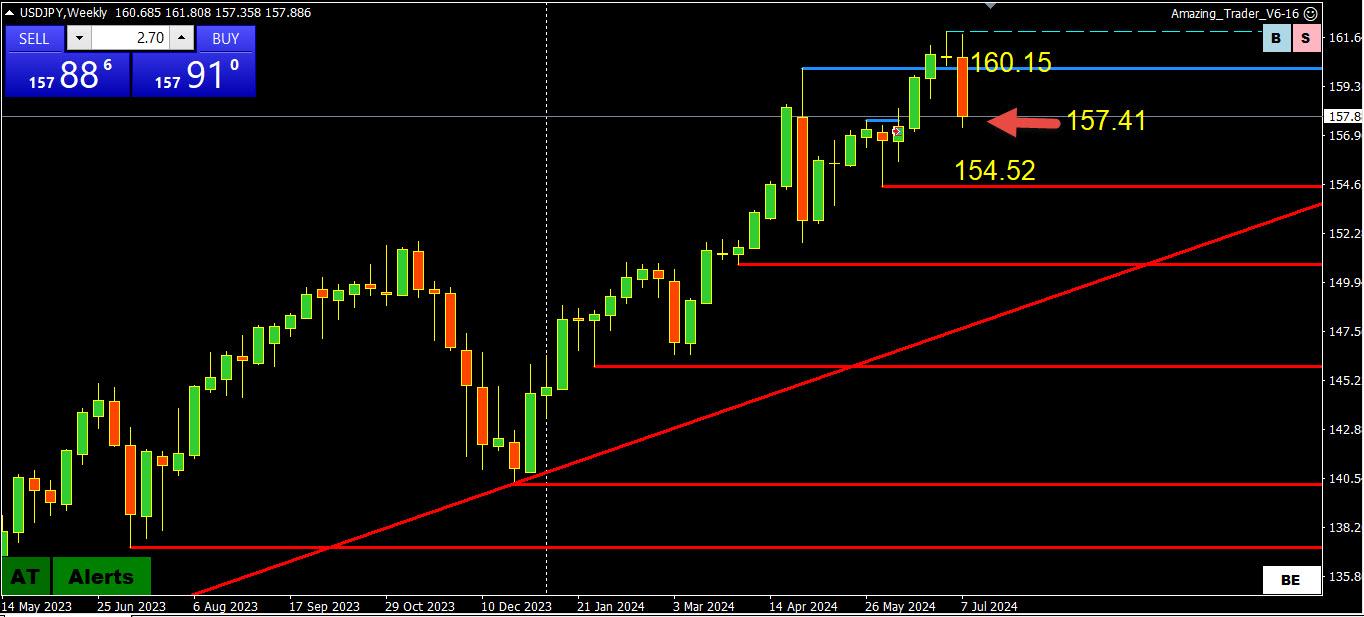
2 bouts of apparent intervention suggest the top is in for now or longer (below 162).
On the upside, 158 is pivotal in setting the tone but in any case, expect it to be limited as long as it trades below 160.00-15.
On the downside, there is a 2-day intervention low double bottom at 157.41. If broken, talk will be for 155.
Japan CPI on Friday
July 13, 2024 at 8:46 am #9092July 13, 2024 at 8:40 am #9091July 12, 2024 at 7:05 pm #9076July 12, 2024 at 6:50 pm #9075Jay – further, it is why I often include notation of multiple instruments (neural network approach) to add perspective and hopefully be helpful. After reverse engineering seemingly a thousand indicators in coding, producing my own unique codes (some of which were visually stunning and some ridiculous in the visual output) the final product ended up like a high frequency algorithm with a very simple display. The original intent was to make it so simple to allocate upon you could do it when exhausted and unable to think with your usual clarity.
Bottom line is yes, like a magnet. Big money has to revisit certain areas with extremely few exceptions.
July 12, 2024 at 6:41 pm #9074Jay – it is order based so yes. There are occasional times it ends up being close to any number of indicators but absolutely not the same and extremely reliable. It will coincide at times with a moving average point, other times a stochastic point, other times options orders, other times bollingers, on occasion volume profile, other times you name it. But if you think you will manufacture by using those things you will not end up with the same result. My best version was done on Esignal, which you have to pay a lot of money for. Currently using a hybrid which is not as good but close enough.
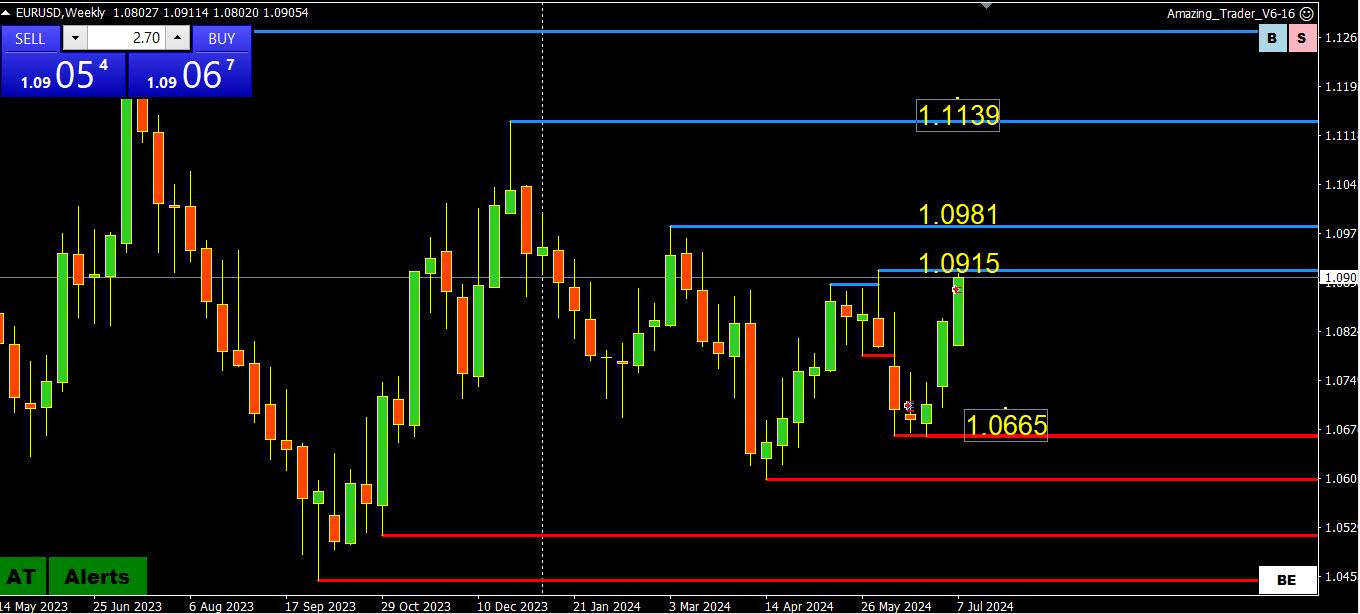
July 12, 2024 at 6:32 pm #9073EURUSD DAILY CHART – How bid?
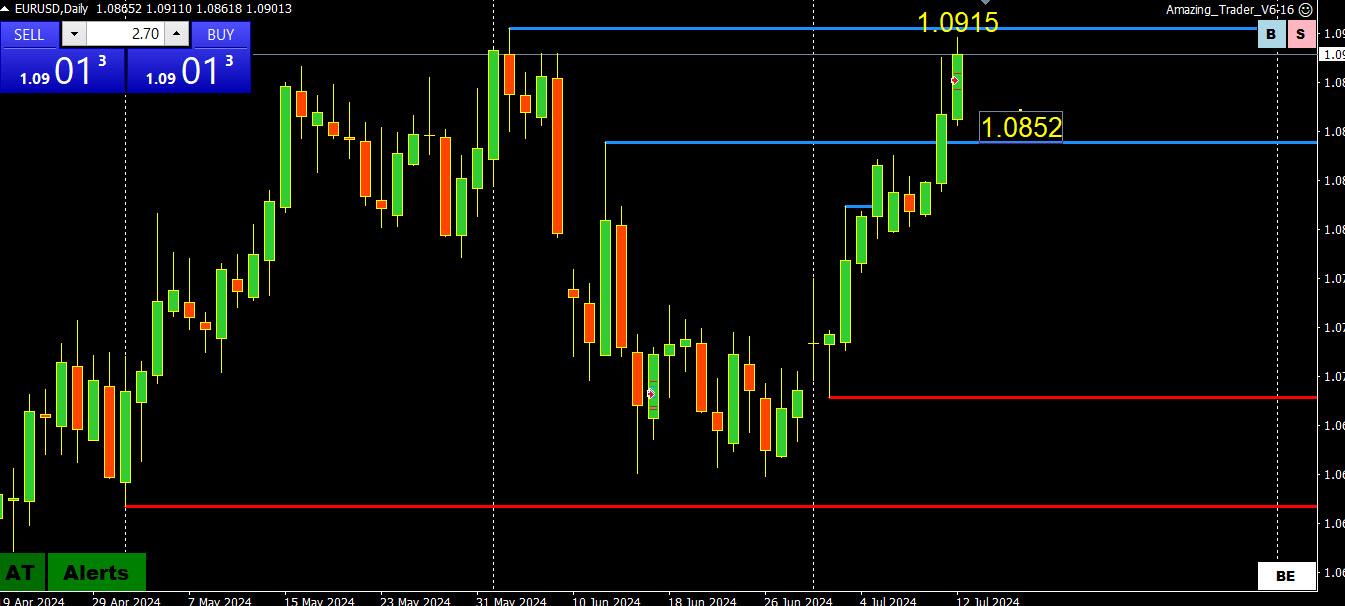
A bit if a disappointment as a break of a big figure is usually good for 20-35 pips. Instead it has been sideways watching paint dry afternoon.
Here’;s the story
Bid while above 1.0850
Stronger bid if above 1.09
If 1.0915 is firnly broken, then 1.0980 becomes a target
If 1.09 fails to hold, then it is 1.0850/60-1.0900-10
ECB meets next week
July 12, 2024 at 6:17 pm #9072July 12, 2024 at 5:51 pm #9071July 12, 2024 at 5:47 pm #9070Jay –
Point of control is where the more weighty transactions take place for any given instrument. While there is no guarantee that those areas will be revisited in the fashion I noted earlier, but the probabilities are very strongly weighted they will. That is due in part to the fact that large orders from large institutions/entities transact there. This is based on decades of factors of input for analysis, with the result being solid in terms of probability. One of the better forms of imagery I could compare it to is a volume profile. Be advised, this is not a volume profile and you will not find it there. But in some ways there are similarities. Having it is step one. Step two is application that actually works. Requires dedication.
July 12, 2024 at 5:15 pm #9069 -
AuthorPosts
- You must be logged in to reply to this topic.
© 2024 Global View


 f
f