- This topic has 11,679 replies, 48 voices, and was last updated 3 months ago by GVI Forex 2.
-
AuthorPosts
-
September 24, 2024 at 10:11 am #12000September 24, 2024 at 10:07 am #11999September 24, 2024 at 9:52 am #11998
GBPISD MONTHLY CHART – New high
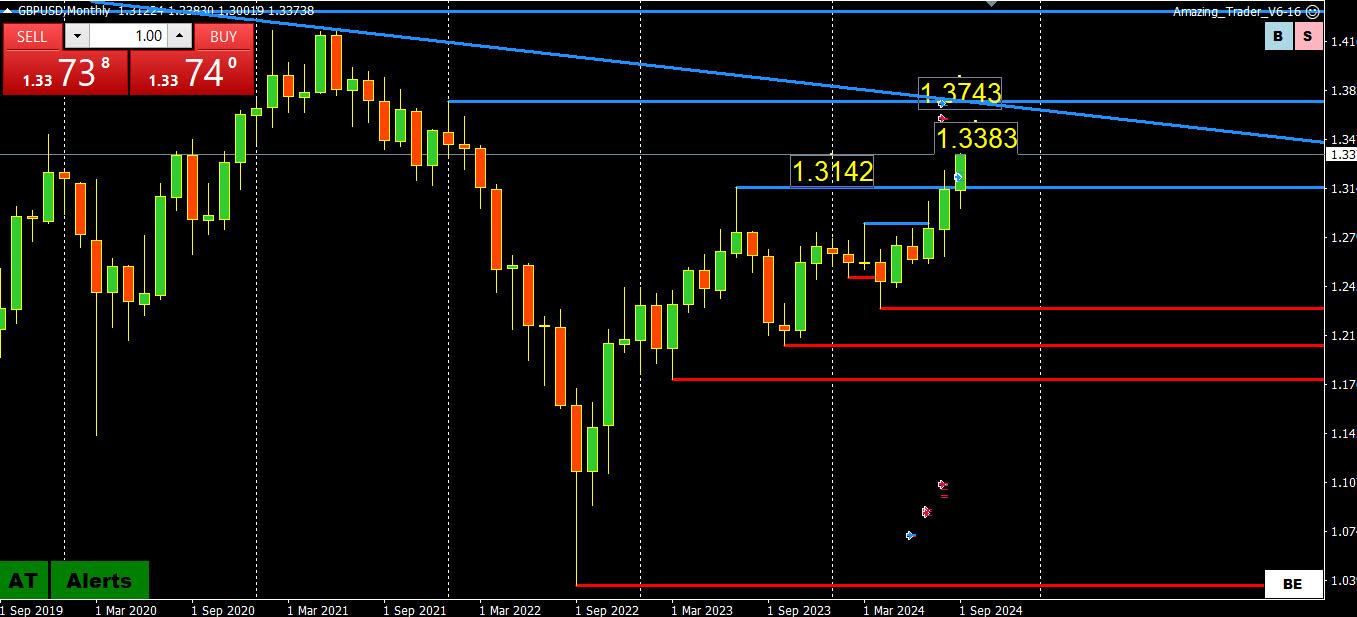
GBPUSD extended its high to 1.3383, highest level since early 2022.
With the next key level not until above 1.37, use the most recent high as the closest key resistance.
To dent the upward momentum, Monday’s low at 1.3248 would need to be broken.
Note, keep an eye on EURGBP (downtrend), and the tug-of-war between a lagging EURUSD and a firmer GBPUSD
September 24, 2024 at 9:35 am #11997EURUSD 4 HOUR CHART
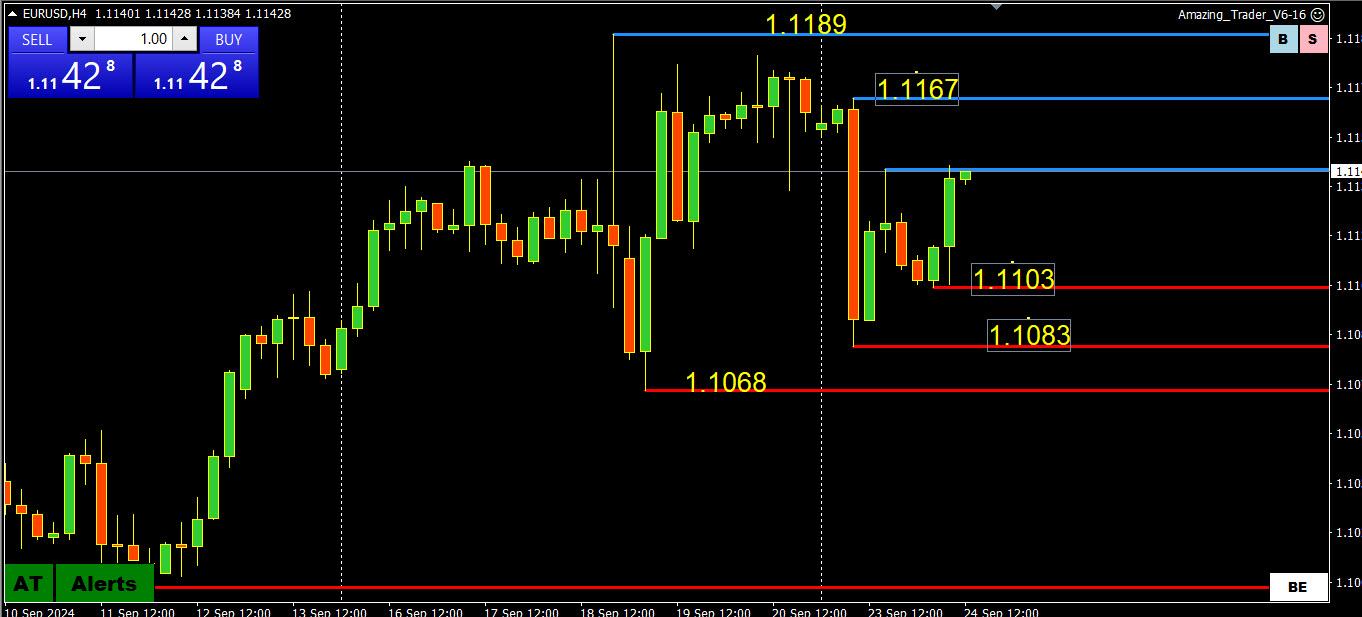
Is the glass half full or half empty?
1) Failed to test its 1.1201 key high
2) This followed a failure to test 1.10
3) If range is 1.10-1.12 until broken, then 1.11 remains its bias setting level
4) On the other side, while with 1.11-1.12, 1.1150 is clearly pivotal as well for day trading
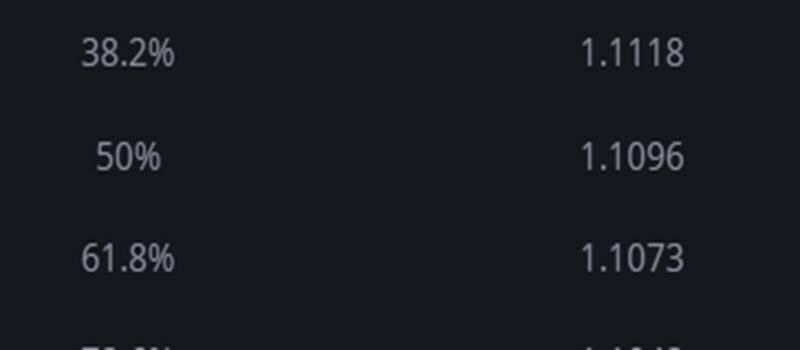
5) Using 1.1002-1.1189, using our Fibonacci Calculator, Monday’s low (1.1083) paused above the 61.8% level
 September 24, 2024 at 9:19 am #11996
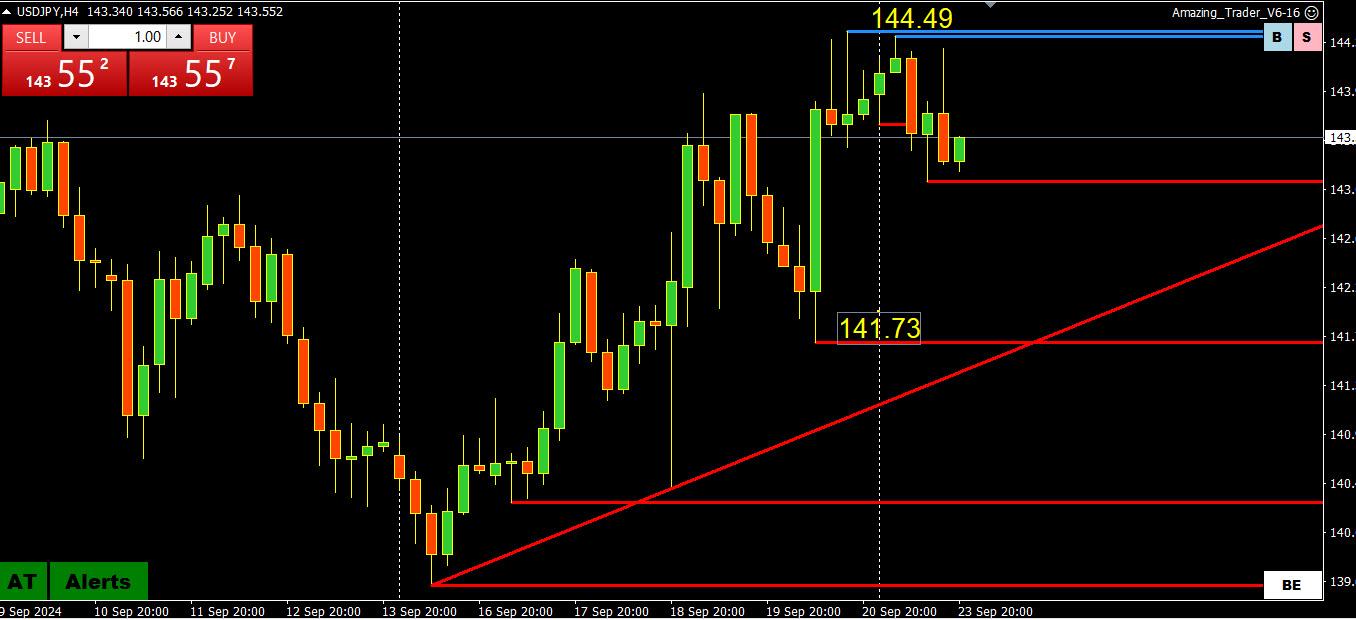
USDJPY 4 HOUR CHART – WATCH THE MOVING AVERAGE BAND
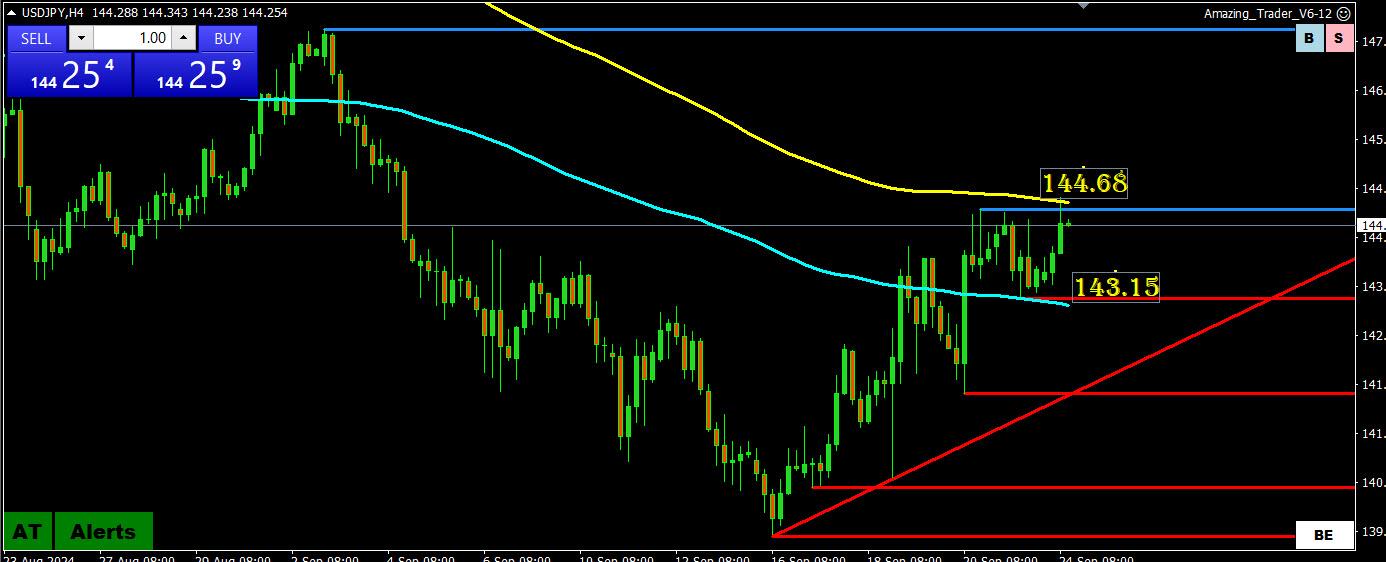
Trading within the moving average band bounded by the 200 4 hour (yellow) on top and 4 hour 100 4 hour (blue) on the bottom, both still sloping down.
On the other side, technicals are tilting positive (rising red AT lines) but only a solid move above 144.50 ( high today 144,68) would suggest more scope to this retracement.
September 24, 2024 at 7:15 am #11995A look at the day ahead in European and global markets from Ankur Banerjee
Investors have long clamoured for China to unleash broad-based stimulus measures to help turn sentiment around, and while Tuesday’s measures are well short of a ‘big bazooka’ move, it may still be a step in the right direction.
Morning Bid: No bazooka, but China’s latest stimulus is a relief
September 24, 2024 at 6:40 am #11994September 23, 2024 at 10:44 pm #11993September 23, 2024 at 9:45 pm #11992In our blog
Trading USDJPY lately Is like digging out from an earthquake. The tremors have stopped, damage has been done and the question is what comes next.
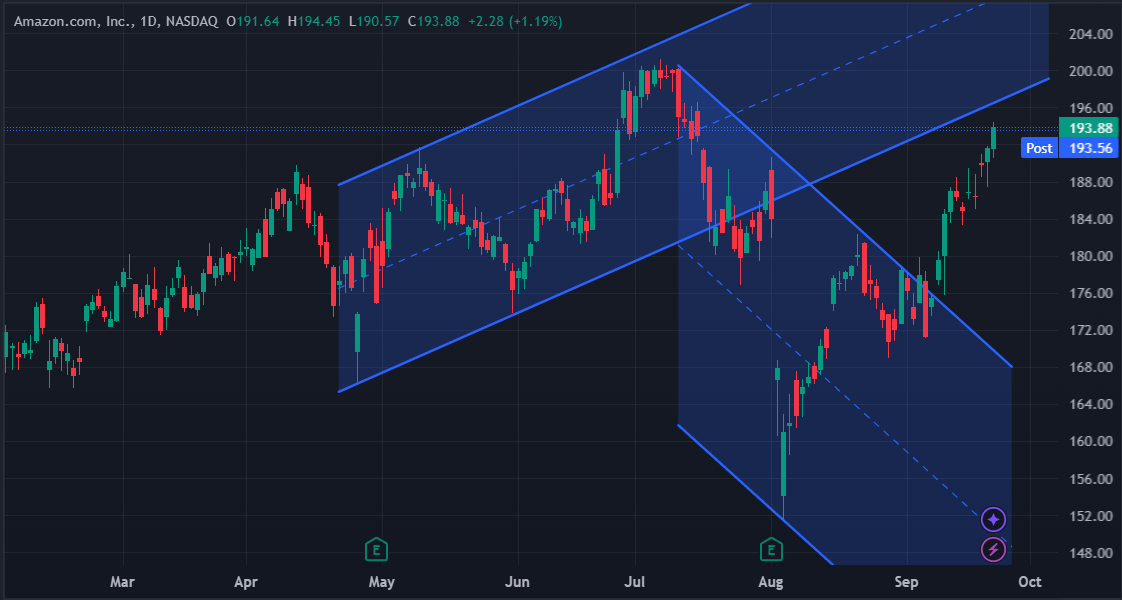
September 23, 2024 at 9:08 pm #11991Amazon – AMZN
Amazon’s Amazon Web Services Unit Expands Partnership With SLB
AMZN+1.19% SLB+1.16%
Amazon’s AMZN Amazon Web Services unit said Monday that it extended its partnership with SLB SLB to expand access to applications from SLB’s Delfi digital platform and explore low carbon technologies’ deployment for the energy industry.
The extended partnership will also enable energy data insights from Amazon Web Services to offer compatibility with SLB’s recently launched Lumi data and artificial intelligence platform, according to the statement.
 September 23, 2024 at 9:00 pm #11990
Nvidia – NVDA
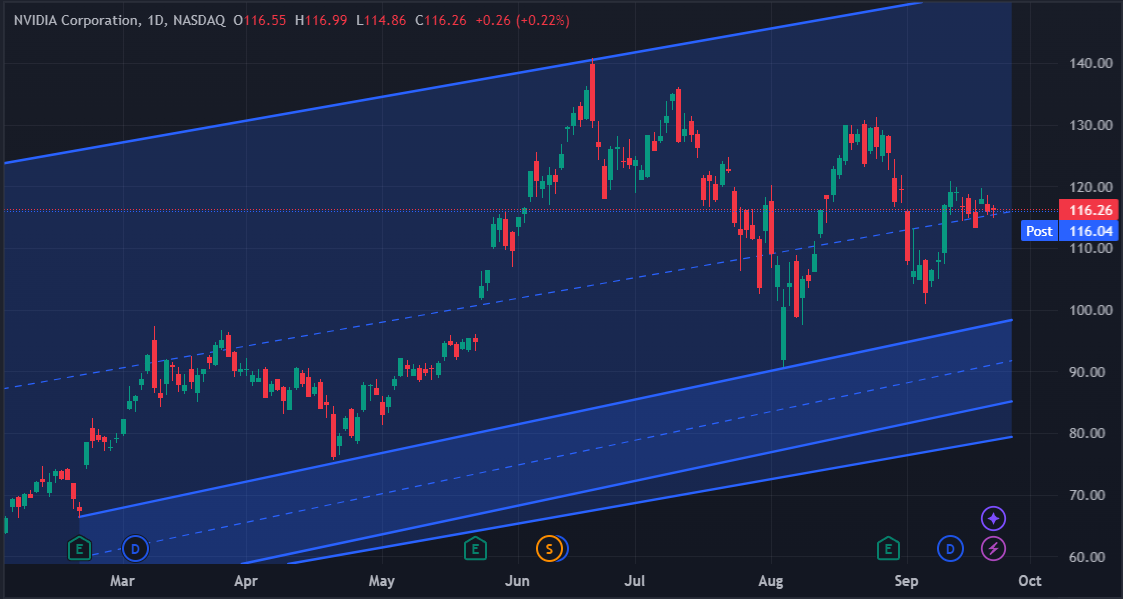
Nvidia Stock Treads Water but Analysts Keep Raising Their Price Targets
Nvidia Inc (NVDA) stock has been treading water since releasing excellent earnings on Aug. 28, three weeks ago. However, analysts keep raising their price targets. This makes shorting out-of-the-money (OTM)put options a superb strategy.The reason is that the market appreciates the powerful free cash flow (FCF) that Nvidia is gushing forth on a massive scale. As a result, price targets for NVDA stock are now over 25% higher than the stock price.
 September 23, 2024 at 8:55 pm #11989
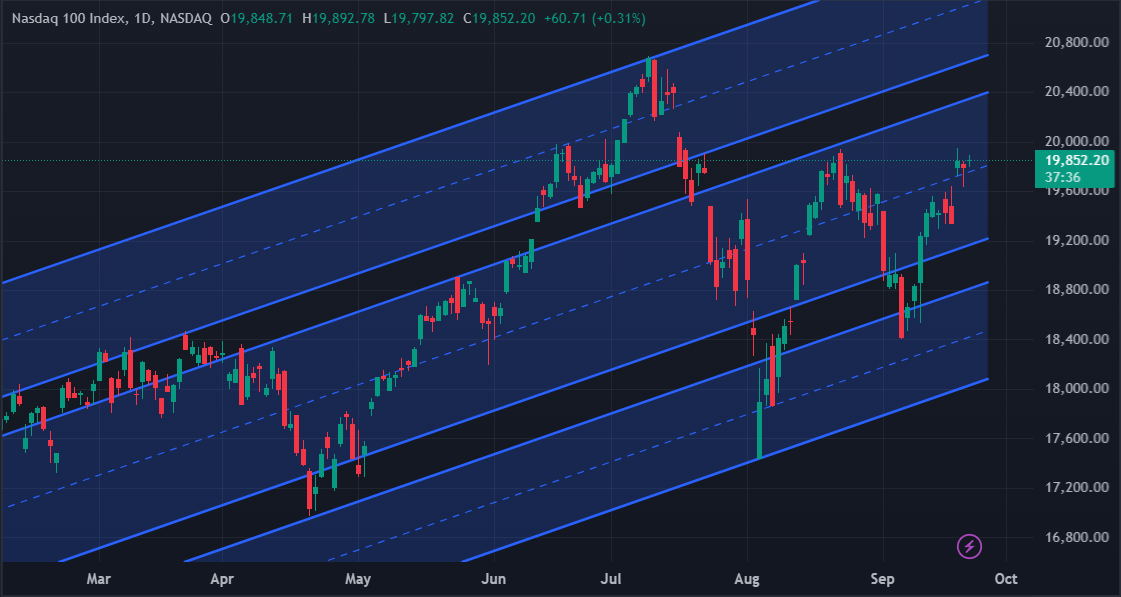
Nasdaq 100 – NDX
Wall St ends slightly higher after Fed policymakers back rate cuts
Survey: US business activity steady in September
Intel gains on report of Apollo’s investment offer
GM slips after Bernstein downgrades stock
Indexes up: Dow 0.15%; S&P 500 0.28%; Nasdaq 0.14%
Fed officials including Raphael Bostic, Neel Kashkari and Austan Goolsbee supported the central bank’s last rate cut and voiced support for more cuts in the rest of the year.
 September 23, 2024 at 7:20 pm #11981September 23, 2024 at 7:03 pm #11980
DX 100.90 is a value point which has been visited repeatedly going back a bit as a value magnet of sorts. Momentum for the buy or sell side has been set there numerous times after market participation in the various currencies does its thing. I have been keying off of that value area for a while now and making handsome trades doing so. Food for thought.
September 23, 2024 at 6:47 pm #11979US500 4 HOUR CHART – TAKING A BREATHER
Note that CFD price feeds can differ between broker, even those using the same symbol. Ss, look at the chart pattern if the levels below do not line up with the prices on your chart.
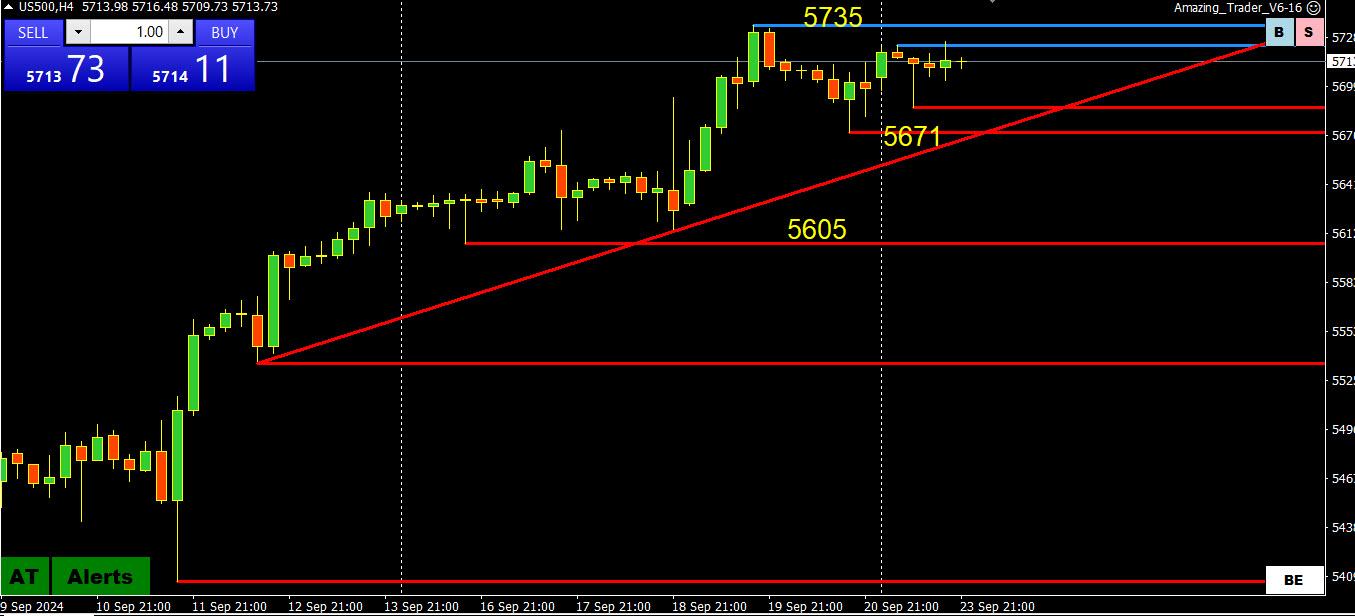
Remains in record high territory but taking a breather.
This suggests perhaps we see some consolidation unless a new (record) high is set.
Supports 5686, 5671, 5605
Resistance, 5723, 5735, ?
September 23, 2024 at 6:42 pm #11978XAUUSD 4 HOUR CHART – Unchartered territory
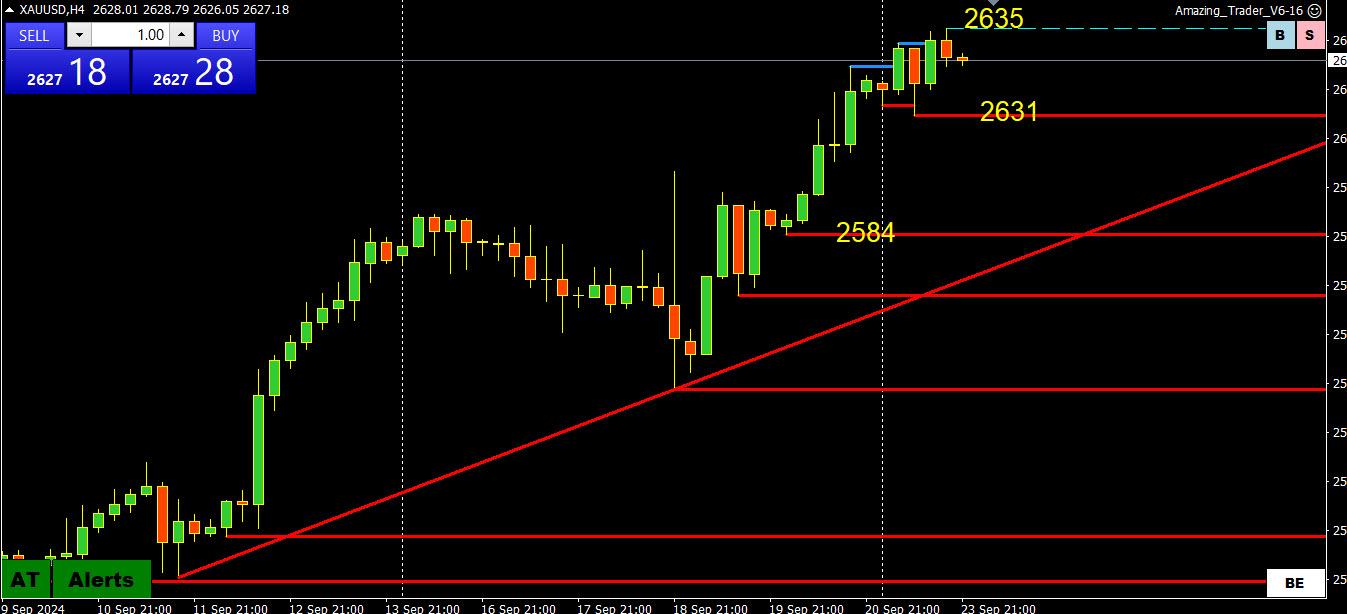
When in unchartered record territory, resistance is only a guess so use the latest high as the only level that matters,
On the downside, a move back below 2600 would be needed, at a minimum, to cool the risk.
As anyone trading knows, nothing goes up forever.
With that said, as I have been repeating, there is no reason to guess at a top until charts (in my case The Amazing Trader) tells you to do so.
September 23, 2024 at 6:40 pm #11977BTC 4 HOUR CHART – GLASS HALF FULL OR EMPTY?
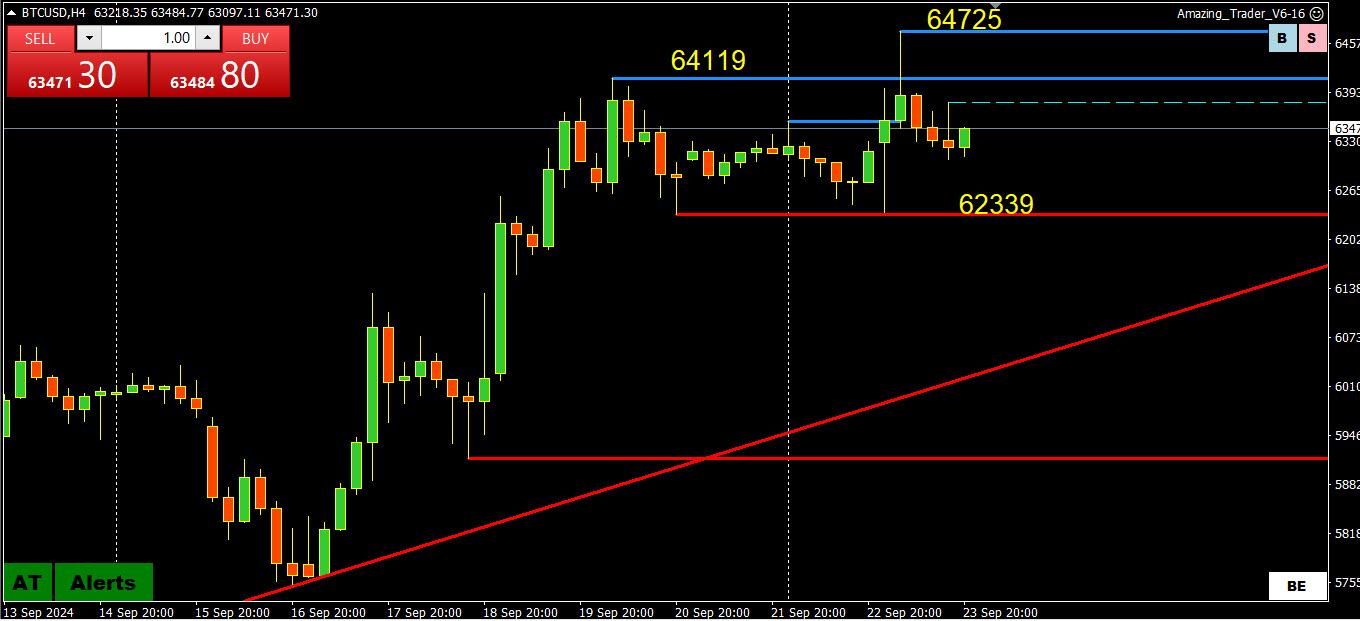
Those trading BTC are likely frustrated watching GOLD trade to new record highs while this crypto strugglres to build momentum..
While technicals are tilted more to the upside, to suggest a shift in target to 70K it would have to solidly take out 65-66k
Otherwise, expect more chop while it stays within 60-65K.
September 23, 2024 at 6:34 pm #11976September 23, 2024 at 4:51 pm #11975September 23, 2024 at 3:55 pm #11974 -
AuthorPosts
- You must be logged in to reply to this topic.
© 2024 Global View

