- This topic has 11,679 replies, 48 voices, and was last updated 3 months ago by GVI Forex 2.
-
AuthorPosts
-
September 27, 2024 at 1:16 pm #12161September 27, 2024 at 1:13 pm #12157
The primary reason UsdJpy and other Yen related pairs jumped off of a cliff is because the new leader of Japan chosen just last night, Shigeru Ishiba, is strongly in favor of a stronger Yen. He is also in favor of a stronger military, which if you have any common sense is a good idea considering the highly dangerous global conditions at present and looking outward.
September 27, 2024 at 12:52 pm #12148September 27, 2024 at 12:48 pm #12147September 27, 2024 at 12:36 pm #12146September 27, 2024 at 10:49 am #12144September 27, 2024 at 10:47 am #12143A look at the day ahead in U.S. and global markets from Mike Dolan
U.S. stocks surf new records as the last full week of the quarter comes to a close, with China’s furious monetary easing accelerating the rebound there and Wall Street eyeing the release of the Fed’s favored inflation gauge.
After a barrage of interest rate cuts, real estate props and stock market supports this week, China’s central bank cut its one-week reverse repo rate by another 20 basis points on Friday – trying to get across what it likely sees as an alarming economic slowdown that may see it miss 2024 targets.
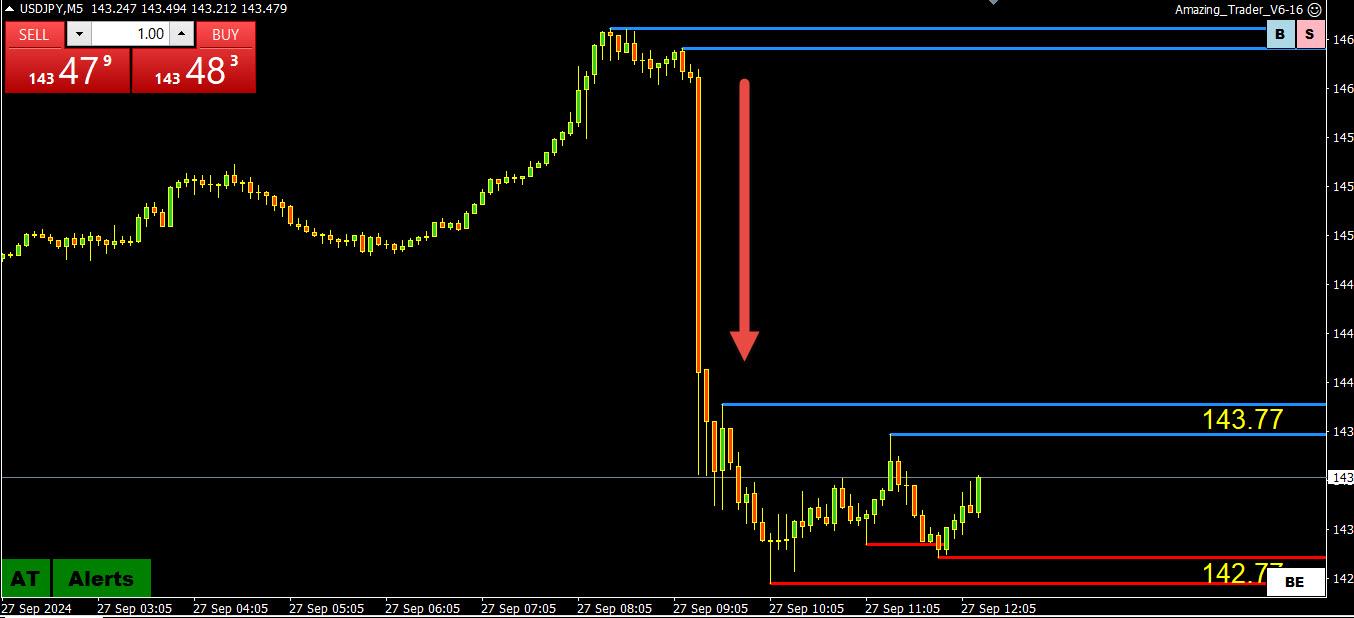
September 27, 2024 at 10:45 am #12141September 27, 2024 at 10:30 am #12140September 27, 2024 at 10:25 am #12139September 27, 2024 at 9:24 am #12138September 27, 2024 at 9:12 am #12137USDJPY 1 HOUR CHART – Up like an escalator, down like an elevator
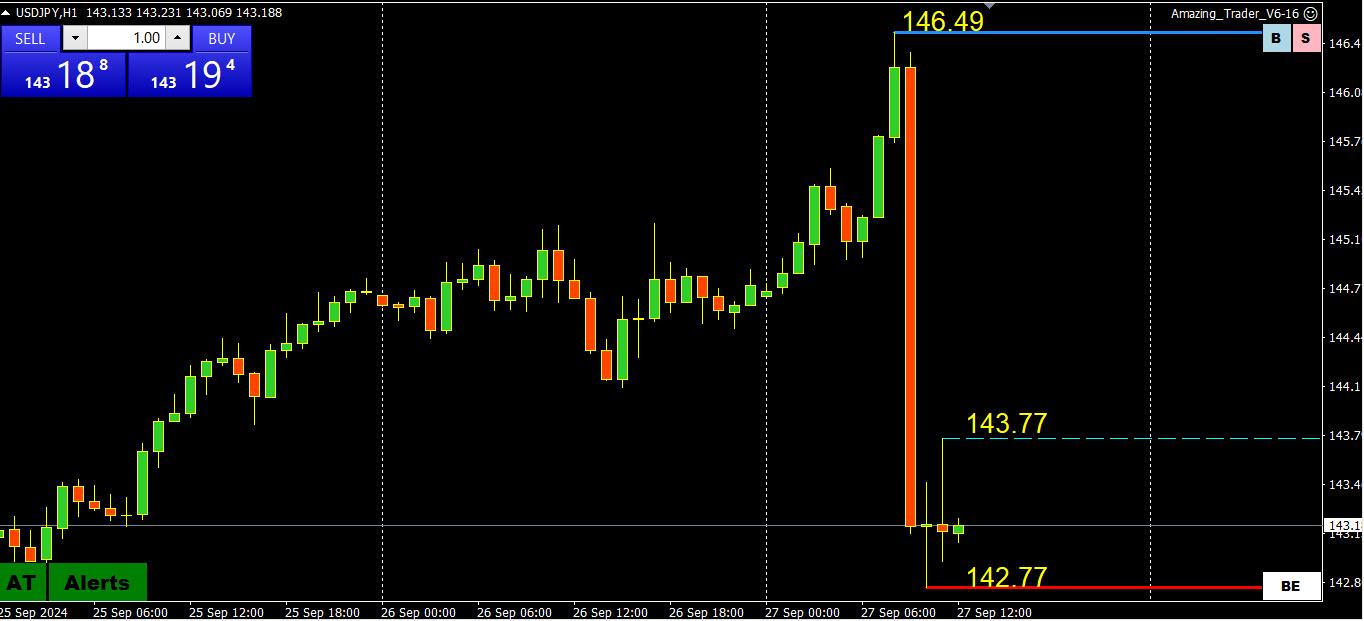
This is a classic example of a disorderly market so suspect the BoJ was in covertly to smooth the market,
Key support is at 141.73, a break would expose 140 and the low again,
On the upside, there is little until 146.49 (minor at 143.77) so use short-term charts if trading this currency.
September 27, 2024 at 8:53 am #12134September 27, 2024 at 7:08 am #12133September 26, 2024 at 10:39 pm #12132some good. some bad. some ehhh
Why ‘capital preservation’ could be your riskiest — and worst — strategy for retirement
overall something new (or a reminder) for everyone reading it
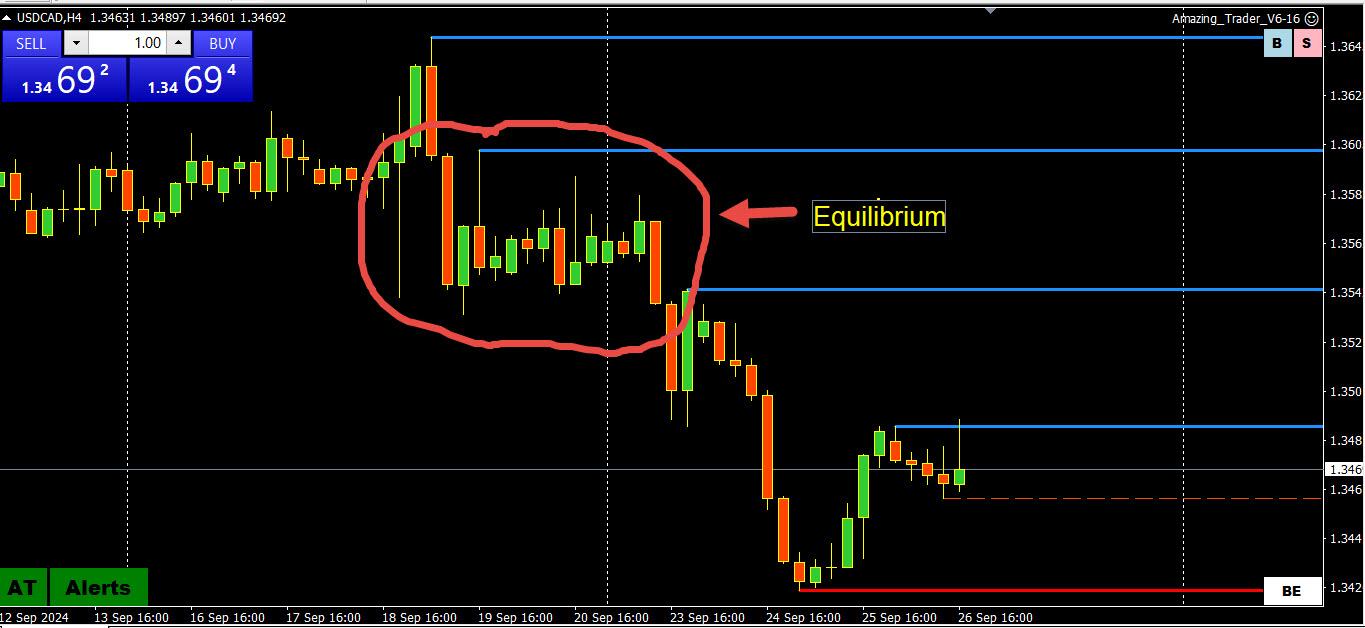
September 26, 2024 at 10:25 pm #12131Do you ever wonder why you turn on your screens and it is often hard to figure out which way the forex market will move as it appears to be in balance? Have you ever thought about why currencies settle into tight ranges with interest on both sides before making the next move? Have you noticed how a currency gets stuck in a tight range in one center and needs to see another center open up to break from that range? Well I have and can tell you the reason why.
September 26, 2024 at 8:53 pm #12130BTC DAILY CHART – Trying
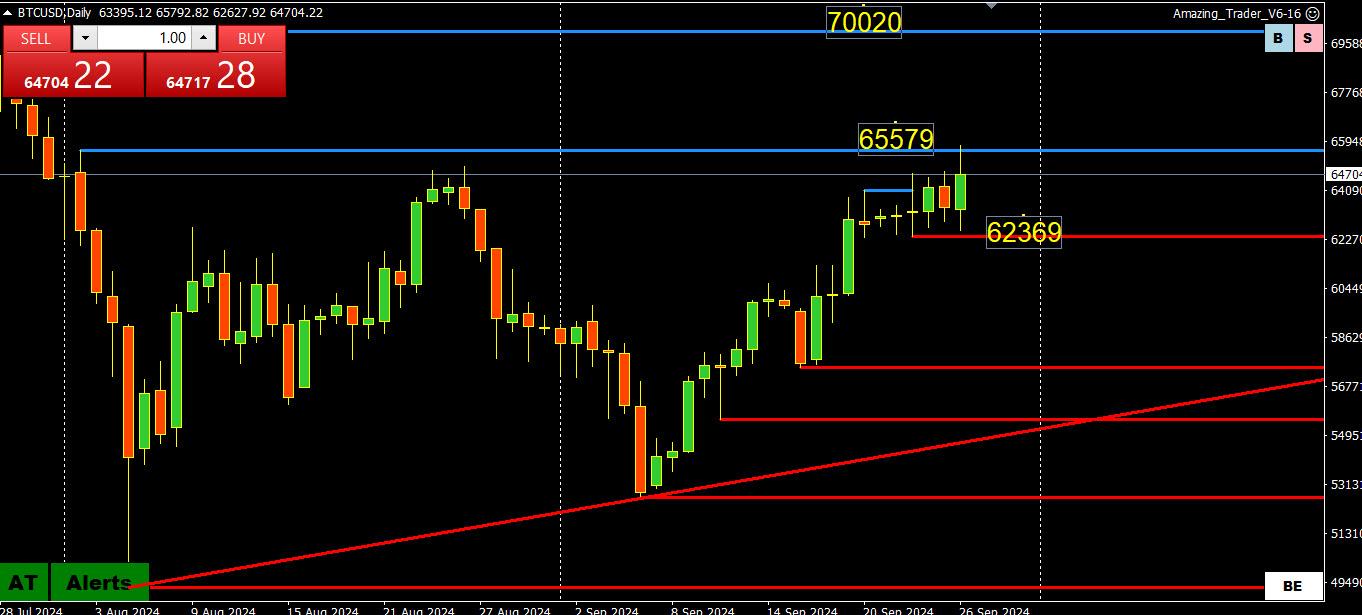
It still amazes me how Amazing Trader chart levels work on any instrument and in any time frame (see blue line – chart).
Meanwhile, BTC is trying to establish above 65K to setup a run at 70K but so far has failed to close above it.
Supports are clear at 62300-800 as only below it would deflect the risk from the upside.
September 26, 2024 at 7:40 pm #12129NAS100 4 HOUR CHART –
Similar to US500, NAS100 opened higher but then settled back
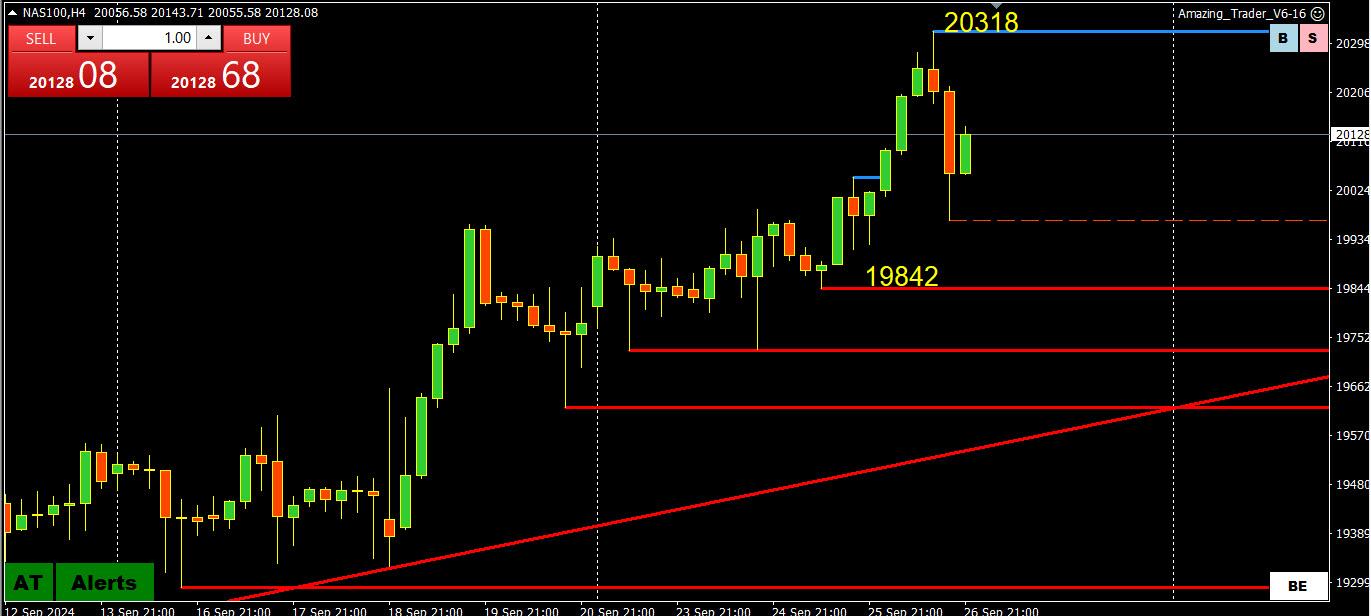 .
.Chart is clear: Needs to hold above 19842 to keep the risk on the record high at 20771 although 20000 is likely equally important in maintaining a bid.
Resistance starts at 20318, then 20593 ahead of the record 20771 level.
Note that CFD price feeds can differ between broker, even those using the same symbol. Ss, look at the chart pattern if the levels below do not line up with the prices on your chart.
September 26, 2024 at 7:38 pm #12128US500 4 HOUR CHART – New record high but…
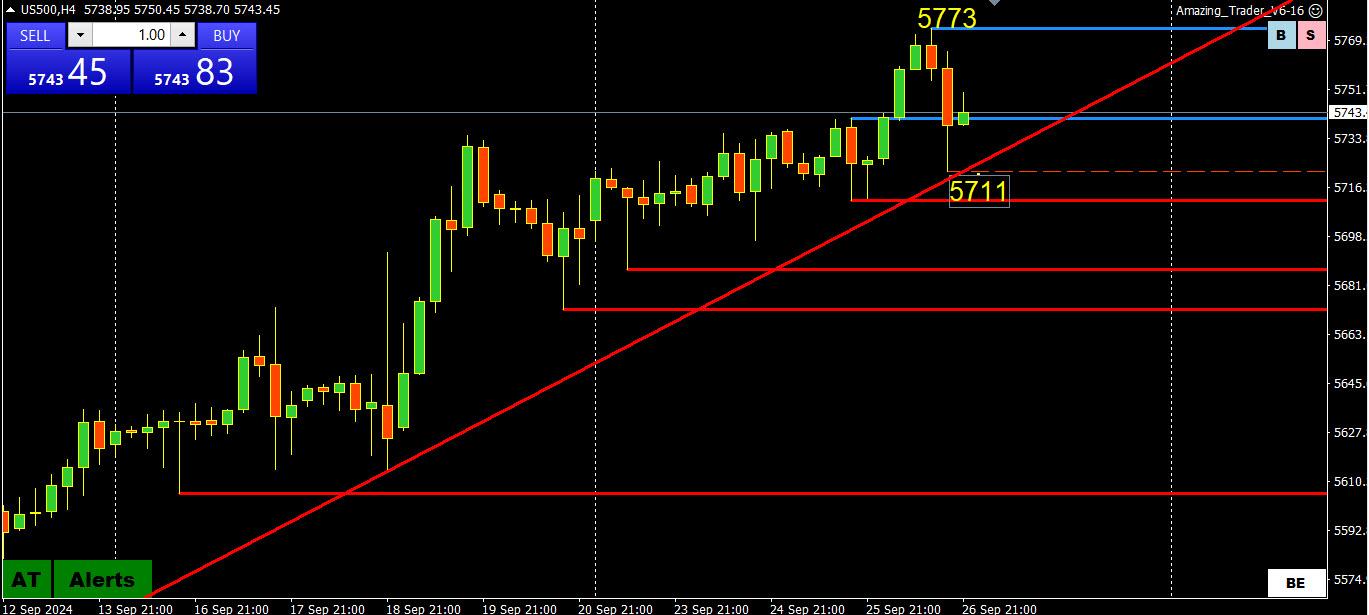
Opened at a new record high but then backed off into a range. This leaves the new high (5773) as the key resistance level,
Using this chart, US500 maintains a bid as long as it trade above 5711.
Note that CFD price feeds can differ between broker, even those using the same symbol. Ss, look at the chart pattern if the levels below do not line up with the prices on your chart.
September 26, 2024 at 7:00 pm #12127XAUUSD 4 HOUR CHART – No sign of a top yet
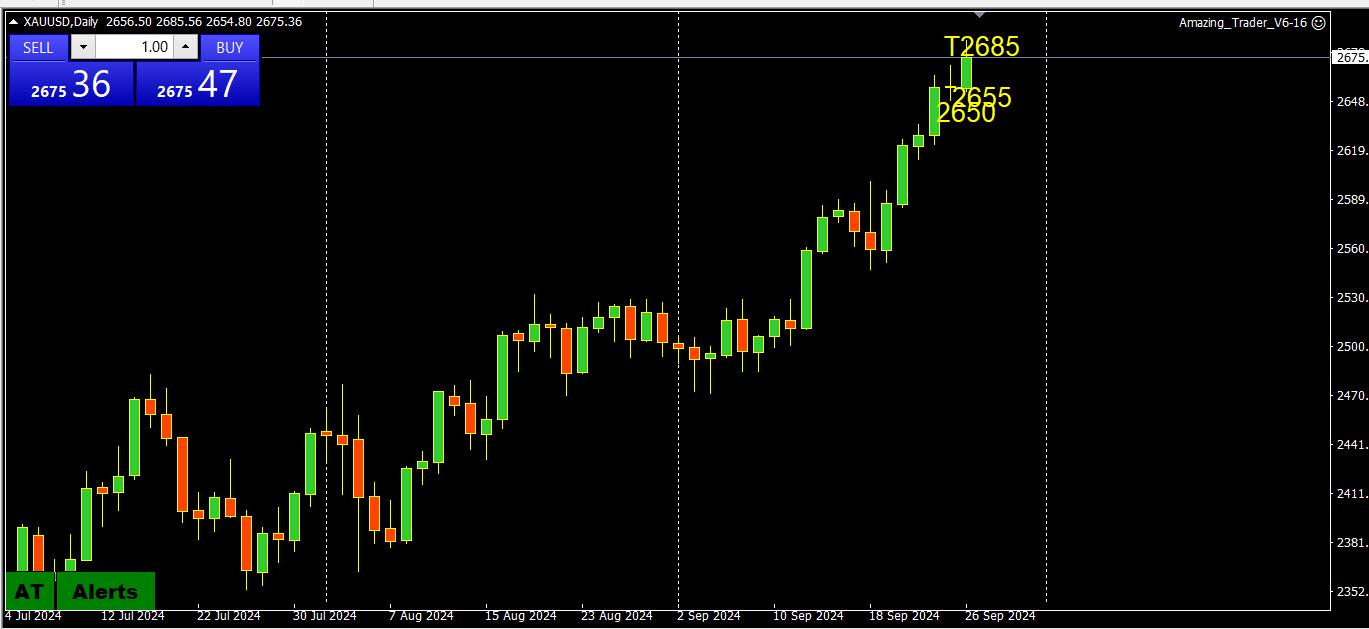

Still no sign of a top with another record high at 2685.
As I have been saying:
When in unchartered record territory, resistance is only a guess so use the latest record high as the only level that matters. In addition, with no real resistance, the big figure like 2700 would be a potential target/pause level.
Another way to suggest a pause would need a day without a new high.
Support is now from 2650-2670..
-
AuthorPosts
- You must be logged in to reply to this topic.
© 2024 Global View

