- This topic has 11,679 replies, 48 voices, and was last updated 3 months ago by GVI Forex 2.
-
AuthorPosts
-
October 2, 2024 at 12:53 pm #12387October 2, 2024 at 12:42 pm #12385
We have all said a lot about trading in geopolitical turmoil’s, but I would like to mention something that is directly causing a havoc within all those trading on Small time frames ( just like me J
No matter how good your system/strategy is, right now we have to rethink our entry and stop loss levels – every now and then we can see some “unnatural” spikes happening where they shouldn’t be.
In reality, your trade would be just fine if there wasn’t that silly spike….hitting your stop loss just for fun.
So what to do?? Well, idea of widening my stop is not something that I favour – so for me better solution is to move to a bit bigger time frame ( from let’s say 4min chart to 10 min chart, or even bigger) as those spikes would be more natural and easier to avoid.
Just my 10 cents worth….
October 2, 2024 at 12:31 pm #12384EURUSD
So far Support at 1.10500 held it’s ground, but looking at 4h chart the danger is still looming.
4H Chart
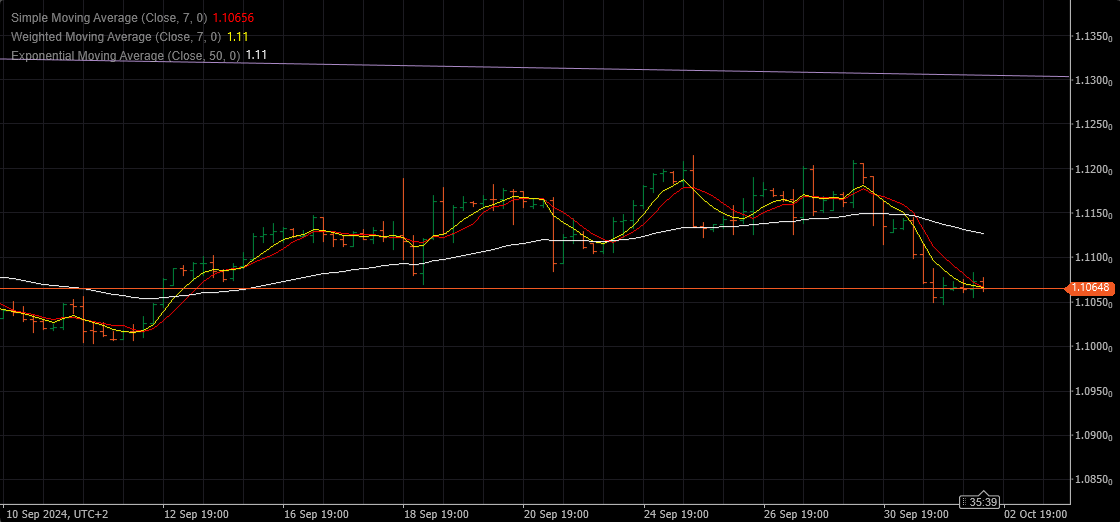
Close of this 4h bar ( in about 30 min) above 1.10700 would release the pressure for at least some time.
However, close below 1.10600 would signal yet another test of the previous low.
Daily Chart
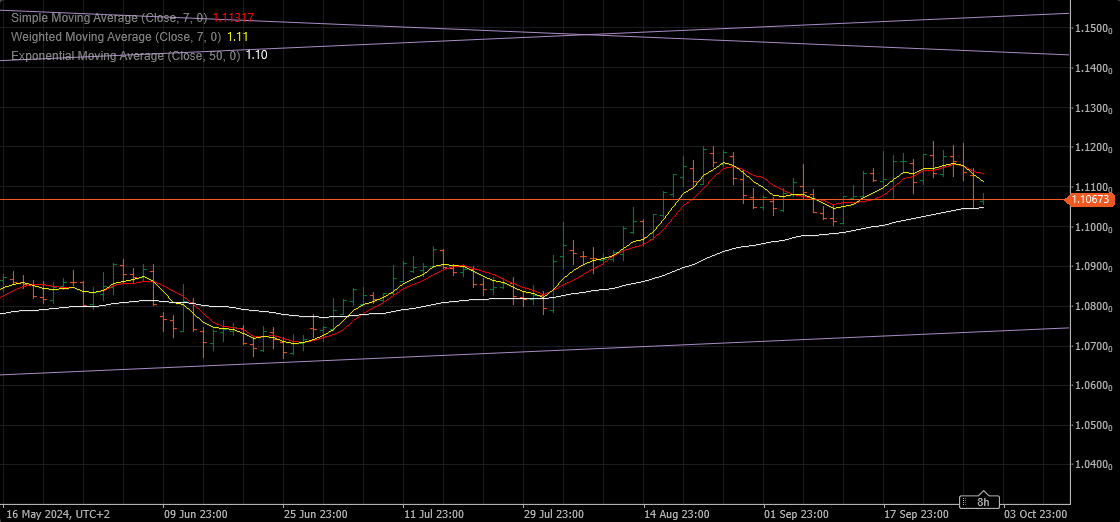
Based on the Daily chart we have the following :
Supports : 1.10500 , 1.10000 & 1.09500
Resistances : 1.10850 , 1.11150 & 1.11450
October 2, 2024 at 10:54 am #12382A look at the day ahead in U.S. and global markets from Mike Dolan
With Middle East tensions dialing back up, U.S. port workers on strike and global industry under the cosh, the final quarter of 2024 promises to be a bit edgier for world markets than the relatively serene first nine months.
The fourth quarter was barely underway on Tuesday when 12 months of intense conflict in Gaza and Lebanon spilled over again into another direct standoff between Israel and Iran – jarring recently listless energy markets and provoking some limited hedging of risk assets.
October 2, 2024 at 10:45 am #12381ALERT
USDJPY spikes up on this
Japan’s PM Ishiba says “we are not in the environment for an additional rate hike.”… Newsquawk.com
October 2, 2024 at 10:41 am #12380US500 4 HOUR CHART – Retracement or more?
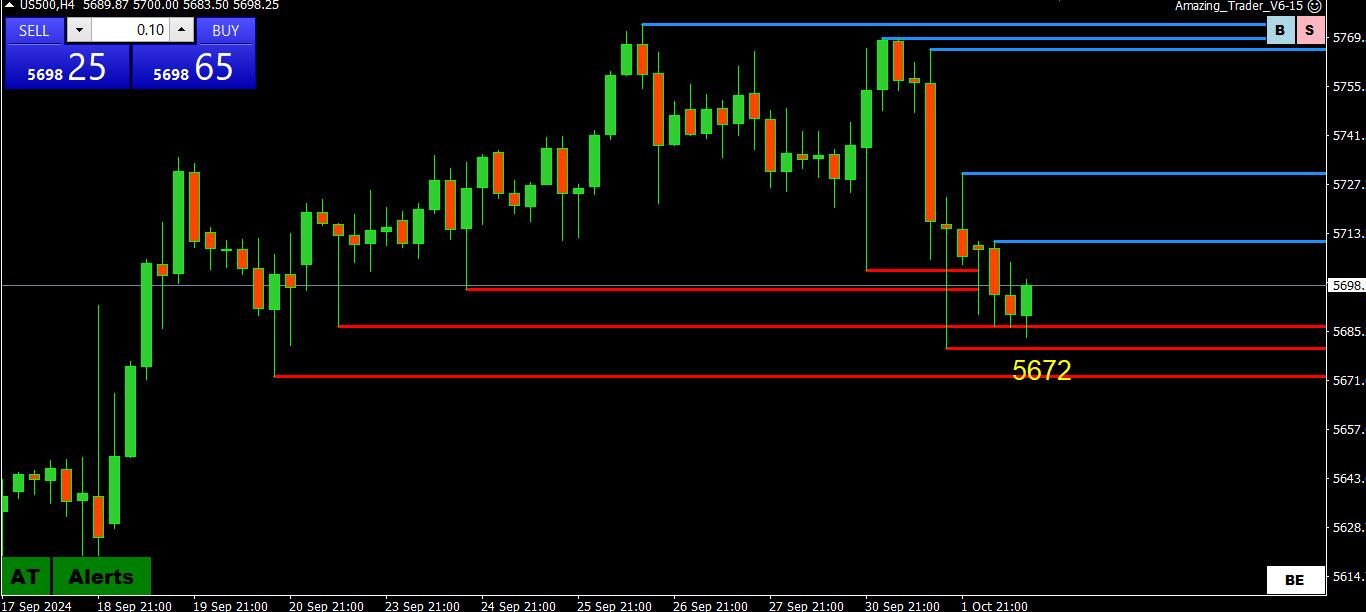
Backing off from its record high and needs to re-establish above 5700 to ease a retracement risk,
Stocks weighing hooes for a sift landing vs. geopolitical risks, election uncertainty and Powell indicating a less aggressive Fed
WSJ: BOE Warns of Sharp Correction as Geopolitical Worries Mount
The BOE’s Financial Policy Committee has repeatedly warned that valuations of many financial assets, particularly equities, are “stretched”
October 2, 2024 at 10:08 am #12379This is worth repeating from How Should You Trade in a Geopolitical Marketl
A “geopolitical market” needs a continuous flow of news to keep risk elevated.
October 2, 2024 at 10:00 am #12378October 2, 2024 at 9:55 am #12377I posted this article a few months ago and in it is a primer on trading in a geopolitical market. It is worth reading along with the latest article (scroll below)’
”
How to Trade in a Geopolitical MarketOctober 2, 2024 at 9:48 am #12376October 2, 2024 at 9:28 am #12375EURUSD 4 HOUR CHART – ON THE DEFENSIVE
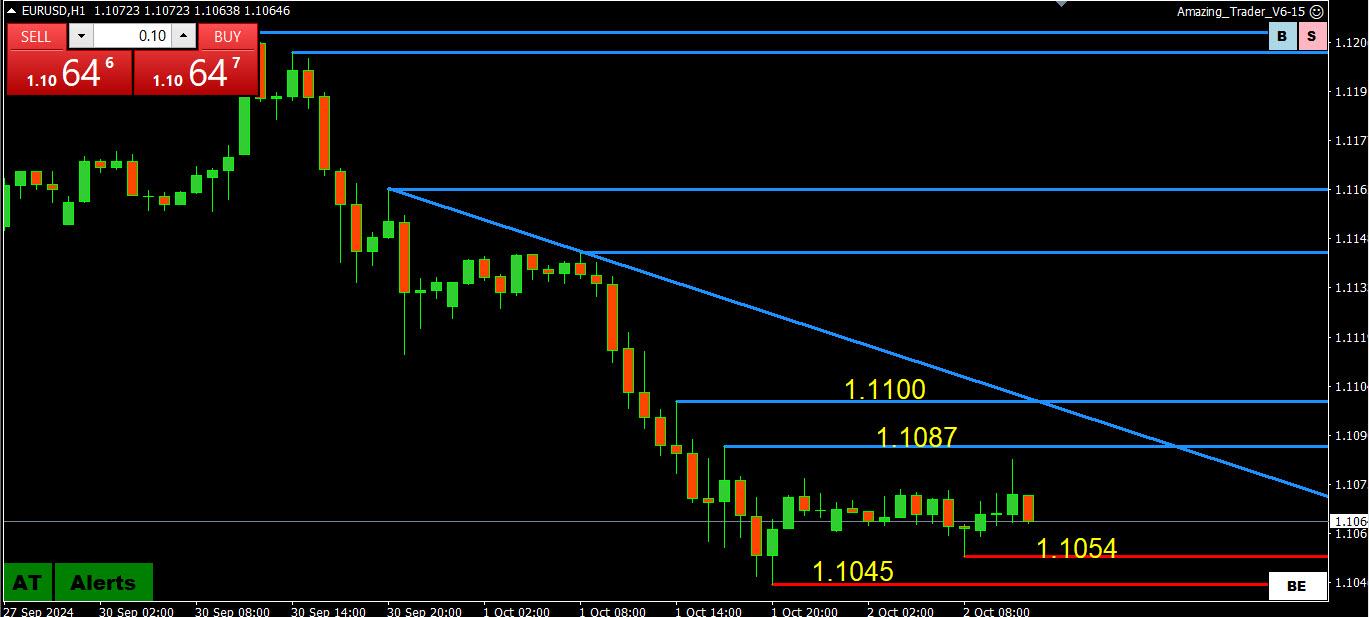
EURUSD wa already on the defensive before the Iran attack and will remain that way as long as it trades below 1.11.
On the downside, a firm break of 1.1056-50 would be needed to put the key 1.1000-05 bottom of the 1.10-1.12 range in play.
Note on Geopolitics: with the Jewish New Year starting Wednesday night, the risk of retaliation would seem to be more over/after the weekend than prior to it.
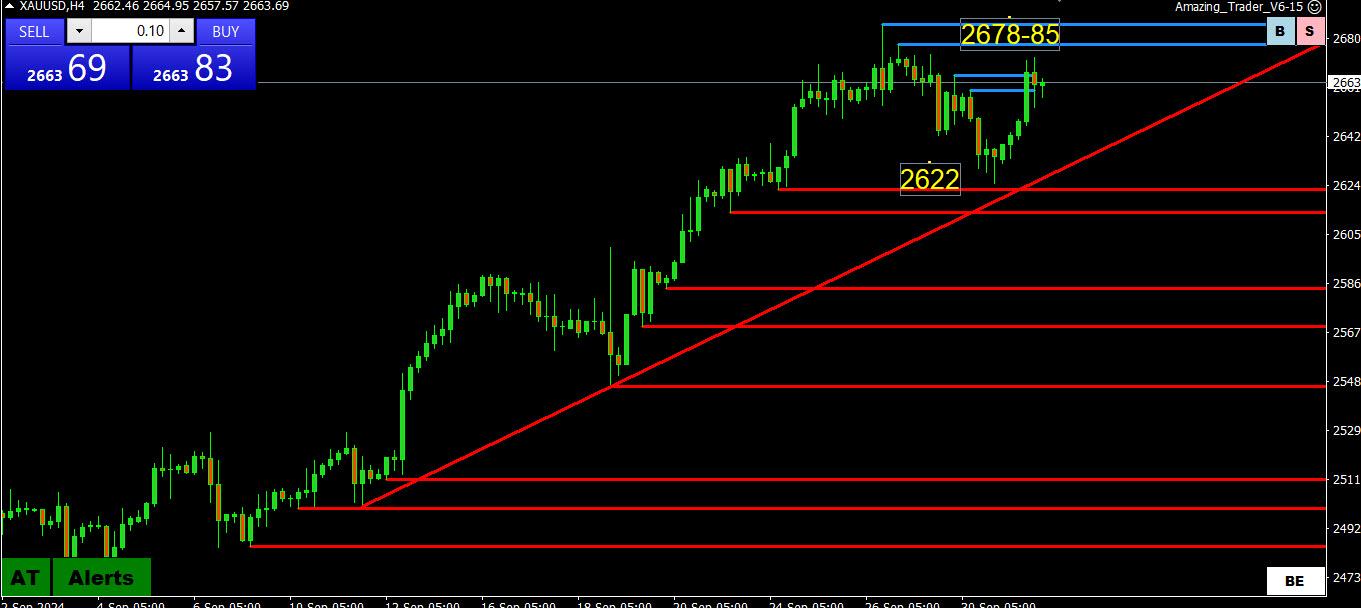
October 2, 2024 at 9:19 am #12374XAUUSD 4 HIOUR CHART – MAGNETIC 2650
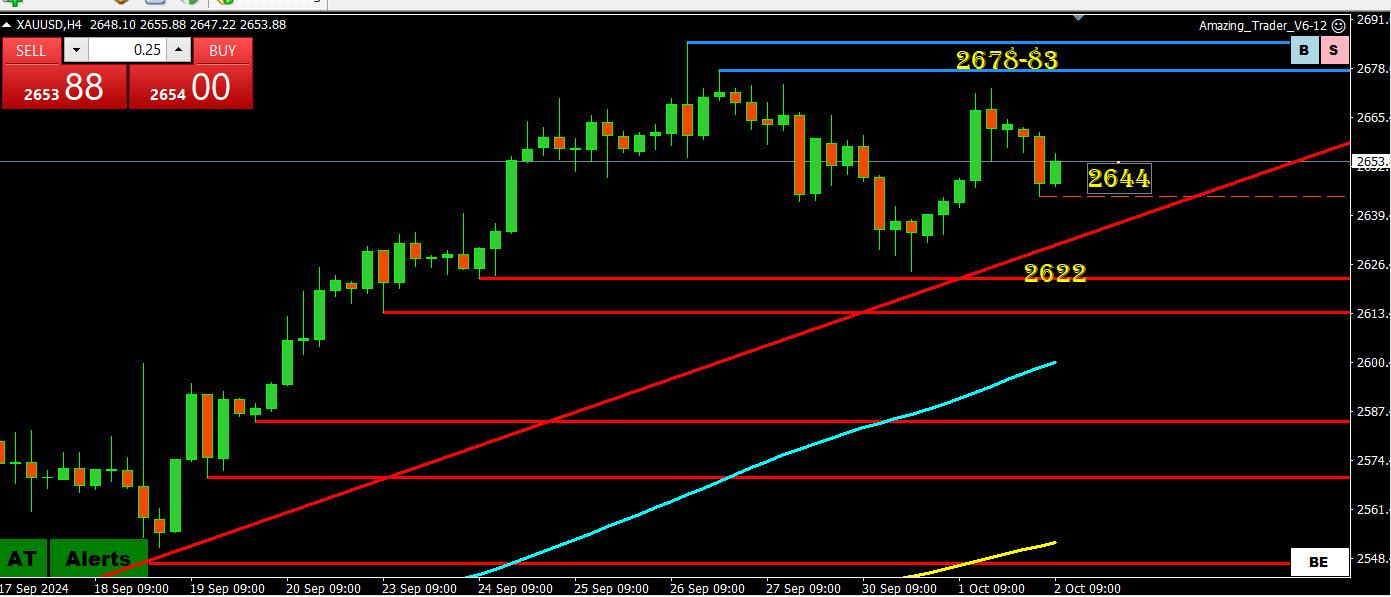
No change to what I posted yesterday as markets wait for the next move by Israel
Geopolitical tensions/safe haven flows cut short thoughts of a retracement so let’s keep it simple.
Record high is 2683 but if you assume range is 2600-2700m then look for 2650 to set the trading bias.
October 2, 2024 at 9:11 am #12373USDJPY 4 HOUR CHART – SAFE HAVEN?
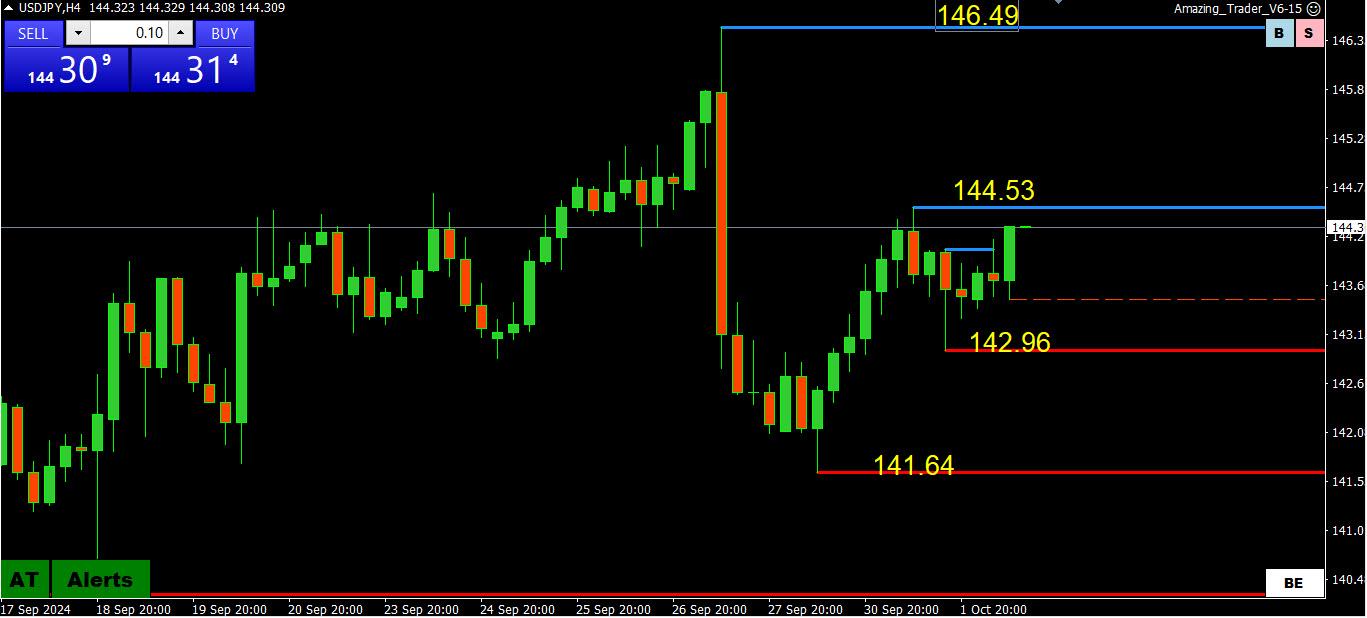
With safe haven JPY buying failing to follow through (low 142.96), USDJPY focus is on 144.50-55, which would need to be broken to shift the focus to 145.
Only above 145 would put the 146.49 high on the radar.
Otherwise, range would be 142/143-145.
Note comments from the BoJ Governor expressing caution on hiking rates seemed to be a factor.
October 1, 2024 at 11:30 pm #12369October 1, 2024 at 9:57 pm #12367October 1, 2024 at 9:42 pm #12366Brent Crude Oil / WTI
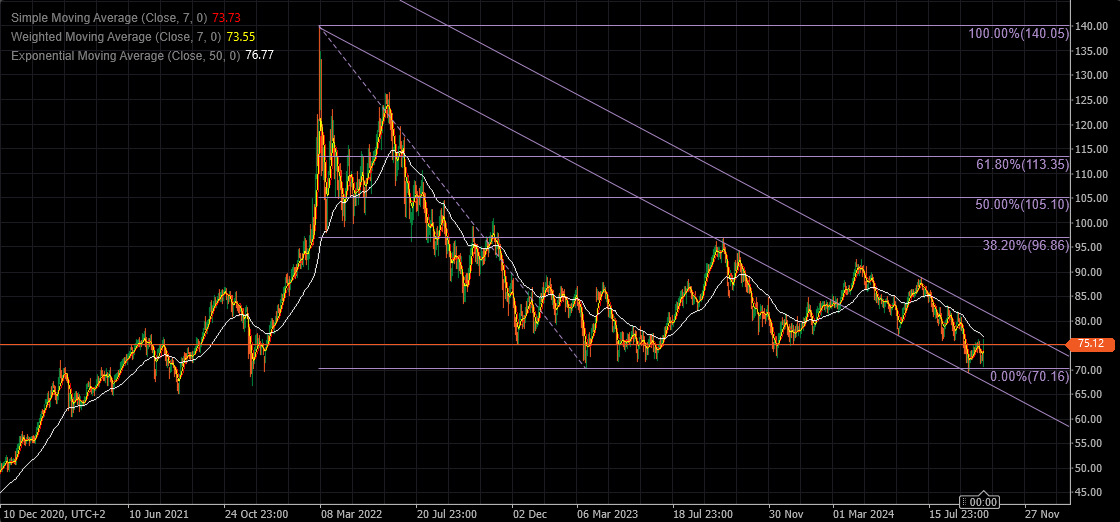
Update: WTI Crude Oil Closes Higher as Iranian Missile Strike on Israel Threatens a Spreading War
West Texas Intermediate (WTI) crude oil rose on Tuesday on rising geopolitical risks after Iran launched a missile strike on Israel to avenge the killing of Hassan Nasrallah, the head of Hamas, and other senior leaders of the militant group.WTI crude oil for November delivery closed up US$1.66 to settle at US$69.83 per barrel, while December Brent crude, the global benchmark, was last seen up US$1.96 to US$73.66.
Iran launched an estimated 200 missiles at Israel, according to the Guardian, threatening to spread war to the oil-rich Persian Gulf. An Israeli military spokesman said the country will retaliate against Iran as some missile hit their targets in the country.
 October 1, 2024 at 9:21 pm #12364
Tesla – TSLA
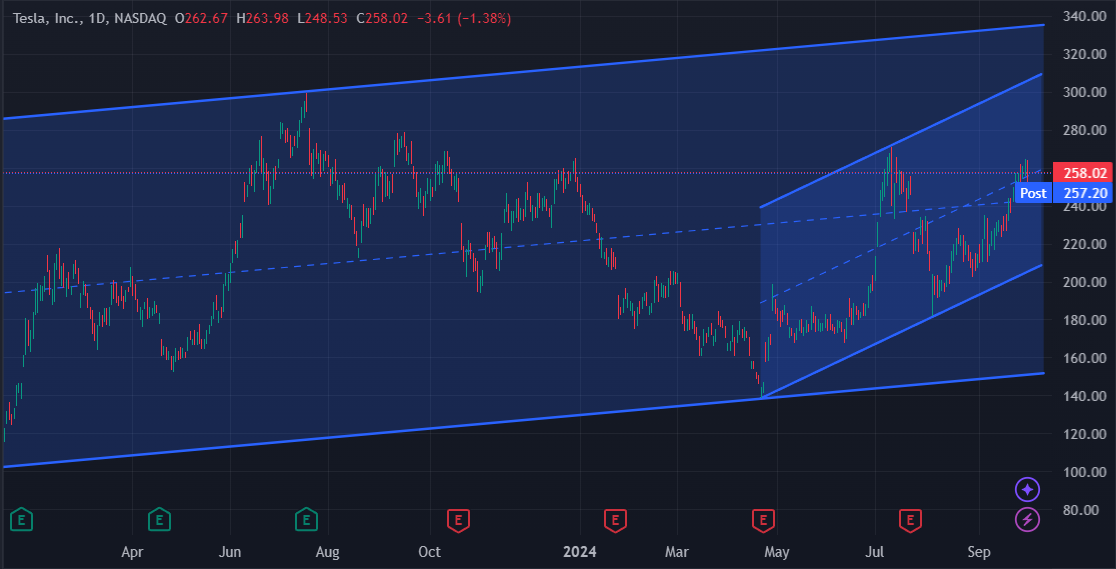
Tesla Stock Speeds Ahead Of Mag7 Peers, Can October’s Robotaxi Reveal Keep The Momentum?
Tesla Inc TSLA stock revved up in September, soaring over 24% and leaving its Magnificent Seven peers in the dust.Year-to-date gains for the car manufacturer stock are a modest 5.32%. Still, Tesla’s recent surge outpaces rivals like Nvidia Corp NVDA and Amazon.com Inc AMZN by a wide margin.
The question now: Can Tesla sustain this rally, or is it running out of gas?
The upcoming Robotaxi event, scheduled for Oct. 10 in Los Angeles, is also fueling investor optimism. CEO Elon Musk has hyped this event as potentially Tesla’s most significant moment since the Model 3 launch, and Wall Street bulls like Dan Ives and Adam Jonas expect key updates on FSD and autonomous driving.
 October 1, 2024 at 9:13 pm #12363
Nvidia – NVDA
Nvidia Stock Slips to Start a Crucial Quarter. What’s at Stake ?
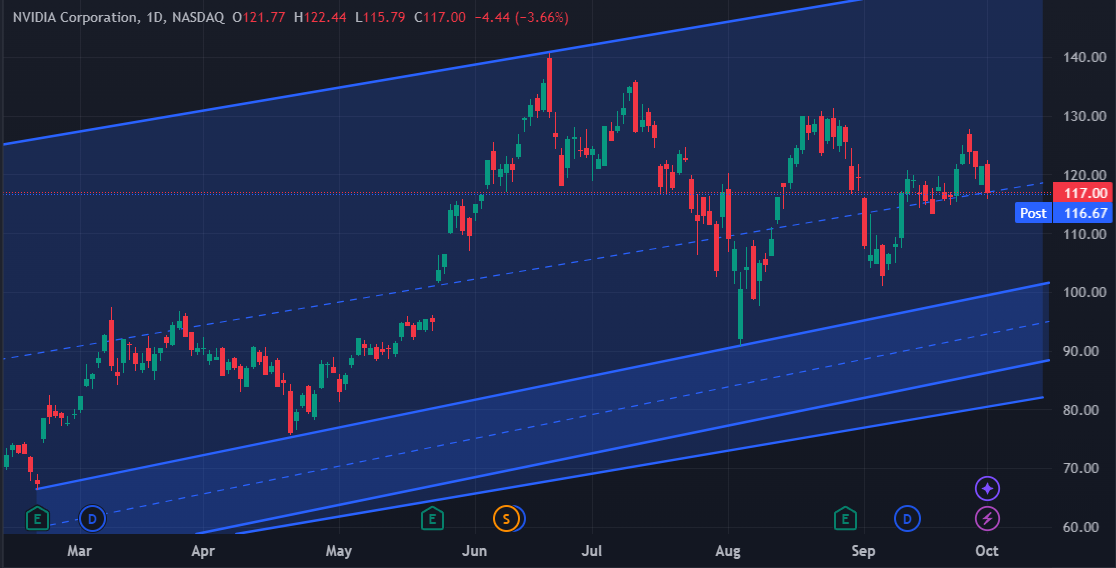
Nvidia stock slid Tuesday at the start of a crunch quarter for the chip company.
Shares fell 3.7% to close at $117.
The tech sector took a hit after Iran fired a barrage of missiles at Israel, escalating the conflict in the Middle East. Investors flocked to safer areas of the market, and the Nasdaq Composite dropped over 1%.
Nvidia has climbed 136% in 2024, powering the company’s market capitalization to nearly $3 trillion and cementing its status as an artificial-intelligence bellwether.
The fourth quarter is likely to be crucial for growth, given the chip designer is expected to ramp up production of its new Blackwell graphics processing units. It has said it expects the GPUs to drive “several billion dollars” worth of sales.
 October 1, 2024 at 9:01 pm #12362
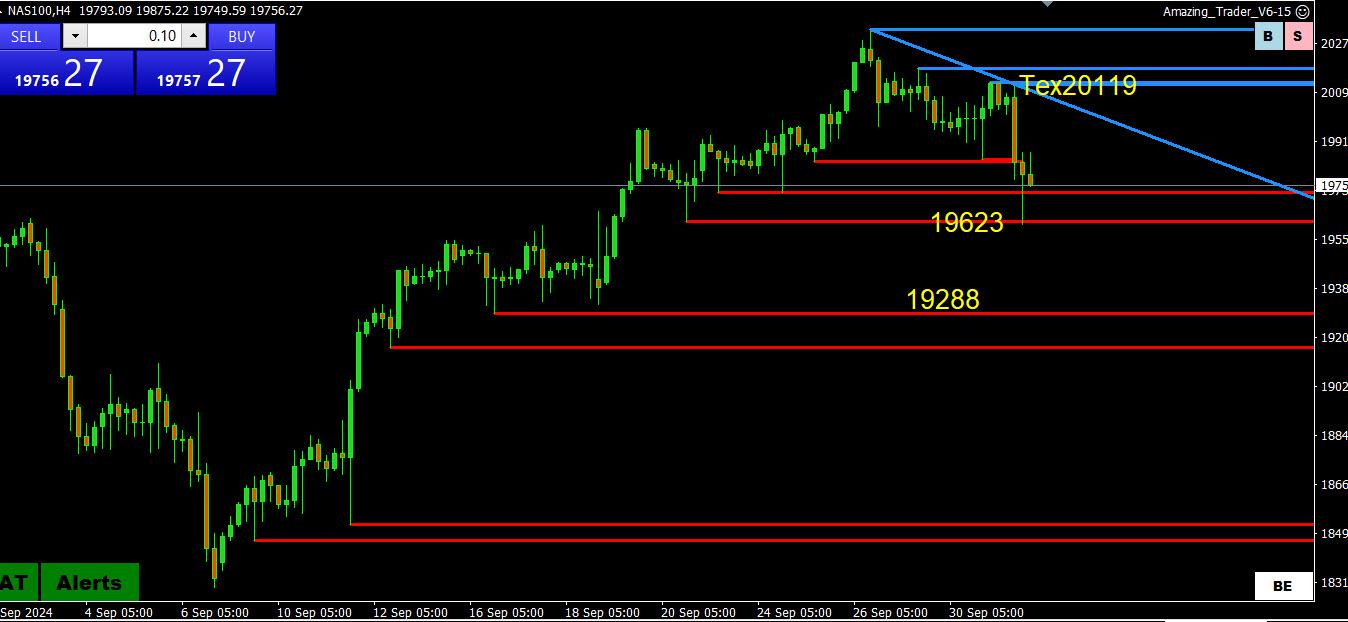
NAS100 4 HOUR CHART – Sub-20K
‘
In a geopolitical market do technicals matter?Looking at this chart, note how 19623 held
To keep it simple, some disappointment that it did not follow S&P and DOW to new record highs and needs to renew 20K to neutralize a retracement risk.
With geopolitics a focus, look at short-term charts and risk on/risk off to trade the NAS.
October 1, 2024 at 8:48 pm #12361AUDUSD 4 HOUR CHART – GEOPOLITICS
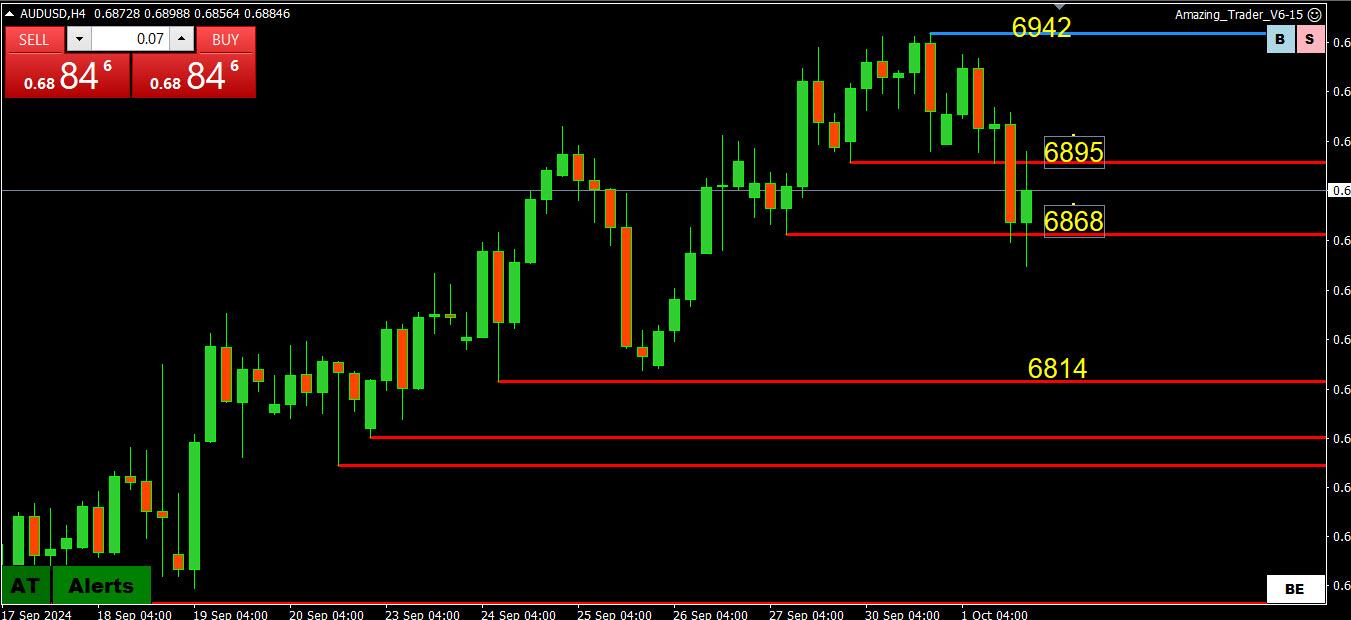
You saw the sensitivity to risk off in a market which will be keeping one eye on the headlines.
With the Jewish New Year starting Wednesday night, there is a very tight window for retaliation so there may be some breathing room for the rest of the week.
On the downside, .6850 blocks ;6800-15
On the upside, .6895 would need to be renewed to restore aa bid.
-
AuthorPosts
- You must be logged in to reply to this topic.
© 2024 Global View


