- This topic has 11,679 replies, 48 voices, and was last updated 4 months, 3 weeks ago by GVI Forex 2.
-
AuthorPosts
-
March 19, 2025 at 12:54 pm #21106March 19, 2025 at 12:07 pm #21105March 19, 2025 at 11:55 am #21103
US OPEN
USD firmer, EUR and GBP hit by JPY-action on Ueda’s press conference, US futures a touch firmer ahead of FOMC
Good morning USA traders, hope your day is off to a great start! Here are the top 5 things you need to know for today’s market.
5 Things You Need to Know
European bourses began the session on the backfoot with the risk tone dented as a few potential factors influenced, US futures modestly firmer pre-Fed
USD firmer, EUR and GBP hit by JPY-action on Ueda’s press conference; BoJ itself was as expected, Ueda began balanced but had some hawkish points in his presser
Fixed income initially benefited on the slip in the risk tone but has since eased off best with USTs now slightly softer into the FOMC
Crude remains pressured after Tuesday’s geopolitical developments while Gas has picked up as strikes on energy infrastructure seemingly continue
Ukraine’s Zelensky to speak with US’ Trump on Wednesday and hopes a ceasefire will eventually be implemented
March 19, 2025 at 11:15 am #21102USDJPY 4 HOUR CHART – Watch 150
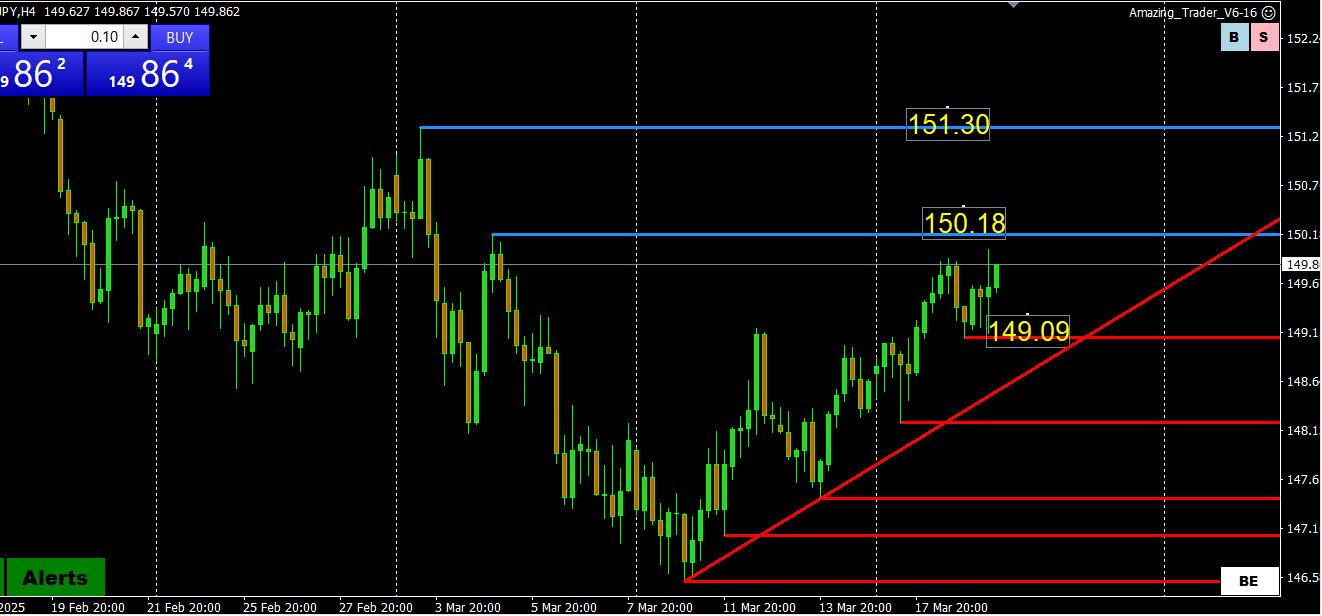
Chart showing an upside risk but would need to get through the pivotl/magic150 to expose…
…potential tough levels at 150.18 and 151.30… at risk while above 149.09
Otherwise, expect more chop ahead of the FOMC but only below 149.09 would negate the current risk on the upside
High so far today 150.02
March 19, 2025 at 10:32 am #21101EURUSD 15 MIN CHART – Watch 1.09
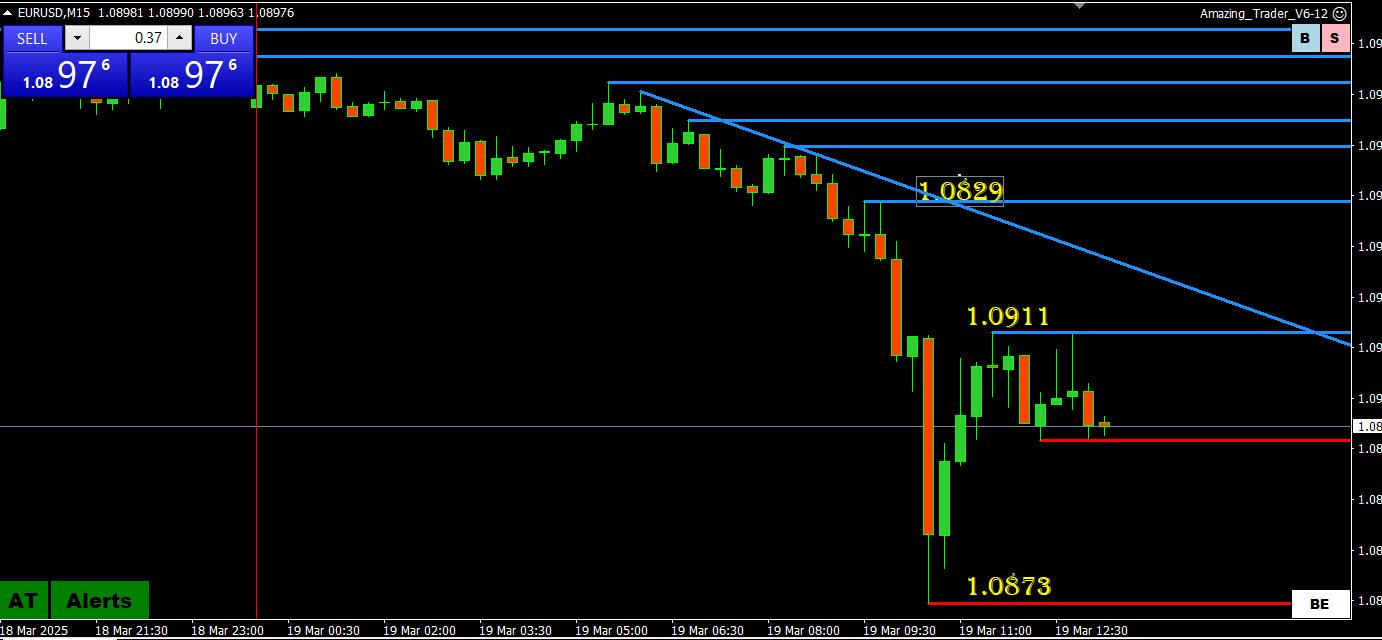
Support: 1.0868-73
Resistance 1.0911. 1.0929 (only above it would negate the downside risk)
1.09 has printed except one day when high was 1.0897) 7 days in a row…. Range over this period has been 1.0921-1.0946
While 1.09 is not a magic level, the longer this pattern goes on the greater the risk of a directional move once it is broken.
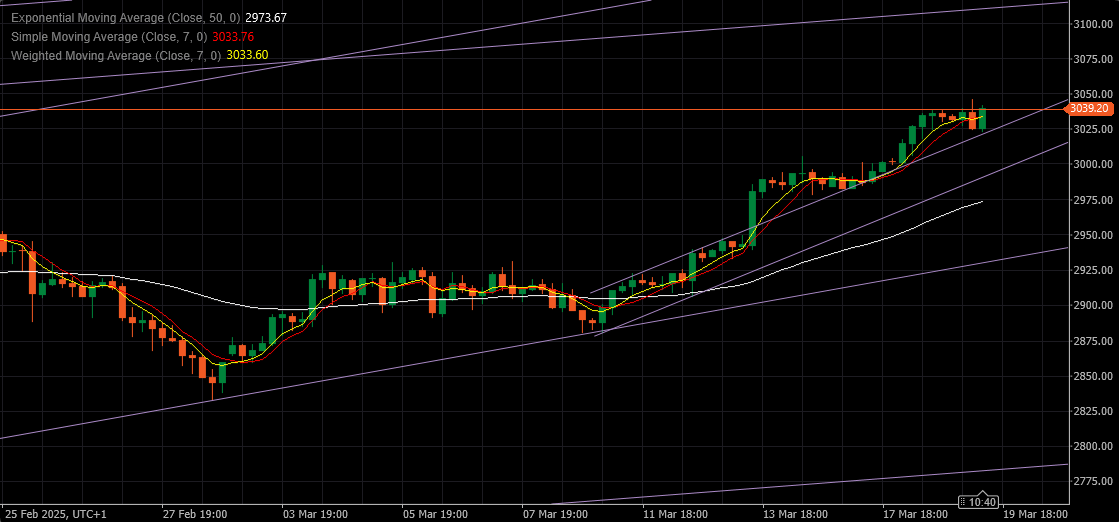
March 19, 2025 at 10:14 am #21100XAUUSD 4 HOUR CHART – PAY ATTENTION
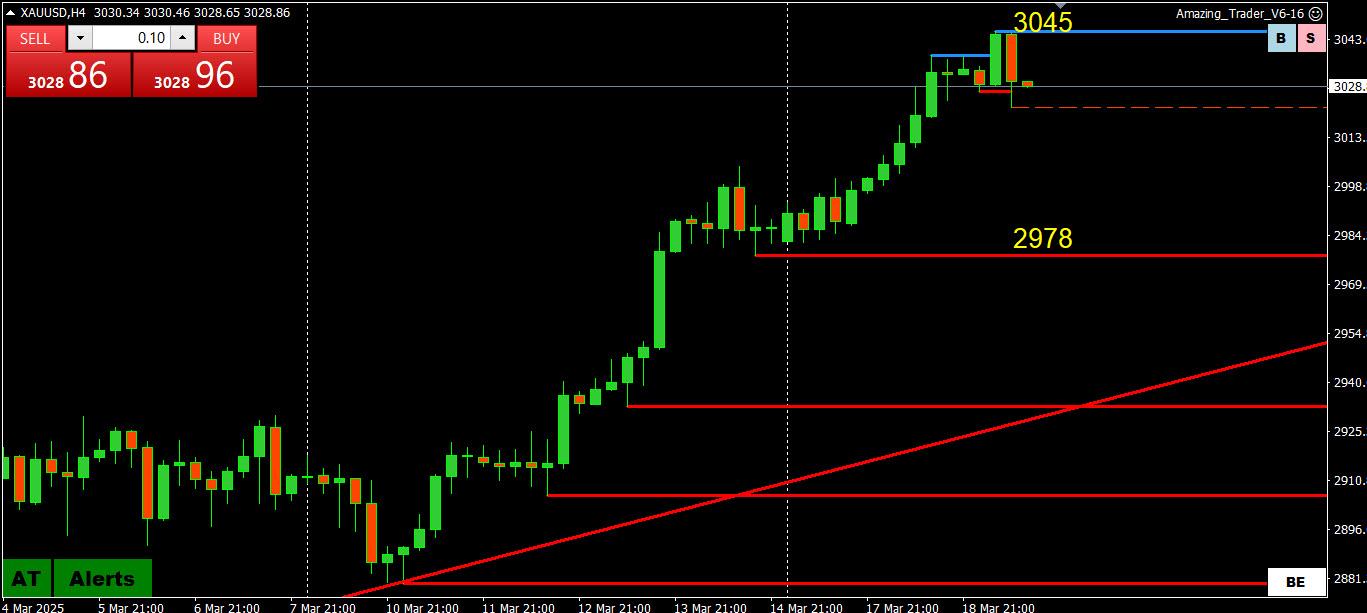
I always pay attention when any instrument trades around the :50” level….
This time it is XAUUSD pausing below 3050 (high 3045)
It is hard to call for a correction given the strength of trend but stall below 3050 suggests some consolidation
BUT only below 3000 would dent the risk on the upside, below 2978 would negate it..
March 19, 2025 at 9:53 am #21099Using my platform as a HEATMAP shows
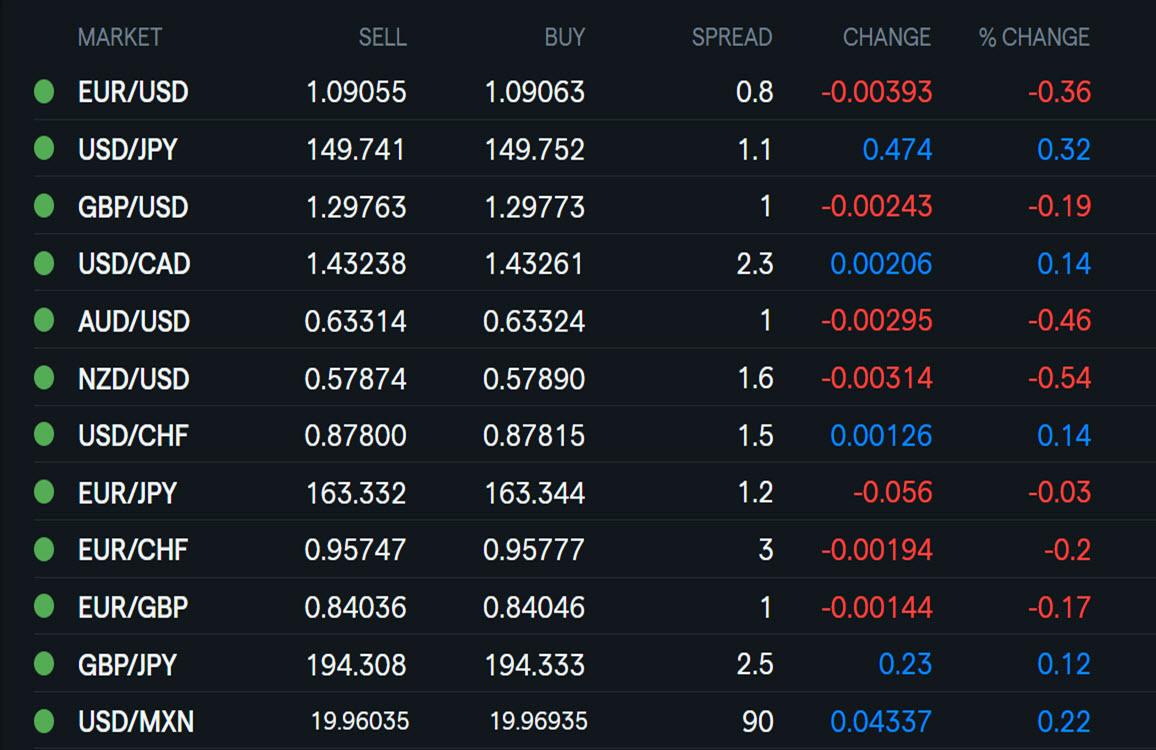
… the dollar trading firmer
EURUSD back to 1.09 for the 7th day in a row after running stops to a low at 1.0873. Note a failure again to make a serious run above 1.0950 (this time paused below it).
Perhaps some disappointment the Trump-Putin call did not result in a full ceasefire
USDJPY 150 briefly tested (high 150.02) after the BoJ kept policy steady
Turkish lira smashed following arrest of chief political rival
XAUUSD consolidating after surging to another record high yesterday
Looking ahead… Fed day today… see detailed FOMC preview
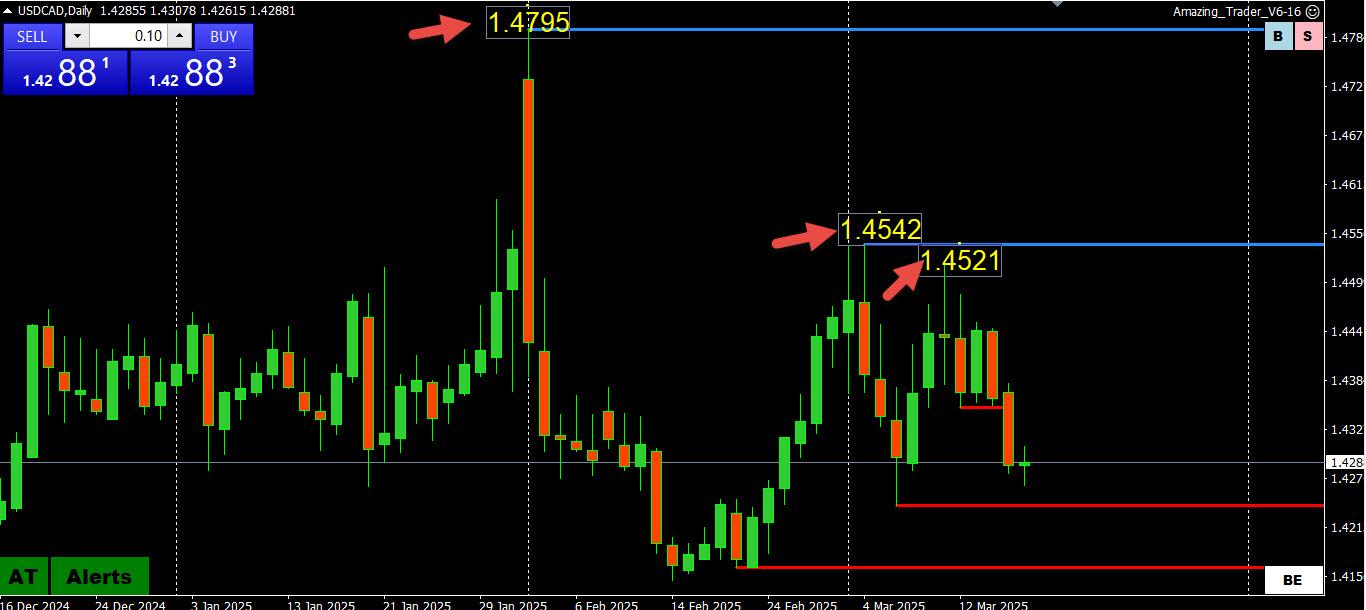
March 18, 2025 at 11:36 pm #21097USDCAD 1.4297 as I type
after the inflation thinggie washed a few earlier today, I suggest that the BoC has already forgotten about it and is already twisting its bifocals to focus on tariffs game’s possible effects not just around April 2 but even some months further out.
—–Of note
… “Mr. Bessent’s comments on Tuesday suggest the U.S. administration is leaning towards using one tariff rate for each country, and that it’s open to negotiation.
“What’s going to happen on April 2, each country will receive a number that we believe represents their tariffs. So for some countries, it could be quite low, for some countries it could be quite high,” Mr. Bessent said in an interview on Fox News.
He said that the number will include both tariffs other countries put on U.S. goods, and other measures that the administration believes disadvantage U.S. companies.
“We are going to go to them and say, ‘Look, here’s where we think the tariff levels are, non-tariff barriers, currency manipulation, unfair funding, labour suppression, and if you will stop this, we will not put up the tariff wall.’” …/..
March 18, 2025 at 9:29 pm #21096March 18, 2025 at 8:01 pm #21095NAS100 WEEKLY CHART _ Similar to US500
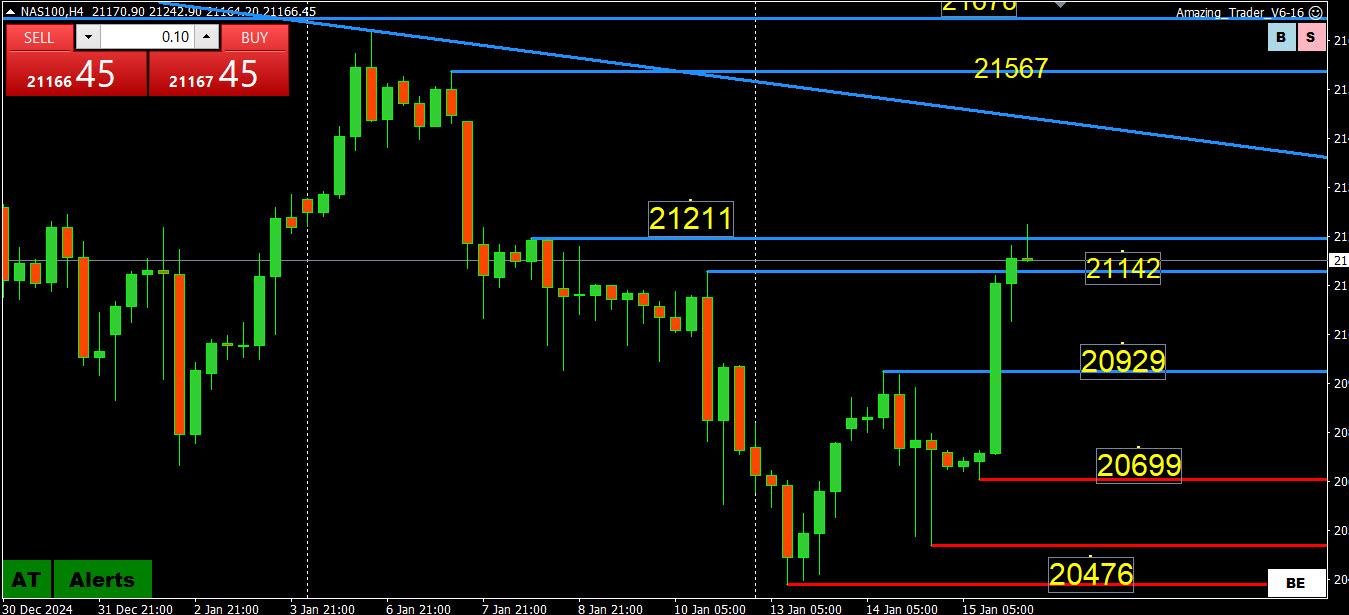
The current pattern is 4 weeks in a row down… lower highs/lower lows => 4 red candles
To break the pattern and reverse the risk it would need a higher low/higher high above 20120.
An inside week would suggest just a pause.
Extending the pattern would be bearish, which makes the 19113 low most important.
March 18, 2025 at 7:56 pm #21094Posted over the weekend in GTA
CHART OF THE WEEK – US500 WEEKLY
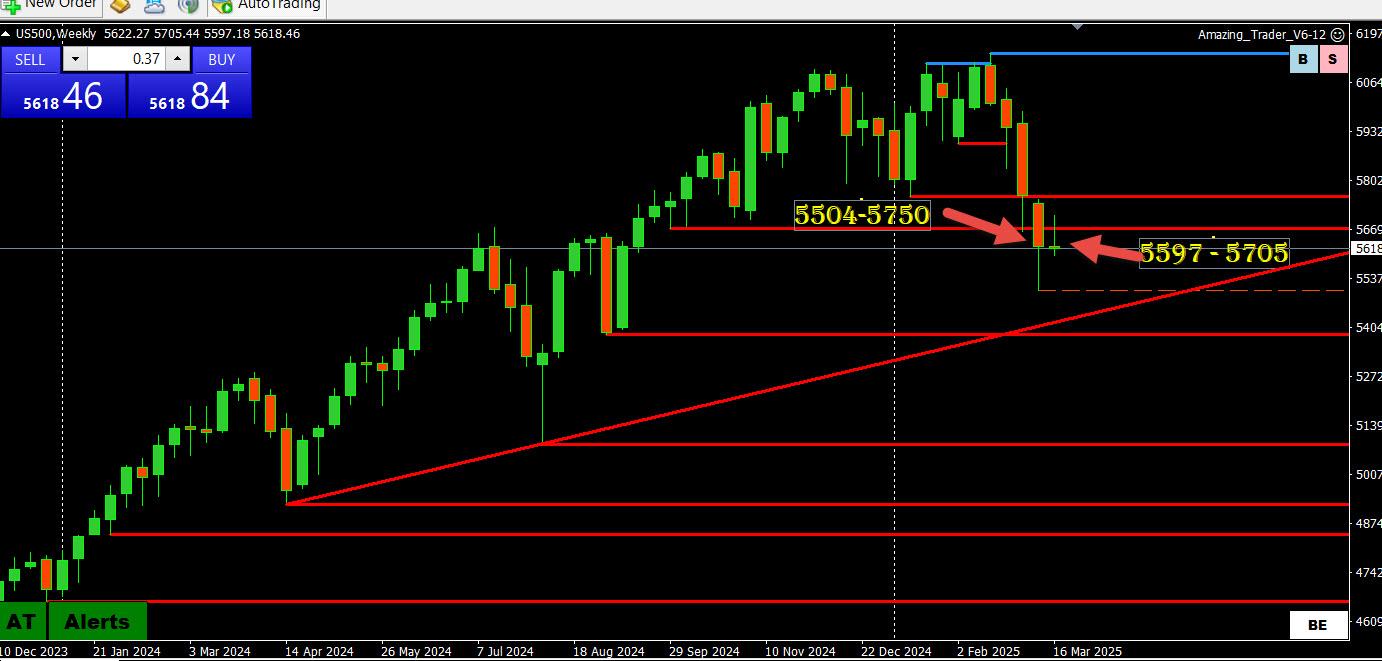
With the focus on equities to set the risk on/risk off mood, the current pattern in US500 is my chart of the week.
The current pattern is 4 weeks in a row down… lower highs/lower lows => 4 red candles
To break the pattern and reverse the risk it would need a higher low/higher high above 5750).
An inside week would suggest just a pause.
Extending the pattern would be bearish, which makes the 5504 low most important.
(Note there iw a double bottom at .5597).
March 18, 2025 at 6:53 pm #21093March 18, 2025 at 6:47 pm #21092March 18, 2025 at 6:40 pm #21091March 18, 2025 at 6:33 pm #21090March 18, 2025 at 6:03 pm #21088March 18, 2025 at 5:57 pm #21087euro 1.0947
puppy, on longer time bars, looks to be having a solid run uP. Hoever it has yet to pop over 1.1065
it may need to test 1.0875/50 and if the test would hold maybe re-charge for new run uP for 1.1065 amd beyond.
A “successful” ukrainian war resolution should be euro-positive to some degree.
March 18, 2025 at 5:30 pm #21084U.S. stocks fall as Fed convenes, euro wavers as Germany passes debt reform
· Israeli strikes on Gaza revives Middle East tensions
· U.S. housing starts, industrial output surprise to the upside
· Safe-haven flows keep gold above $3,000
· Wall Street turned lower and gold surged to record highs on Tuesday as Israeli airstrikes on Gaza revived geopolitical jitters and the U.S. Federal Reserve gathered to discuss monetary policy amid growing economic uncertainty.
· A vote by Germany’s parliament to overhaul government spending caused the euro to waver, although it also sent European stocks higher and boosted German shares to near-record highs.
· Even so, all three major U.S. stock indexes were lower in early trading, with weakness in tech-related megacap stocks dragging the tech-laden Nasdaq down the most.
March 18, 2025 at 5:13 pm #21083March 18, 2025 at 5:03 pm #21082See if you can apply the lesson from reading this article to others (hint: EURUSD making a fresh run at its upsaide)
-
AuthorPosts
- You must be logged in to reply to this topic.
© 2024 Global View

