- This topic has 11,679 replies, 48 voices, and was last updated 5 months, 1 week ago by GVI Forex 2.
-
AuthorPosts
-
November 5, 2024 at 2:25 pm #13980November 5, 2024 at 1:54 pm #13957
GBPUSD Daily
Supports : 1.29450 , 1.29050 & 1.28450
Resistances : 1.30000, 1.30450 & 1.31050
Cable is in the sideways from 15.10. with some up and downticks.
Waiting for two major outcomes : US Election ( today) and FOMC ( Thursday ).
If we put aside that influence , strictly chart wise, a Pattern is forming for another Uptrend Episode.
Breaks of given supports/resistances won’t mean anything if it won’t be followed by few days of continuation !
Sit on your fingers ( use them to hold a coffee cup ) and wait for the outcomes.
 November 5, 2024 at 1:08 pm #13954November 5, 2024 at 12:21 pm #13953
USDCAD VOLATILITY TRADE
On the 12-month chart, price show an impulsive bearish move that took 6 years to complete. In tandem with price action, the bullish correction that is currently active has taken 14 years. Price is yet to contact a fresh long-term supply sitting at 1.544.
On the monthly and weekly charts, the structure is still the same. Price is seeking to contact a short-term fresh supply at 1.44.
On the daily chart, price continues to form new highs. In the short term (daily), we are looking at a bearish price correction fueled by the US election volatility. Price is expected to correct towards the 1.35-1.32 range after that resuming the original long-term bullish price correction.November 5, 2024 at 11:31 am #13951Newsquawk US Open
USD is softer & USTs are flat on election day. Crude rises on geopols & constructive Chinese data
Good morning USA traders, hope your day is off to a great start! Here are the top 4 things you need to know for today’s market.
4 Things You Need to Know
European bourses are mixed and trading tentatively on either side of the unchanged mark; US futures are incrementally firmer/flat.
Dollar is slightly softer on US election day, Antipodeans benefit from constructive Chinese PMIs and Aussie was fairly unreactive to an unsurprising hold at the RBA.
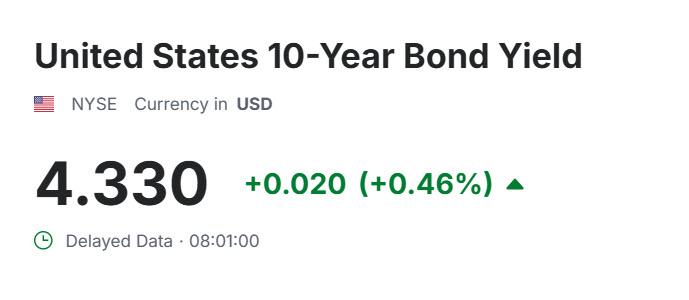
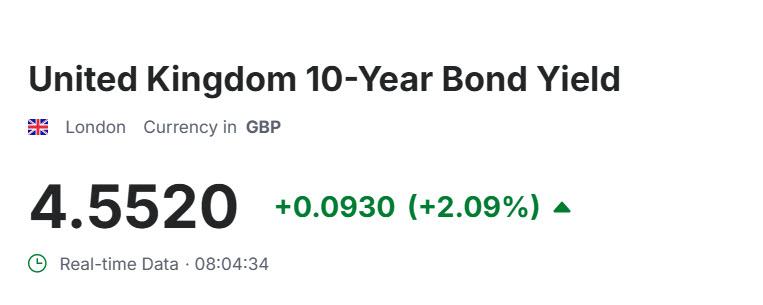
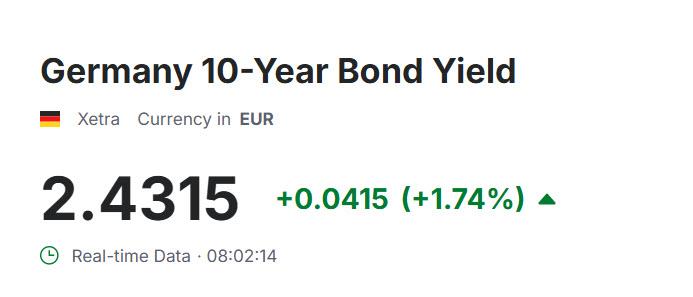
USTs are essentially unchanged, Bunds are pressured alongside Gilts; the latter was weighed on by its 2034 auction.
Upward bias across industrials amid geopolitics and encouraging Chinese PMI data.
November 5, 2024 at 11:27 am #13950A look at the day ahead in U.S. and global markets from Mike Dolan
Even with the uncertainty of what most pollsters see as a dead heat in the White House race, world markets are in a upbeat mood as Americans cast their ballots on Tuesday and await the result.
One reason for the relative calm is that bookmaker odds on a Republican “clean sweep” of the presidency and both houses of Congress have lengthened compared with last week, with gridlock now the best guess whoever wins the Presidency.
November 5, 2024 at 10:49 am #13949EURUSD 1 HOUR CHART – ON HOLD
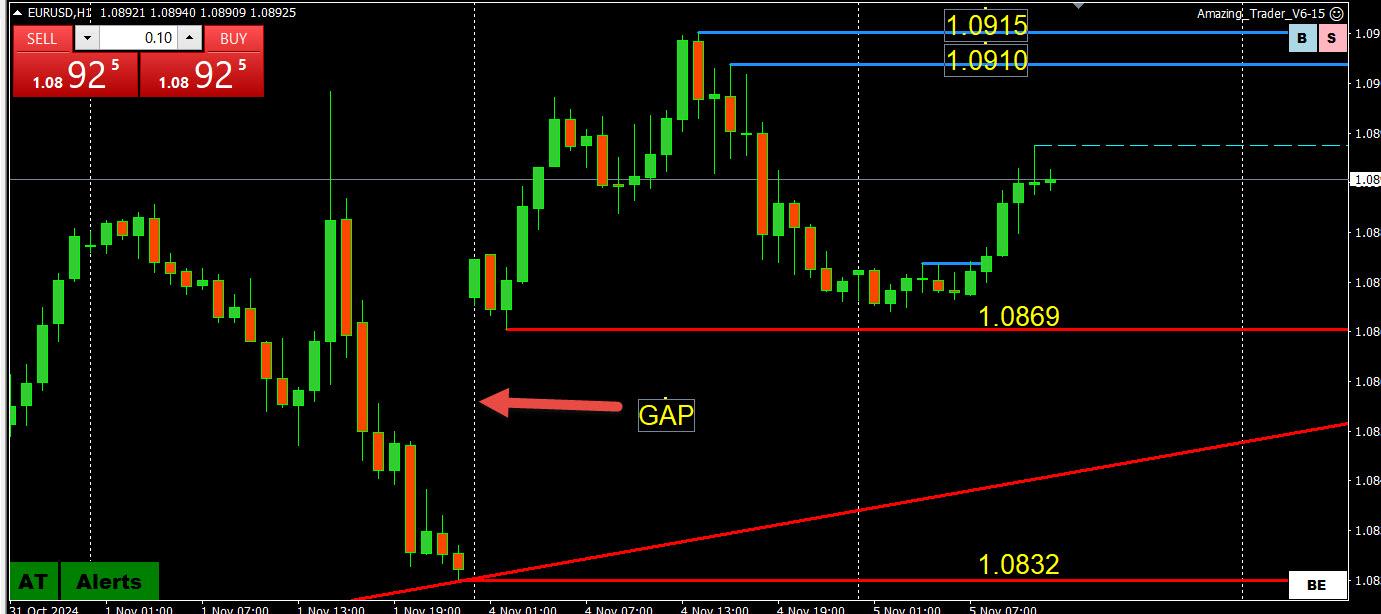
EURUSD in a holding pattern awaiting the results of the US election.
If trading, stick to short-term charts and day trade as even if you call the election right, you could be caught out by an early vote headline.
‘
Current range is around 1.0870-1.0915, the bottom end is the top of the gap.November 5, 2024 at 10:18 am #13948November 5, 2024 at 10:10 am #13946LONDON (Reuters) – Currency traders rushed to hedge against big overnight price movements that might ensue as the results of the 2024 U.S. election trickle out, pushing options volatility for the euro and Mexican peso to the highest since the 2016 vote.
November 5, 2024 at 10:10 am #13947LONDON (Reuters) – Currency traders rushed to hedge against big overnight price movements that might ensue as the results of the 2024 U.S. election trickle out, pushing options volatility for the euro and Mexican peso to the highest since the 2016 vote.
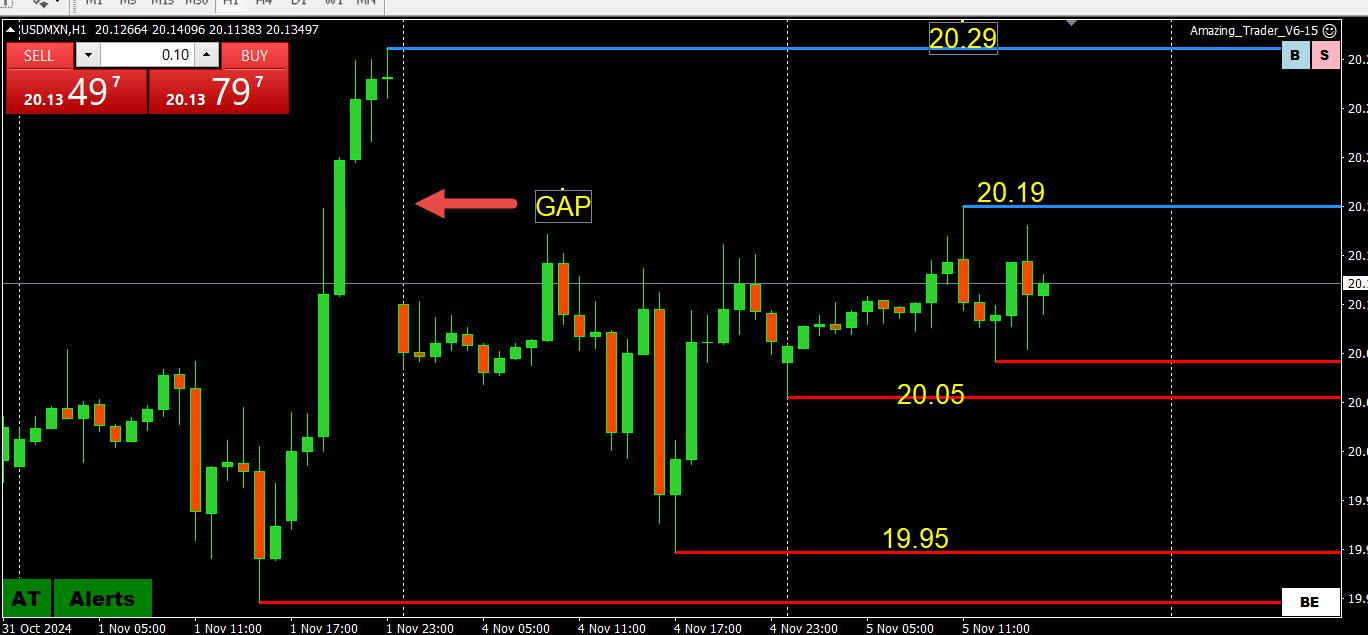
November 5, 2024 at 1:43 am #13945November 5, 2024 at 12:29 am #13944November 5, 2024 at 12:00 am #13943November 4, 2024 at 11:51 pm #13942November 4, 2024 at 11:11 pm #13941For traders, the focus will be on the Dollar, with a Trump win and a Republican sweep seen as the most bullish case for the Buck, with Commodity FX, the Yuan, and MXN amongst EMFX heavily weighed on. If Harris won, the Greenback is expected to be weaker, with commodity FX outperforming along with the EUR…
November 4, 2024 at 9:43 pm #13940NAS100 DAILY CHART – BUCKLE UP
H
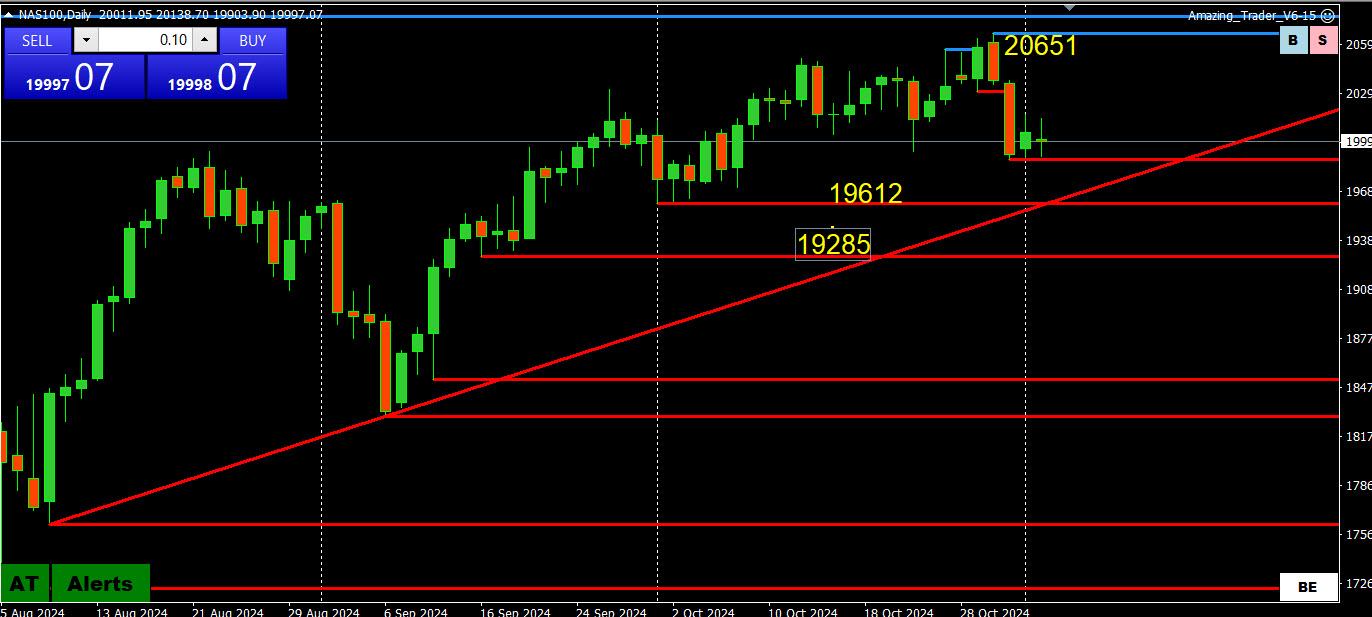
NAS100 closing around the 20K level, which is the obvious bias setter once the dust settles on the US election. Expect alot of chop as election headlines come out until a clear winner emerges and the make up of Congress is known.Looking at the chart, risk is tilted down but to suggest the top is in, the trendline would need to be taken out.
For trading in general, expect false starts on news headlines and as noted, how markets end the week will be more important that what goes on in between.
November 4, 2024 at 9:23 pm #13939AUDUSD 1 HOUR – WILL IT FILL THE GAP?
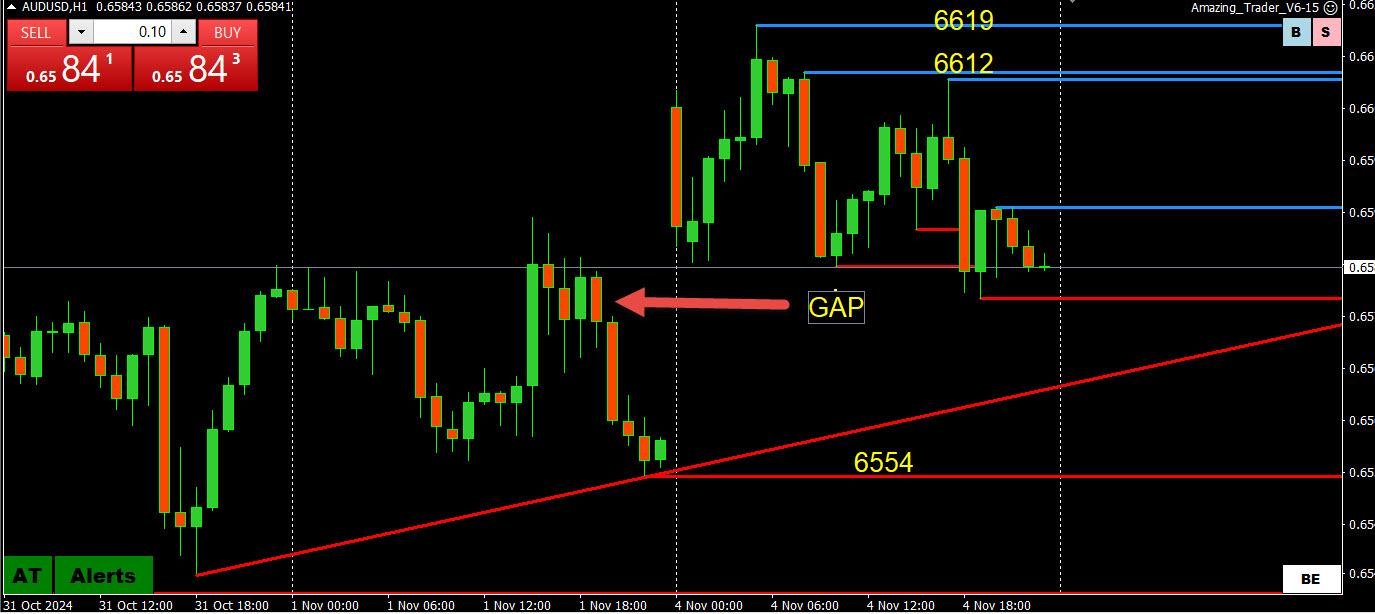
Brief break of .6615 not following through (.6646-61 above it)
Opening week gap to ,6559
Amazing Trader Directional Indicator (2 blue lines) shows potential for a top but only a break of .6585 would confirm and put the gap in play.
Key event risk: RBA decision… see PREVIEW
November 4, 2024 at 9:13 pm #13938US500 DAILY CHART -ELECTION DAY IS FINALLY HERE
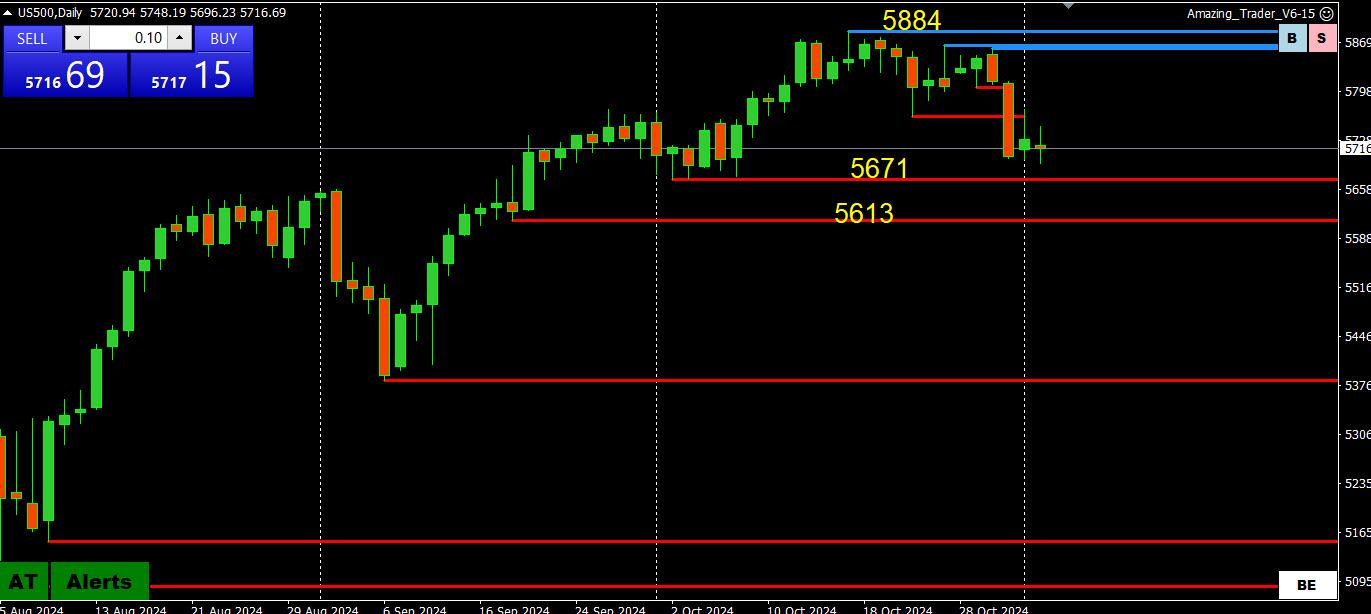
Once the dust settles, I would ask the question which is better for the stock market, Trump or Harris?
This is not as clear cut as it appears, as Trump comes with a risk/reward while Harris seems more of the status quo, assuming there is a divided Congress.
In US500, a firm break of 5700-5800 will dictate the eventual tone. Support in the 5600s, key resistance is at the record high.
Otherwise, hold on to your seat belts in a market where how it ends the week may be more important than what happens in between,
November 4, 2024 at 8:58 pm #13937November 4, 2024 at 8:23 pm #13936 -
AuthorPosts
- You must be logged in to reply to this topic.
© 2024 Global View

