-
AuthorSearch Results
-
February 29, 2024 at 3:26 am #2220
In reply to: Forex Forum
EURUSD Analysis: Sideways Move Continues, Key Levels to Watch
The EURUSD pair failed to break below the 1.0789 support level and has been moving sideways within a trading range between 1.0789 and 1.0887. This suggests that the pair is still in the uptrend from 1.0694, and the sideways move is likely a consolidation phase for the uptrend.
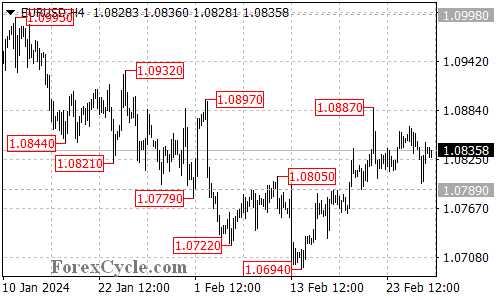
As long as the 1.0789 support level holds, the upside move could be expected to resume. A breakthrough of the 1.0887 resistance level could trigger further upside movement towards the 1.0950 area.
On the downside, a breakdown below 1.0789 would confirm that the upside move from 1.0694 has already completed at 1.0887. In this case, the next target would be at 1.0750, followed by 1.0694.
February 28, 2024 at 2:20 am #2139In reply to: Forex Forum
USDJPY Analysis: Consolidation Continues, Key Levels to Watch
The USDJPY pair has failed in its attempt to break above the 150.88 resistance level and remains within a trading range between 149.52 and 150.88.
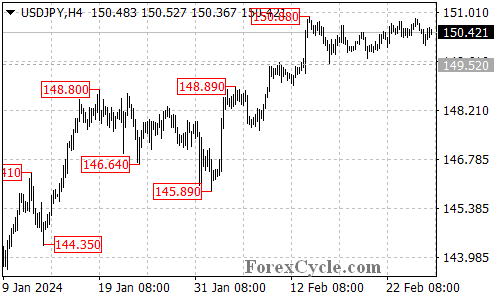
Nevertheless, as long as the 149.52 support level holds, the sideways movement could be viewed as consolidation for the uptrend from 145.89. A breakout above the 150.88 resistance level could potentially trigger another rise towards the 151.90 resistance level.
The critical support level to monitor is at 149.52. A breakdown below this level would suggest that the upside move has concluded at 150.88. In such a scenario, the pair could find support around the 148.80 area.
February 27, 2024 at 5:12 am #2089In reply to: Forex Forum
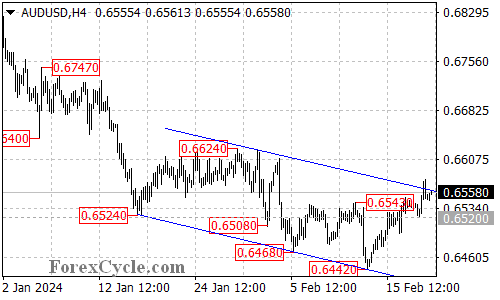
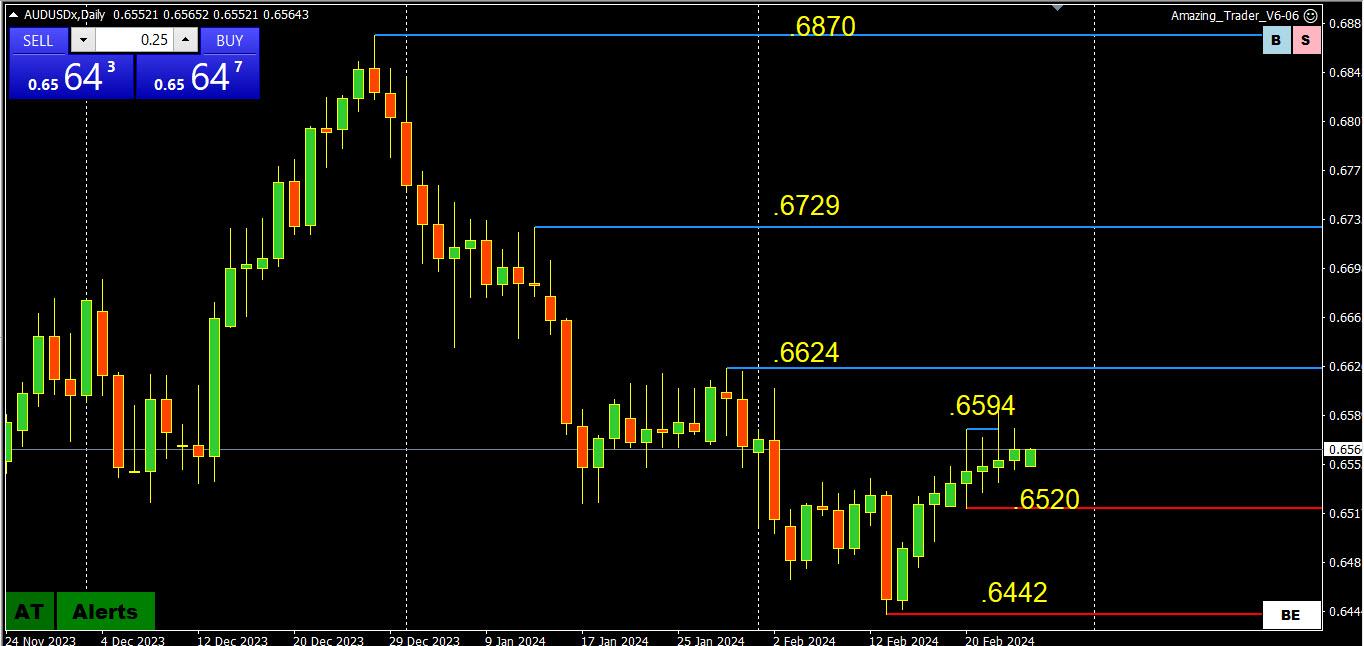
AUDUSD Analysis: Sideways Move Continues, Resistance and Support Levels
The AUDUSD pair has been moving sideways within a trading range between 0.6521 and 0.6594.
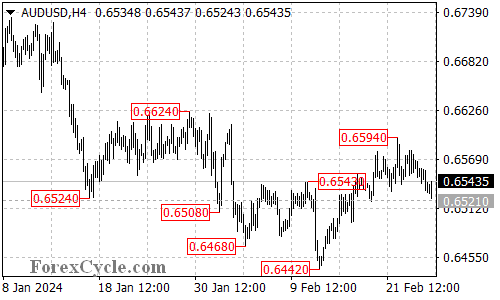
As long as the 0.6521 support level holds, the pullback from 0.6594 could be seen as corrective consolidation for the uptrend from 0.6442. Another rise is still possible after the consolidation.
The initial resistance level is located at 0.6555. A breakthrough of this level could trigger another rise to test the 0.6594 resistance level. A breakthrough of this level would aim for the 0.6624 resistance level.
On the downside, a breakdown below the 0.6521 support level would indicate that the upside move has already completed at 0.6594. In this case, another fall towards the 0.6442 previous low could be seen.
February 26, 2024 at 2:40 am #2033In reply to: Forex Forum
USDJPY: Stuck in Limbo – Uptrend Consolidation or Downturn Signal?
USDJPY has been stuck in neutral territory, oscillating within a trading range between 149.52 and 150.88. This sideways movement leaves the near-term direction unclear, prompting questions about whether it’s a pause within the uptrend or a sign of a potential reversal. Let’s delve into the key support and resistance levels to understand the possible scenarios.
Uptrend on Hold? Sideways Consolidation as a Signal
149.52 Support: The Bullish Anchor: As long as the price remains above this crucial support level, the uptrend initiated at 145.89 remains valid. This suggests the current sideways movement could be a healthy consolidation phase within the ongoing uptrend.
Breakout Potential: If the bulls manage to accumulate enough strength and push the price above the 150.88 resistance level, it could signal a breakout from the range and trigger a further rise towards the 151.90 resistance, potentially solidifying the uptrend.Downturn Signals: Watching the Support Crack
149.52 Breach: A Reversal Indicator: A breakdown below the 149.52 support level would be a significant development, potentially indicating a completion of the uptrend from 145.89. This could lead to a decline towards the next support zone around 148.80, marking a potential trend reversal.
Overall Sentiment:
The current technical picture for USDJPY presents conflicting signals. The sideways movement creates uncertainty, leaving the near-term direction unclear. While holding above 149.52 and breaking above 150.88 suggest potential bullish continuation, a breakdown below support could signal a trend reversal and further decline. Monitoring the price action around the mentioned support and resistance levels will be crucial in determining the pair’s next move.
Disclaimer: This analysis is for informational purposes only and should not be considered as investment advice. Please conduct your own research before making any trading decisions.
February 25, 2024 at 11:21 pm #2031In reply to: Forex Forum
February 25, 2024 at 10:47 am #2014In reply to: Forex Forum
Week Ahead: EURGBP
EURGBP Daily Chart
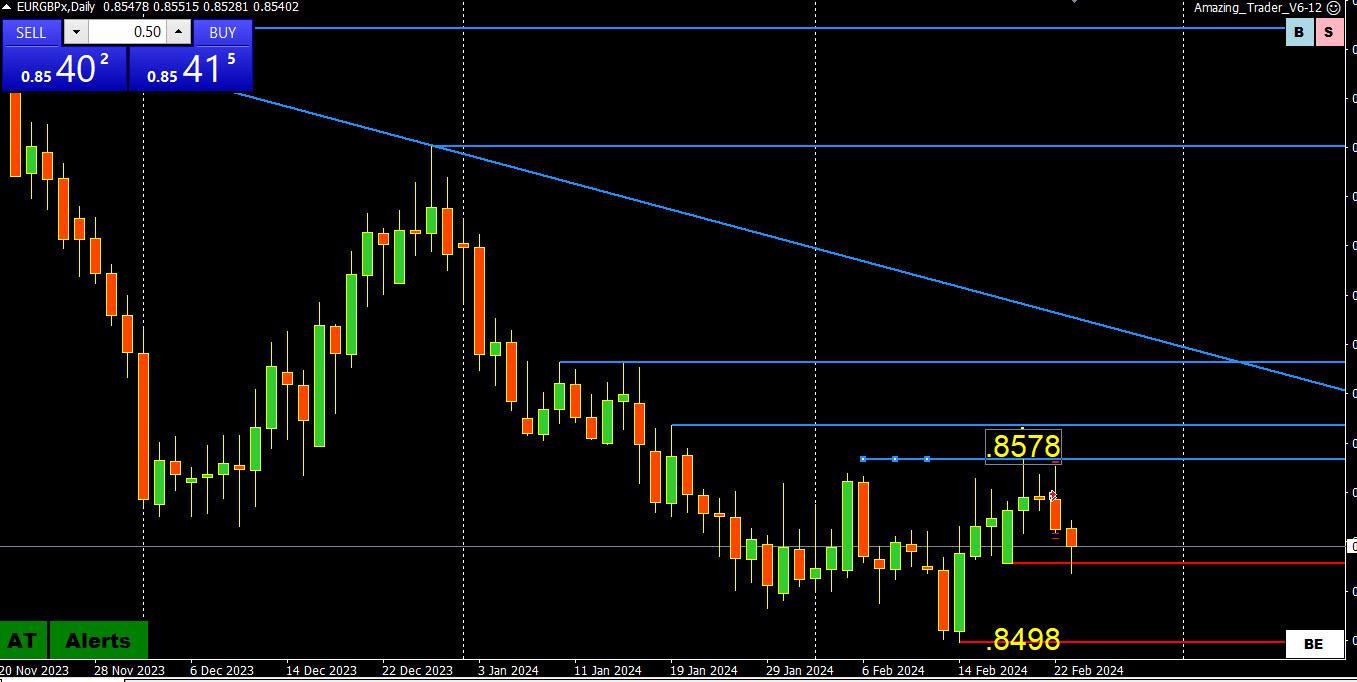
The consolidation range is clear at .8498-.8578
This suggests .8500 will remain pivotal as only a firm break would open the door to another leg down.
On the other hand, only a firm break of .8578 would suggest the low is in for now/
Why am I highlighting EURGBP?
1) If you trade EURUSD and/or GBPUSD, you need to keep an eye on EURGBP as flows involving this cross often have an impact on price moves in EURUSD and GBPUSD
2) Month end (Feb 29): I have observed increased activity in EURGBP at month end, which in turn often sees erratic flows not only in the cross but in EURUSD and GBPUSD. So keep a close eye at month end as it can offer trading opportunities in respective pairs as well as in EURGBP. In this regard, watch price action throughout the day but especially leading up to and around the 4 PM London fixing.
February 23, 2024 at 5:21 am #1971In reply to: Forex Forum
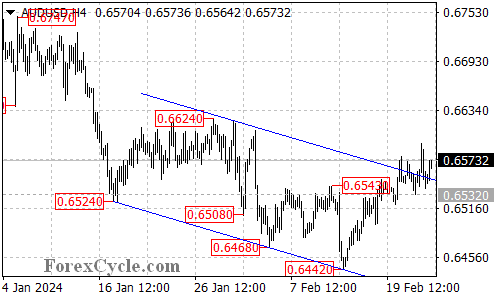
AUDUSD Breaks Free: Uptrend Resumption or False Dawn?
AUDUSD has clawed its way back from recent lows, breaking above the confines of the falling price channel on the 4-hour chart. This bullish breakout raises questions: Has the downtrend truly ended, or is this just a temporary reprieve?
Uptrend Resumed: Channel Breakout as Confirmation?
Channel Breach: The break above the falling channel, established from the 0.6870 high, signifies a potential shift in momentum. This suggests a possible end to the downtrend and the start of a new uptrend from the recent low of 0.6442.
Potential for Continued Rally:
Resistance Levels: If the uptrend continues, the next target for AUDUSD could be the 0.6624 resistance level. Surpassing this hurdle would open the door for further gains towards 0.6700, solidifying the bullish momentum.
Support Levels to Watch for Pullbacks:
Initial Support: The initial support to watch is at 0.6532. A breakdown below this level could indicate a loss of momentum and a potential pullback towards the 0.6500 area.
Key Support: A further breach below 0.6500 could trigger a decline towards the previous low of 0.6442, potentially signaling a resumption of the downtrend.Overall Sentiment:
The technical picture offers a mixed outlook for AUDUSD. The breakout from the channel suggests a potential trend reversal, but confirmation will come from holding above the 0.6532 support and pushing towards the 0.6624 resistance. Monitoring the price action around these key levels will be crucial in determining the pair’s next move.
Disclaimer: This analysis is for informational purposes only and should not be considered as investment advice. Please conduct your own research before making any trading decisions.
February 22, 2024 at 2:50 pm #1938In reply to: Forex Forum
2y and 5yr announcements at 11am EST may have a bit of an effect on price activity due to the 2yr/5yr spread carrying weight for institutions in portfolio management. My bet is a solid announcement and added stability to treasuries and Usd. Difficult to gauge reactions on those things ahead of time, especially considering most institutions have already priced in various scenarios to some extent
February 22, 2024 at 11:46 am #1921In reply to: Forex Forum
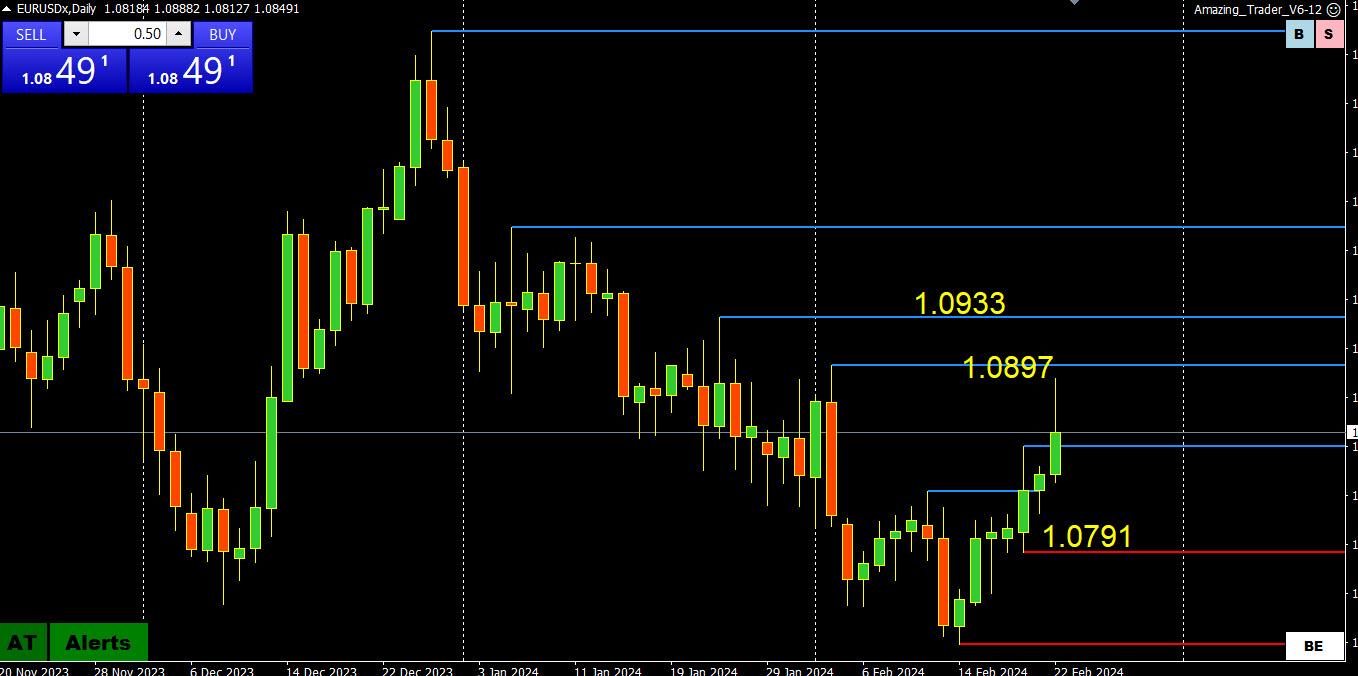
EURUSD Daily Chart
Flash PMI whipsaw day: Up on stringer French flash PMI, down on weaker German PMI
The solid break of 1.0805 saw a move up that came within 9 pips of the target at 1.0897
If 1.08=1.09 has replaced the 1.07-1.08 range then 1.0850 is the obvious bias setter.
Technicals are still positive, expect support if 1.0840 holds
If not then it is back to 1.0800-20
February 22, 2024 at 10:11 am #1910In reply to: Forex Forum
February 22, 2024 at 3:29 am #1900In reply to: Forex Forum
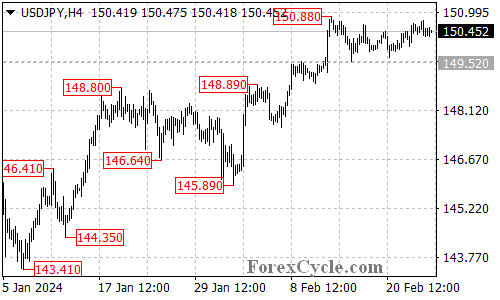
USDJPY Analysis: Sideways Movement Continues, Resistance and Support Levels
The USDJPY pair has attempted to break below the 149.52 support level but failed and has since moved sideways within a trading range between 149.52 and 150.88.
As long as the 149.52 support level holds, the sideways movement could be seen as consolidation for the uptrend from 145.89. A breakthrough of the 150.88 resistance level could trigger another rise towards the 151.90 resistance level.
On the other hand, a breakdown below the 149.52 support level would indicate that the upside move from 145.89 has already completed at 150.88. In this case, the pair would find support around the 147.50 area.
February 21, 2024 at 9:29 pm #1898In reply to: Forex Forum
February 21, 2024 at 12:21 pm #1851In reply to: Forex Forum
Maybe for lack of anything better to do I kinda like adding to silver longs or at least opening with less than a full allocation here. Regardless of whether NVDA beats (or not) maybe stocks correct for a couple months, bonds go down for the wrong reasons, and well, at the end of the day there’s still a lot of liquidity, and its gotta go someplace… Maybe consolidation from May last year sees upside resolution towards 26.00 over the next few weeks/months. Maybe…
February 21, 2024 at 3:04 am #1834In reply to: Forex Forum
AUDUSD Bounces, But Can It Break the Downtrend?
AUDUSD has staged a comeback from its recent low of 0.6442, but faces a stiff challenge at the upper boundary of the falling price channel on the 4-hour chart. This resistance zone will determine whether the current rally is a mere blip in the downtrend or a sign of a potential trend reversal.
Upside Potential: Can the Rally Extend?
- 0.6624 Resistance in Sight: If the bulls manage to push the price above the price channel resistance, it could signal a significant breakout and pave the way for further gains towards the next resistance level at 0.6624. This would indicate a shift in momentum and potentially mark the start of a new uptrend.
Support Levels to Watch for Downtrend Continuation
- 0.6520: Initial Hurdle: If the upside momentum fades and sellers regain control, a breakdown below the initial support level of 0.6520 could trigger another decline. This could lead to a retest of the 0.6442 support level that marked the recent low.
- Lower Support Levels: Further breakdown below 0.6442 would open the door for falls towards the 0.6400 area, solidifying the downtrend and suggesting the recent bounce was just a corrective move within the larger downward trend.
Overall Sentiment
The outcome of the price action around the 0.6520 support level and the price channel resistance will be crucial in determining AUDUSD’s next move. A breakout above the channel could indicate a potential trend reversal and upside potential towards 0.6624. Conversely, a breakdown below 0.6520 and subsequent breach of 0.6442 would reinforce the downtrend and suggest further decline towards 0.6400 or lower.
Disclaimer: This analysis is for informational purposes only and should not be considered as investment advice. Please conduct your own research before making any trading decisions.
February 20, 2024 at 1:48 am #1786In reply to: Forex Forum
USDCHF Analysis: Uptrend Continues, Resistance and Support Levels
The USDCHF pair is currently above a rising trend line on its 4-hour chart, indicating that the pair remains in an uptrend from 0.8550.
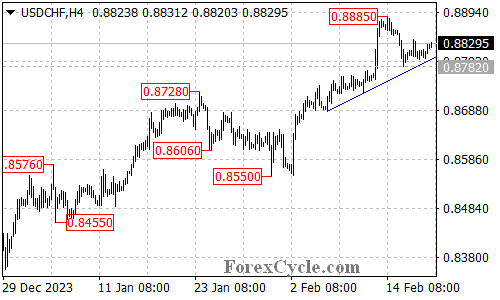
As long as the trend line support holds, the pullback from 0.8885 could be seen as consolidation for the uptrend. A breakthrough of the 0.8845 resistance level could trigger another rise to test the 0.8885 resistance level. A breakthrough of this level would aim for the 0.9000 area.
The key support level is located at 0.8782. Only a breakdown below this level would indicate that the upside move has completed at the 0.8885 resistance level already. In this case, the pair would find next support at around the 0.8650 area.
February 19, 2024 at 7:18 pm #1776In reply to: Forex Forum
February 19, 2024 at 5:31 pm #1774In reply to: Forex Forum
February 19, 2024 at 4:34 pm #1770In reply to: Forex Forum
JP – The Fed cutting rates any time soon is amounting to a window into how confused people are, even analysts.
From Moody’s Analytics: “While inflation has fallen considerably from a peak of 9.1% notched during June 2022, it remains well above the Federal Reserve’s 2% goal. Additionally, when compared with January 2021, prices are up a stunning 17.6%.”
“The cost of necessities like food, gasoline, rent and child care remain far more expensive than they were just one year ago. Chronically high prices are forcing Americans to spend about $650 more per month than they did two years ago, according to a recent estimate from Moody’s Analytics.”
February 19, 2024 at 1:57 pm #1760In reply to: Forex Forum
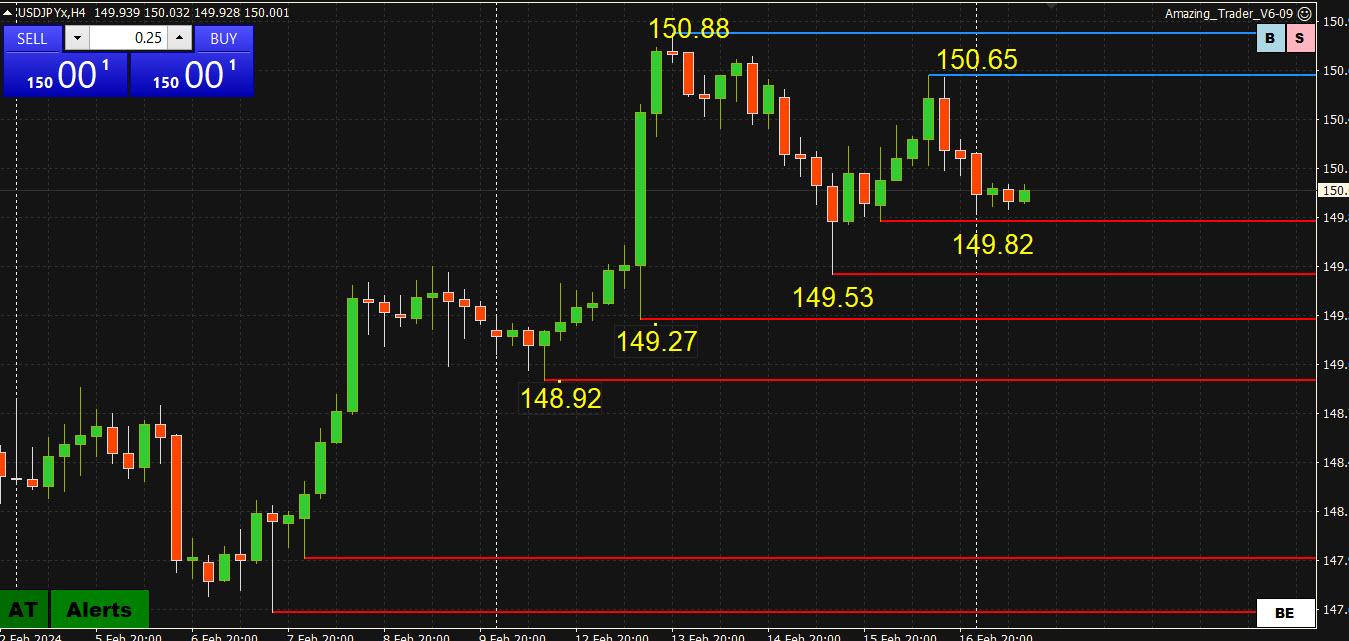
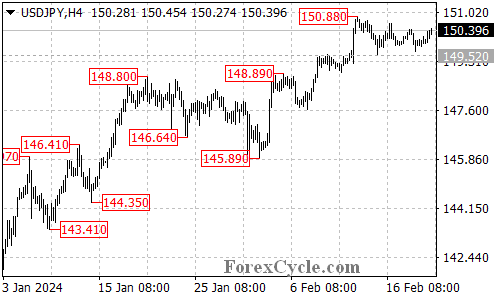
USDJPY 4 Hour Chart – Uptrend consolidating
150.00 is the bias-setting level going forward.
4-hour Levels are very clear
Sup: 148.92/149.52/149.82
Res: 140.65/150.88
Note, USDJPY tends to be most sensitive currency to moves in US bond yields
Scross down the forum to see USDJPY analysis from ForexCycle
February 18, 2024 at 10:56 pm #1742In reply to: Forex Forum
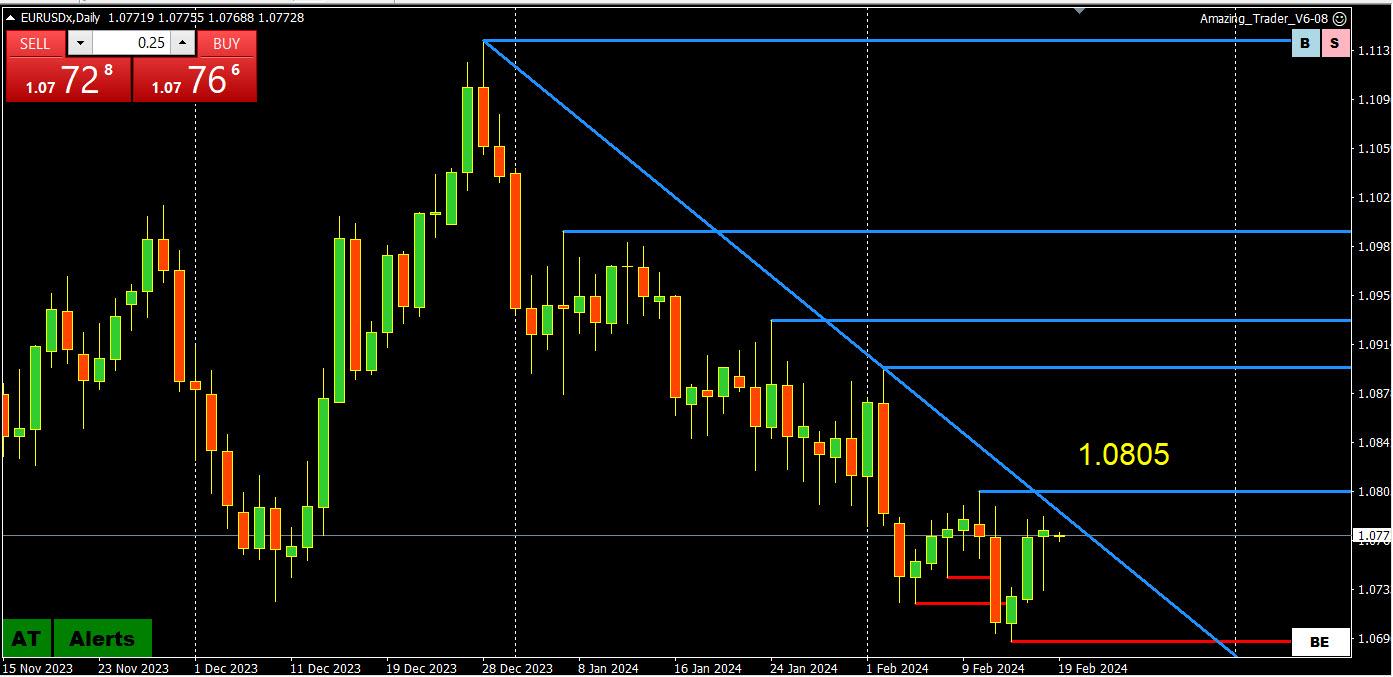 EURUSD daily chart – major trend down but consolidating
1.0805 is the key level as it appears not just on the daily but on multipole time grant charts
There is a trendline at 1.0793 but 1.0805 is the key on top.
Only a firm break and 1.08+ then being established would suggest the low (1.0696) is ion for now.
Take your pick of support within 1.07-1.98 with 1.0730 being the only one worth noting ahead of the key low.
-
AuthorSearch Results
© 2024 Global View