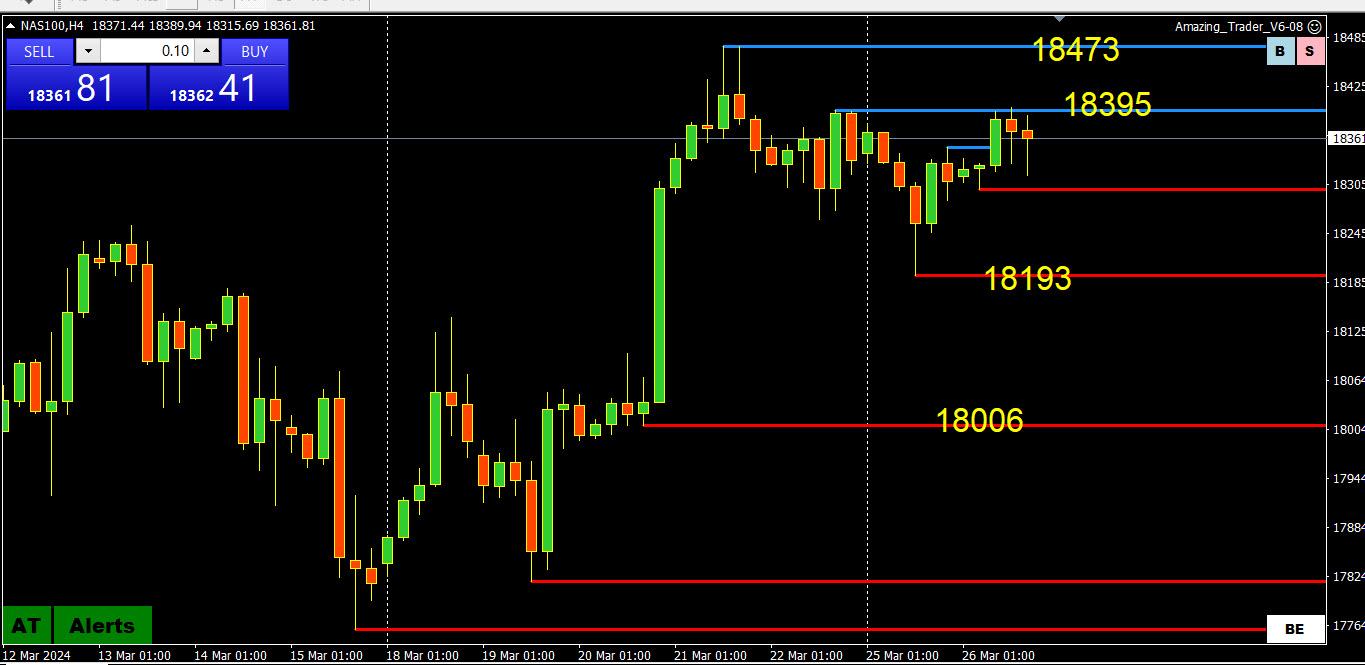
As I have said, if using CFDs, pricing can vary between brokers, even for the same symbols so look at the chart pattern as it should be similar to what you are showing on your chart.’
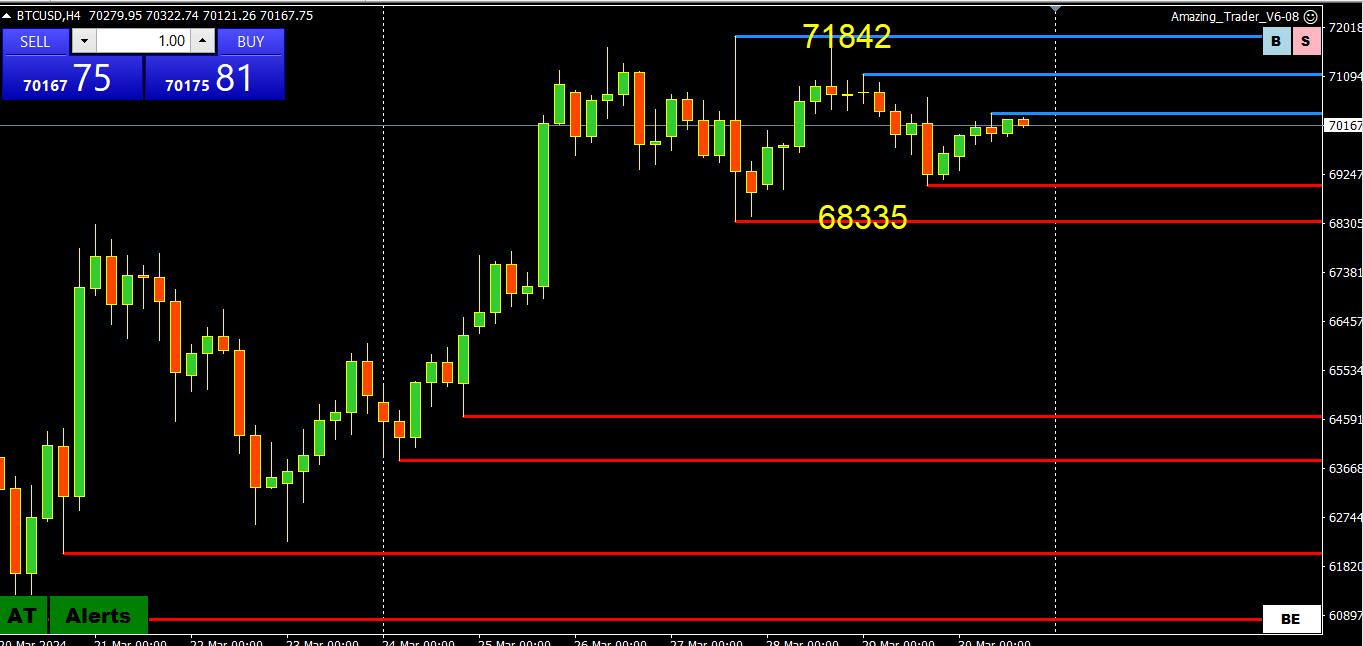
Looking at this chart, 18,000 seems to be the level that will keep a bid under this market as long as it holds.
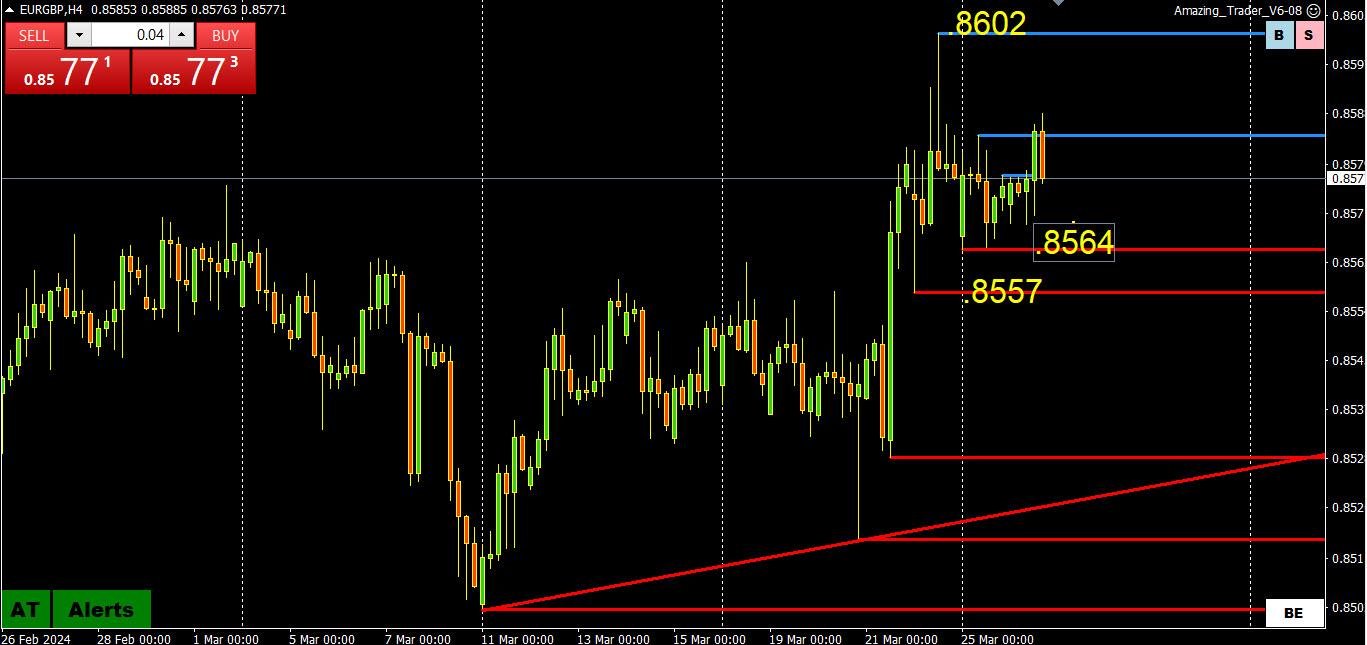
The closer to 8500 EurGbp gets the more the odds it reverses increase. It will either be that or a blow out run uphill. I am not sold on continuation at this point.
I am posting a 4-hour chart to show the key level at.8602
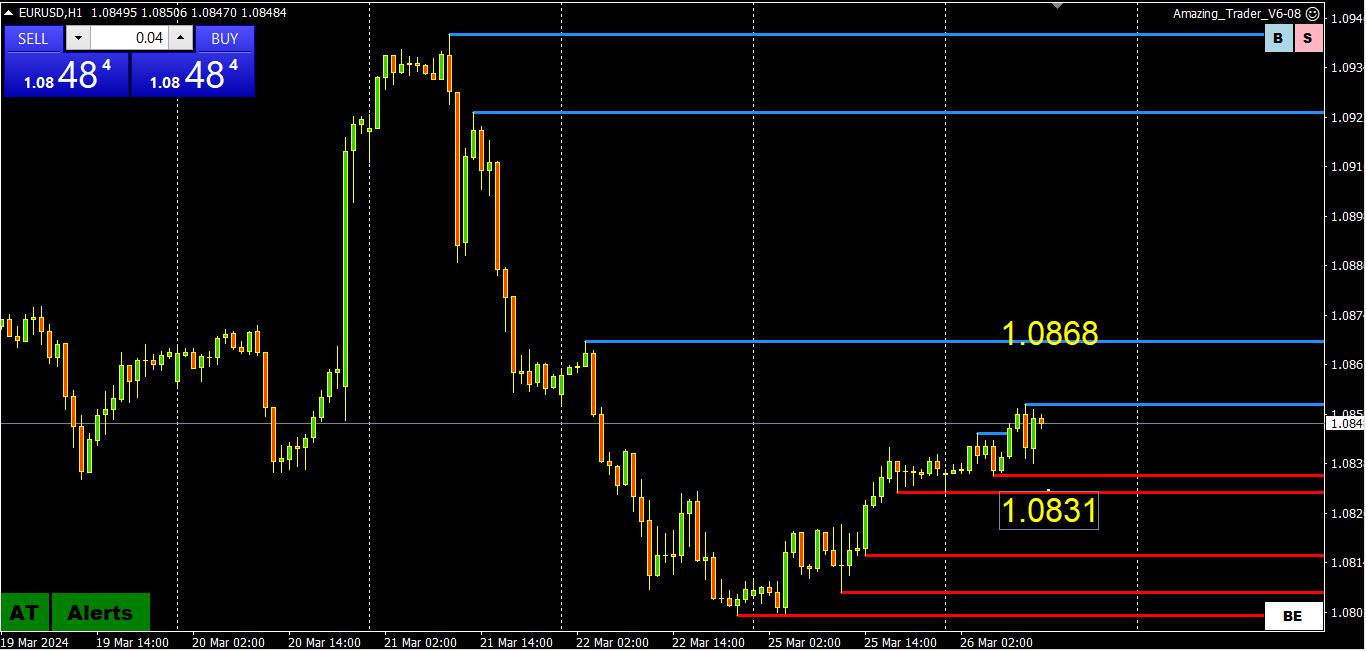
Offset GBP selling out of this cross is one reason why GBPUSD failed to test 1.2674 (cited earlier) – contact me if you want a further explanation of how this works. It also gave a bid to EURUSD, which has so far been unable to test 1.0868 (cited earlier) despite demand from this cross.
EURUSD 1 HOUR CHART – BID IN AN OFFERED MARKET OR WHAT?
Having held a test of 1.08 EURUSD gas tested the pivotal 1.0850 level in a pre-Easter week, the bounce has tested the pivotal (more psychological than technical) level at 1.0850, also the midpoint of 1.08-1.09.
There seems little incentive to push too hard unless a solid 1.0850+ trades, which would put the key 1.0868 level in play.
Otherwise, range is to 1.0831, which was also a resistance from Friday with support seen as long as it holds..
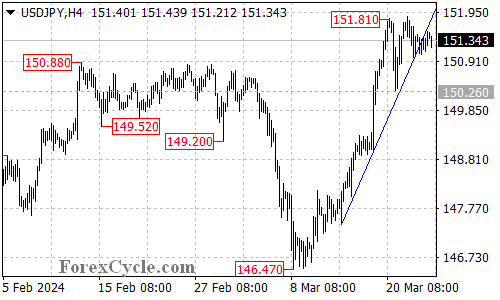
USDJPY Update: Trend Line Break and Support Levels
The recent price action in USDJPY has seen a break below the ascending trend line on the 4-hour chart, indicating that a prolonged consolidation phase for the uptrend starting from 146.47 is currently in progress.
As long as the critical support level at 150.26 remains intact, there is potential for the upward momentum to resume, with the possibility of further advancement towards the 170.00 region following the consolidation period.
The initial support level to monitor is at 150.95. If this level is breached, it could lead to a test of the key support at 150.26. Only a decisive breakdown below this pivotal level would suggest the potential completion of the uptrend that originated from 146.47.
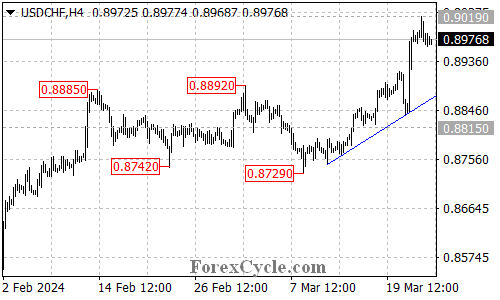
USDCHF has maintained its position above the ascending trend line on the 4-hour chart, indicating that the pair is still in an uptrend starting from 0.8729. The upward movement from 0.8729 has reached as high as 0.9019.
The subsequent retracement from 0.9019 suggests that the pair is currently undergoing a period of consolidation for the uptrend. It is expected that the pair will trade within the range of 0.8900 and 0.9019 in the coming days.
If the support level of 0.8900 remains unbroken, the bullish trend could be expected to resume, with a breakout above the 0.9019 resistance level potentially triggering another upward movement towards 0.9100 and 0.9180.
On the downside, a breakdown below the 0.8900 support level could indicate that a longer period of consolidation for the uptrend starting from 0.8729 is necessary. In this scenario, the pair would likely find support at the rising trend line on the 4-hour chart.
It is important to note that only a decisive break below the trend line support would suggest the potential completion of the current uptrend.
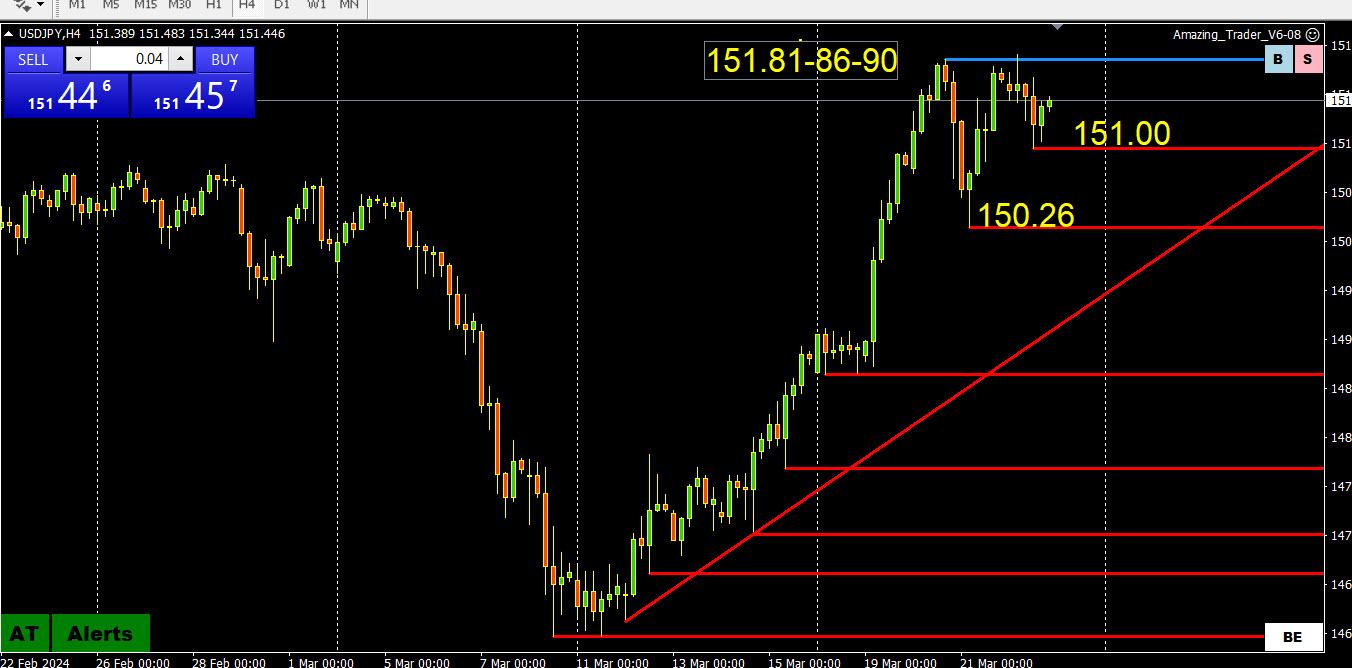
With Goldman raising its 3-month USDJPY forecast (see prior post), let’s take a look at a 4-hour USDJPY chart.
With 151.90 remaining the major resistance (shown on a daily chart), currently protected by 1.5181-86, the current range is consolidating between 150/152, with 151 acting as a neutral midpoint.
The key support is at 150.26. above it keeps 151.90 in play, a stronger risk if 151.00 can become support.
The reason that I looked at the range as consolidation is that the upcoming week is not a normal one
Pre-Easter week and a 4-day long weekend break
A week normally dominated by position adjustment rather than aggressive positioning
Light economic calendar, highlight Friday’s US PCE report
Month/quarter end for many on Thursday with markets closed on Friday-Monday
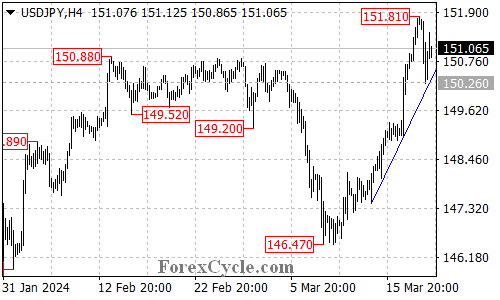
USDJPY has experienced a retracement from 151.81 to a low of 150.26, with the pair now testing the support of the ascending trend line on the 4-hour chart.
If the trend line support remains unbroken, the current pullback from 150.26 could be interpreted as a period of consolidation for the uptrend starting from 146.47. In this scenario, there is still potential for further upward movement towards the 170.00 area after the consolidation phase.
The key support level to monitor is at 150.26. If the price falls below this level, it could indicate the potential completion of the uptrend that initiated from 146.47, with the next target set at the 149.00 area.
My colleagues are of the view June USD and June Yen futures remain Buyer controlled, so the view is any price dips can be confidently bought. Conversely June Euro and Pound futures remain Seller controlled and so any rallies can be confidently sold.
To give some perspective to the importance of who heads the SNB following Jordan who was a strong advocate of currency management, in 2022 the SNB sold foreign currencies worth 22.3 bio CHF. In 2023 under Jordan’s strong CHF policy they sold 132.9 bio chf of foreign currencies (buying CHF). Any step back from the strong CHF policy should have a super size impact….
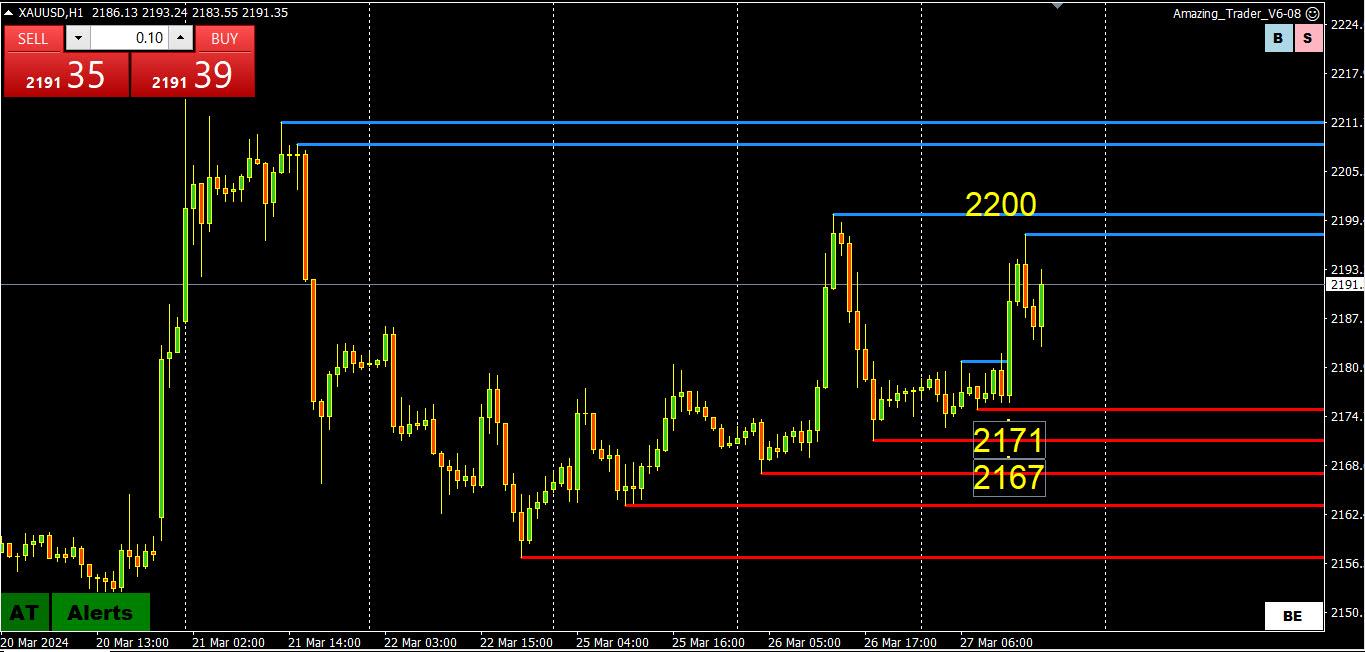
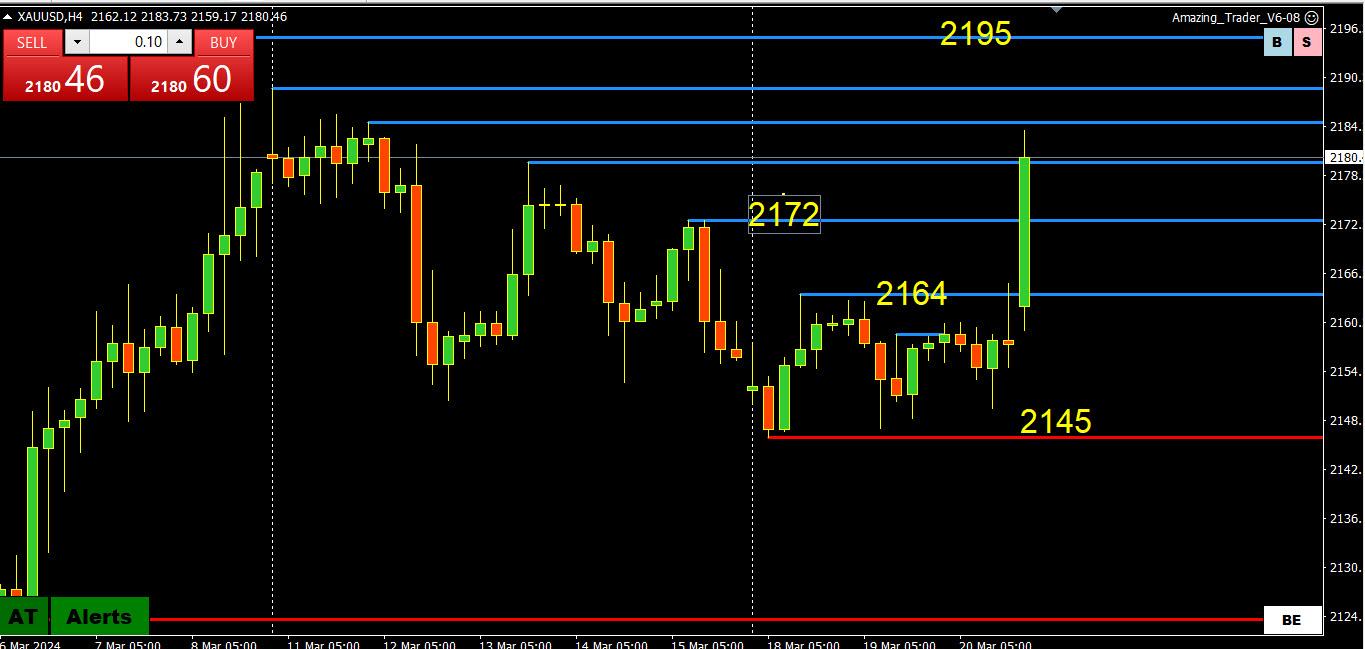
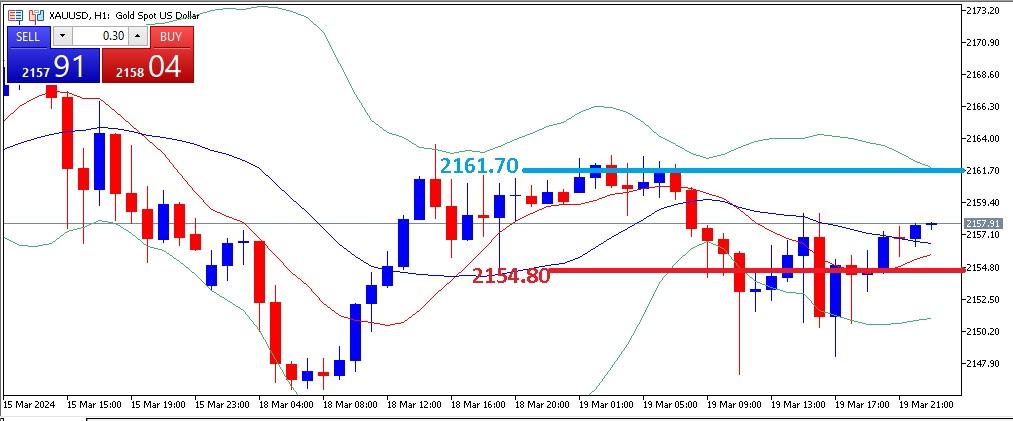
Gold is in a buy mood to reach 2161.70, as confirmed.
2154.80 is the consolidation level; buy below it, sell above it, and tp at it.
____________________________________
2154.80 Reached from 2160.30
USDJPY Analysis: Breakout and Potential for Further Upside Movement
USDJPY has successfully surpassed the 150.88 resistance level, with the upward movement from 146.47 extending to a peak of 151.33.
As long as the price remains above the ascending trend line on the 4-hour chart, there is still potential for additional upward movement in the upcoming days, with the next target estimated around 160.00.
The initial support level to monitor is at 150.35. If the price breaks below this level, it could suggest a period of consolidation for the uptrend starting from 146.47, with the pair likely finding support at the rising trend line.
A decisive break below the support provided by the trend line could indicate the potential completion of the current uptrend.
 Gold is in a buy mood to reach 2161.70, as confirmed.
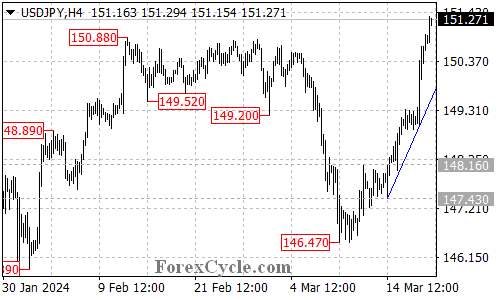
 tp at it.