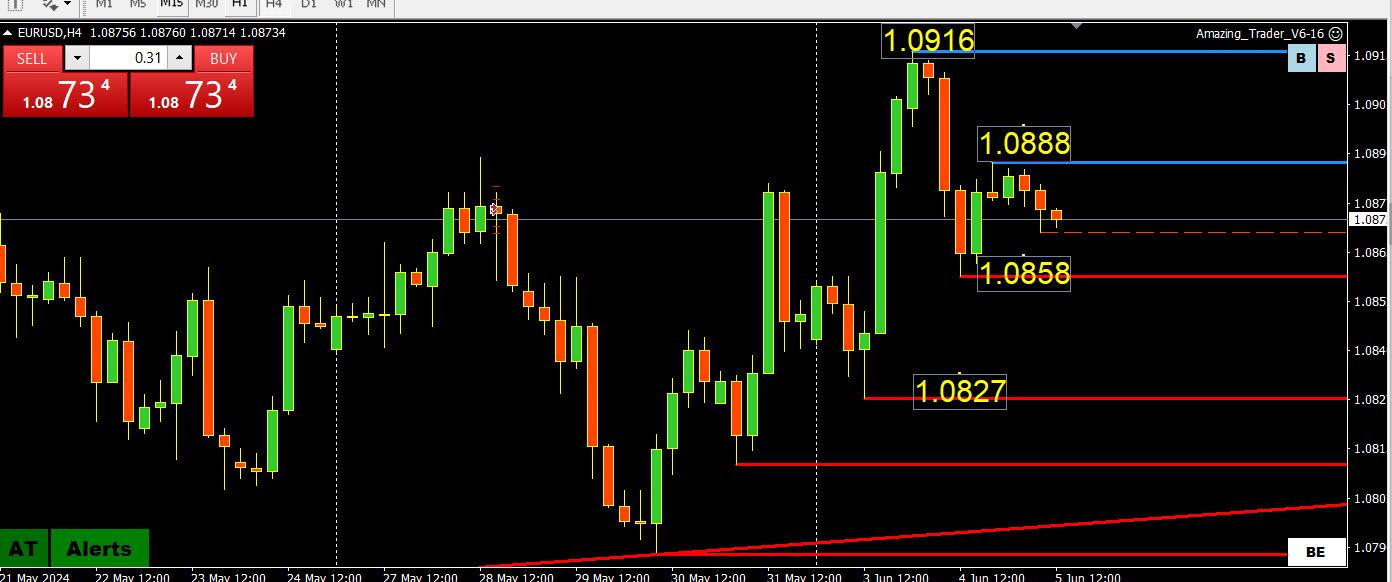
EURUSD seems to be in a holding pattern waiting for Thursday’s ECB decision.
Chart show momentum to the upside but consolidating. A breal of 1.0858 would suggest some risk on the downside BUT only a break of 1.0827 would suggest the high is in for now. Otherwise, trend stays intact.
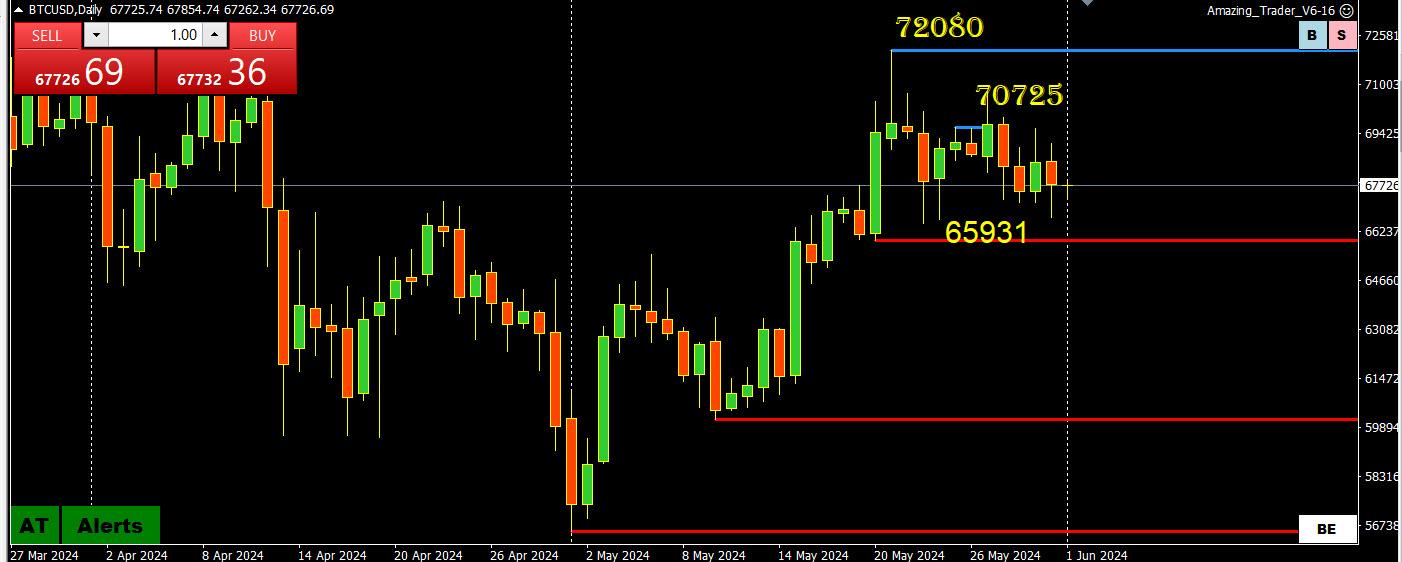
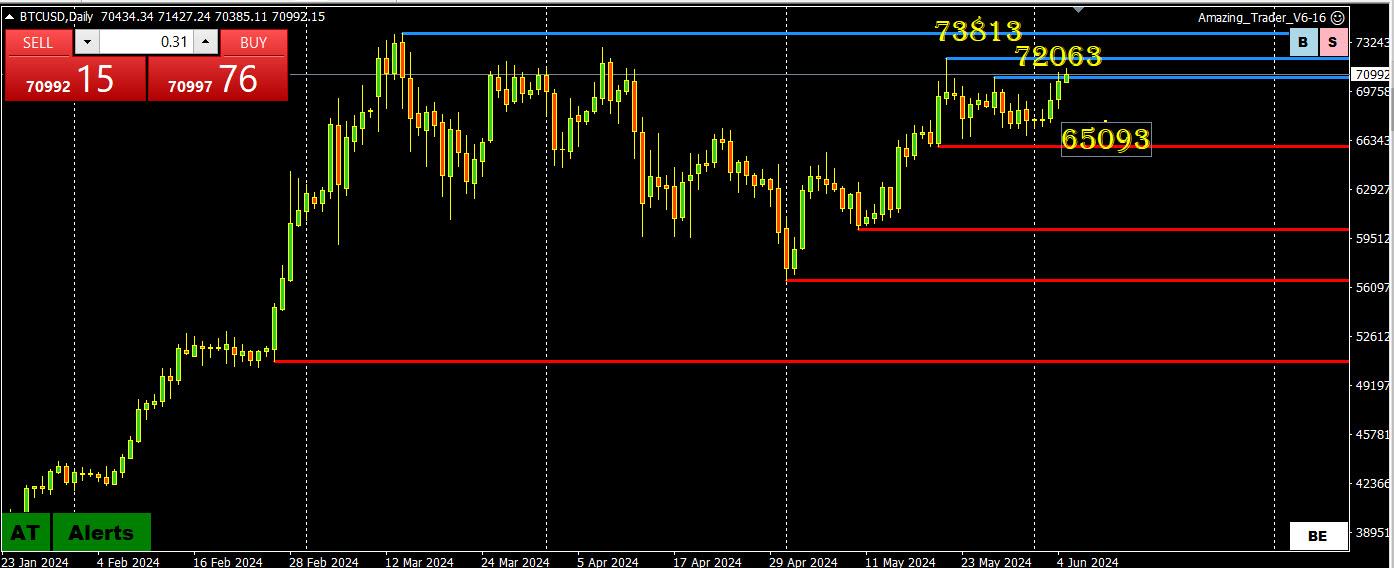
BTC has been flying under the radar lately but as this Amazing Trader chart shows it has been in a consolidation but also slowly building momentum to the upside.
Key chart levels are clear:
‘
If 70K can hold as support there is only one obstacle to the record high.
If 70K fails to hold, it is back to flying under the radar.
re yen 155 market trying to figure out
there is nothing to figure. mof / boj happi slapping backs and high-fiving:
–
The Japan Times
Japan spent record ¥9.8 trillion to prop up yen in past month
The record spending on intervention shows the government’s resolve to push back against speculators betting against the yen.
As I pointed out yesterday USDJPY was showing signs of correlating with the dip in US yields (lower) and getting some safe haven fflows as well (US equities lower).
This has it coming in sight of the pivotal 155 level and as I also pointed out yesterday a solid move bekow 155 would be a game changer as it would shift the focus away from 158 and above.’
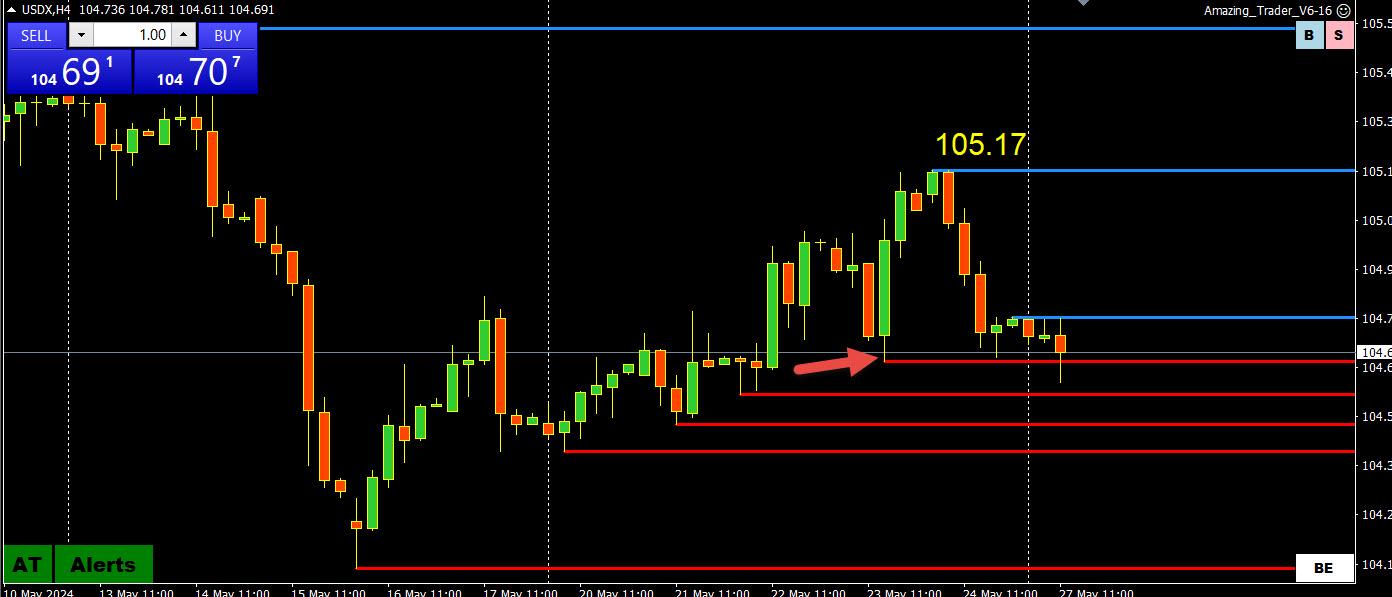
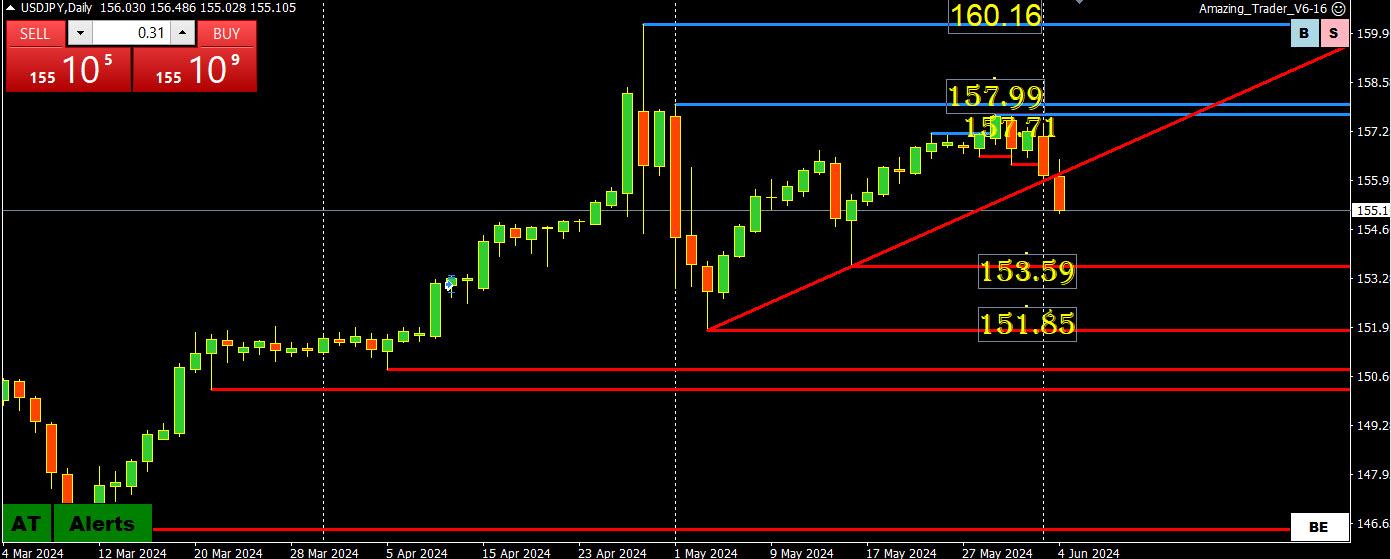
So watch 155 to see how USDJPY trades with key supports shown on this chart
JP – 4:17 It is building, becoming very difficult to purchase a house in the US in populated places. I did workouts coast to coast for a F500 bank and built a tip of the spear company doing the same but as an advocate for consumers while working coast to coast with banks and real estate companies. The “sub-prime” financing was off the charts in the era referenced in that article, sold on the secondary market like hot lead with nothing down half the time, unless you were triple A like Bank of America. I wouldn’t do loans I knew people would default on, for their own good, but there were still tons of them. Then the crash from inflated paper and values. Looks like inventory is high in Florida again.
That is definitely a USD impact and something to keep an ear on one might think.
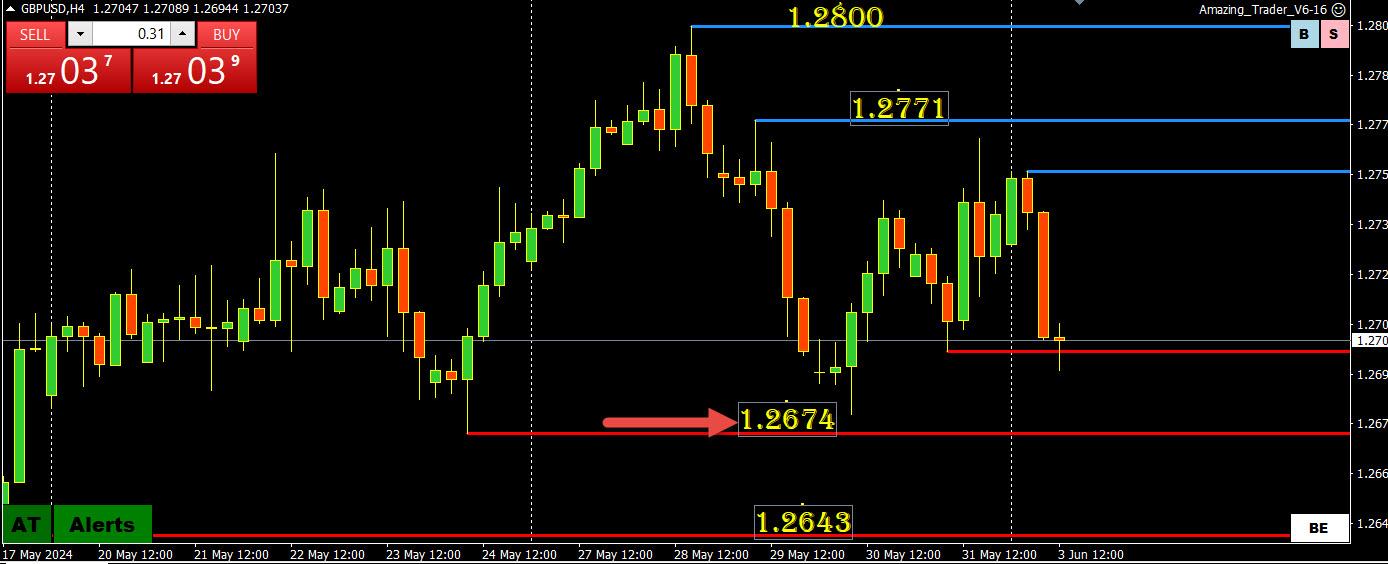
GBPUSD is trading softer with pressure coming out of its crosses (note firmer EURGBP, softer GBPJPY)_
Howeever, Tt is consolidating as well after last weel’s pause above the key 1.2674 level. This is the level that woould need to be broken to confirm the 1.28 faiure and that the high is in for now.
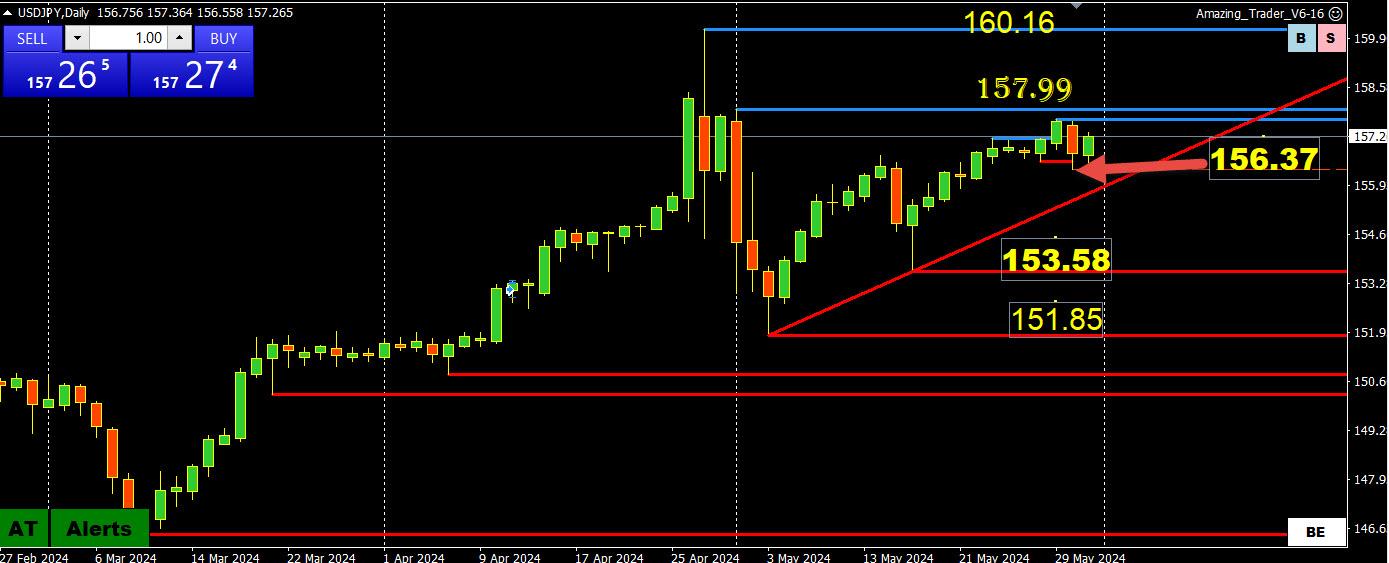
If you take a step back and look at the daily chart you will see that USDJPY spent the month of May trading below the 160.16 high and almost the entire month below 157.99.
As I have been saying, if I was in the BoJ’s shoes I would want to keep it trading below 158.00 lest the focus shift to 160.16 if above it,
There have been bouts of what seems like interventiion (not confirmed) that found support on deep dips (last one was at 156.34).
On the downside, it is easier to focus on the midpoint of 150-160 and use 155 as the pivotal level to set the tone within this range (finds support while above it).
On the upside, expect a limit if it stays below 158.
Normally I would say mark down the prio month;s range but in this case mark down 151.85-160.16.
US pending home sales hit a 4 year low today. One might think the inflation consideration is not as buoyant.
Purchased a penny stock (TELL) in the 40’s that won’t go bankrupt for those of us who dabble. (UROY) is another. Specializes in natural gas. Israeli firm. I like Israeli stocks since they are the anti-thesis of anarchism. Solid market share, common sense management.
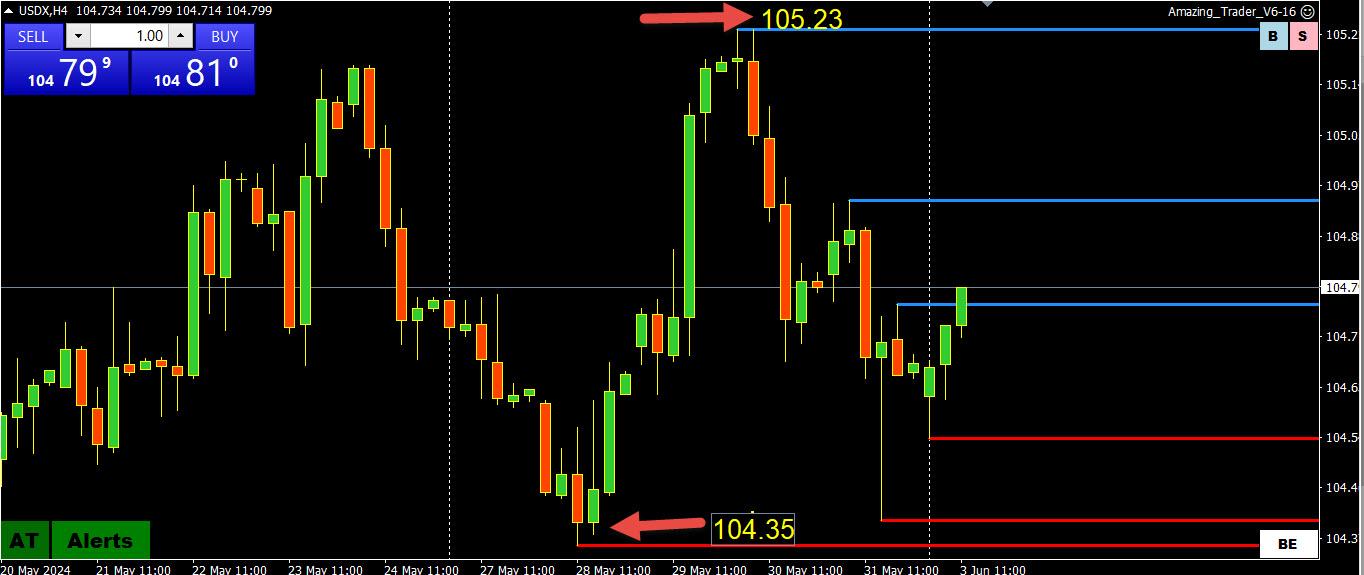
As I noted, with EURUSD representing 57.6% of the index, it often acts as a proxy for the currency.
In this chart, the highlighted red AT line being broken would need to be sustained and then confirmed by a solid EURUSD move above 1.0863 to suggest a potential shift in direction or at least a loss of upward momentum
Note to the forum – Monedge is adjusting its focus back toward primarily serving institutional and high net worth individuals.
If you are an individual just like anyone who does not fit those categories but may be interested in acquiring expertise on a more in-depth basis, we are still accepting clients and will maintain service for you but the window is closing to acquire our assistance if you are new. Therefore if you are interested, we suggest giving us a good look and moving fairly soon to sign us up to help you with your trading results (www.monedge.net) if desired.
And of course, Global View is a rock solid resource for a variety of interests and commentary, and we will continue to post here.
Dxy is finally catching a little bid. Stock internals are negative even though the indices are showing very slight gains. Therefore not sold on much of a risk appetite environment (which would be long Euro) headed into the weekend. Expecting the 10yr yield to hold 44.50 and perhaps close near it, anything happen. Market is parking money and taking into consideration geopolitical and other uncertainty one might think.
HOW IS THIS FOR A NICKNAME FOR THE JPY. WE HEARD THIS TERM FIRST MANY YEARS AGO FROM A FORUM MEMBER AND I NEVER FORGOT IT.
LONDON, May 23 (Reuters Breakingviews) – For more than two decades, investors lost their shirts in Japan. In a trade that became known as a “widowmaker”, they sold short Japanese government bonds with their tiny yields, yet suffered as long-term rates crept ever lower and bond prices rose. Today, taking a long position in Japan’s currency is similarly threatening to shorten the lifespans of investors in the Land of the Rising Sun. Over the past three years, the yen has fallen by around 50% against the U.S. dollar. But there are good reasons that painful bet may pay off sooner.
Nearby forwards on Euro are bid and outside forwards are heavily being sold. Further out picture is not strong for stocks. This and other conditions are affecting Euro, including options/futures.
BOSTON, May 22 (Reuters) – Goldman Sachs (GS.N), opens new tab CEO David Solomon said on Wednesday he does not expect the Federal Reserve to cut interest rates this year.
“I’m still at zero cuts,” Solomon said at a Boston College event. “I think we’re set up for stickier inflation.”
 As I pointed out yesterday USDJPY was showing signs of correlating with the dip in US yields (lower) and getting some safe haven fflows as well (US equities lower).