-
AuthorSearch Results
-
July 2, 2024 at 1:09 pm #8454
In reply to: Forex Forum
only sharp deterioration
–
(Reuters) – The United States, France and major economies are unlikely to halt the rises in their debt levels in the next few years, credit rating firm S&P Global warned on Tuesday. … .. …“We estimate that –for the U.S., Italy, and France– the primary balance would have to improve by more than 2% of GDP cumulatively for their debt to stabilize; this is unlikely to happen over the next three years,” S&P said in a report.
“In our view, only a sharp deterioration of borrowing conditions could persuade G7 governments to implement more resolute budgetary consolidation at the present stage in their electoral cycles”
July 1, 2024 at 7:43 pm #8396In reply to: Forex Forum
US500 4 HOUR CHART – ALSO TAKING A BREATHER?
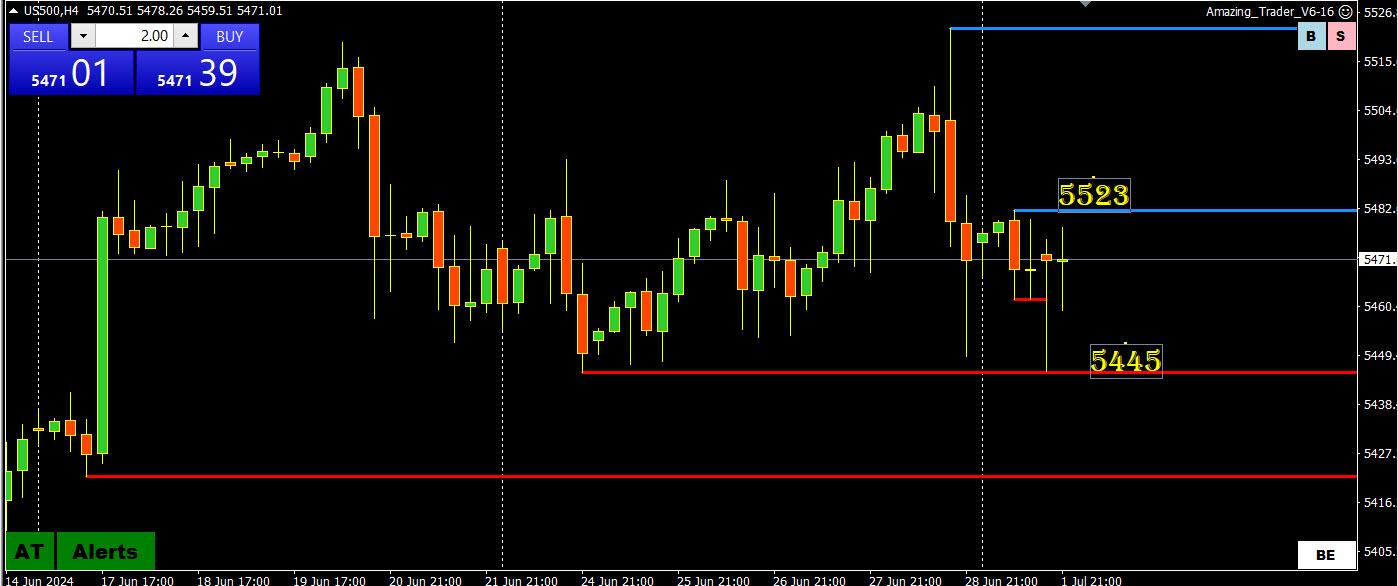
Similar to NAS, I read that July is historically a good month for stocks. Time will tell but I think I heard that S&P has traded higher in July for 8 years in a row.
Given the strong move up a pause and consolidation should noy be a surprise. To suggest more than a pause, 5445 on this chart would need to be firmly taken out.
July 1, 2024 at 4:16 pm #8393In reply to: Forex Forum
Clearly markets are still in shell shock on one side of the fence and exuberant on the other side of the fence over the absolute 1st round knockout of Biden. Now the question is building of when, not if, Trump is President again what will be the impact of tariffs on Chinese imports and markets. The losing side has themselves convinced that the end of the world is nigh and there could not possibly be anything but atomic war and the second coming of Godzilla. I would wager the appropriate reaction will be initial market apprehension and scalable impact to the negative in economics but the broader view will stabilize and actually accelerate in time as global firms make intelligent adjustments to supply chains and the like.
China will be forced to improve quality of product over time, which is a benefit to countries large and small which are being flooded with cheap product that has a crushing effect on domestic performance. So no, Ozzy Osborne (Trump) will not destroy the world. The opposite.
July 1, 2024 at 3:59 pm #8392In reply to: Forex Forum
NAS100 DAILY CHART – TAKING A BREATHER?
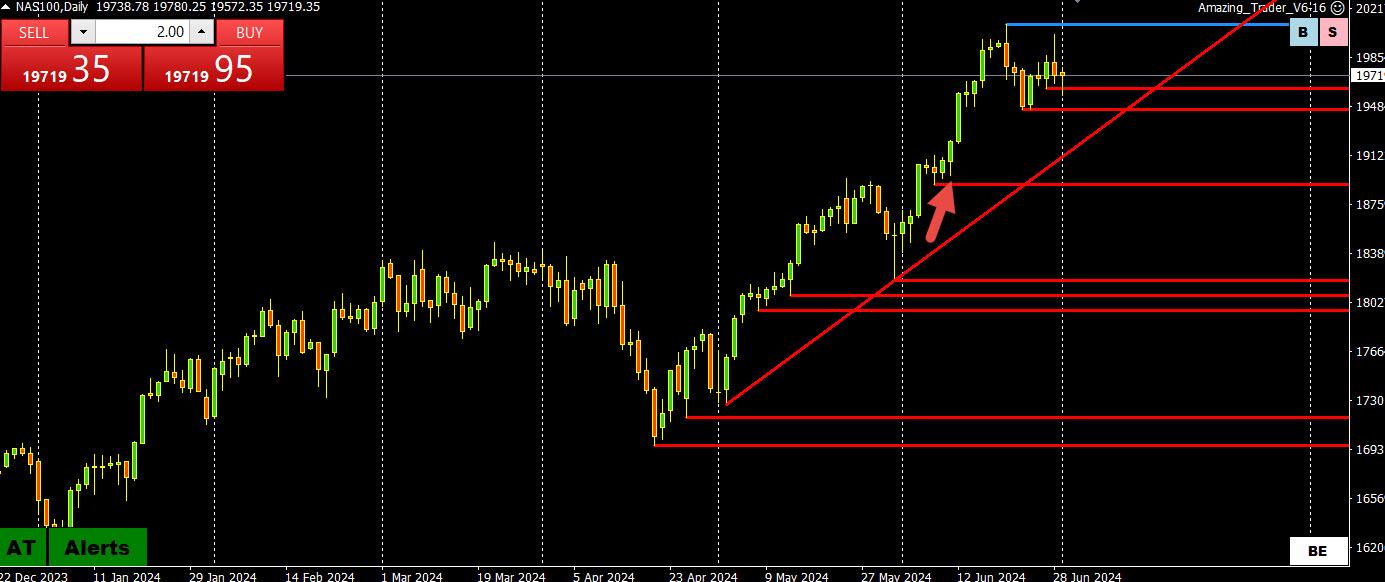
When we look back perhaps we will say the NAS high was in but looking at this chart, the highlighted level (red arrow) and the trendline would need to be taken out to suggest that this is anything other than a much needed pause and consolidation,
During this first week of a new quarter, suggest taking it one day at a time.
I read that July is historically a good month for stocks, time will tell.
June 30, 2024 at 11:23 pm #8317In reply to: Forex Forum
POLITICS and EURO
–
Far-right enjoys massive win in French parliamentary electionsFrance’s foremost far-right leader Marine Le Pen declared ‘Democracy has spoken!’ after her National Rally party secured more than 33% of the popular vote tonight.
The results pave the way for France electing its first far-right government since the Second World War.
Incumbent president Emmanuel Macron’s Rennaissance/Together Coalition, meanwhile, appears to have been trailing at just 22%, which could well mean an absolute majority for Le Pen’s party. … ..
June 28, 2024 at 10:53 am #8216In reply to: Forex Forum
EURUSDJPY DAILY CHART – 1.07 PATTERN
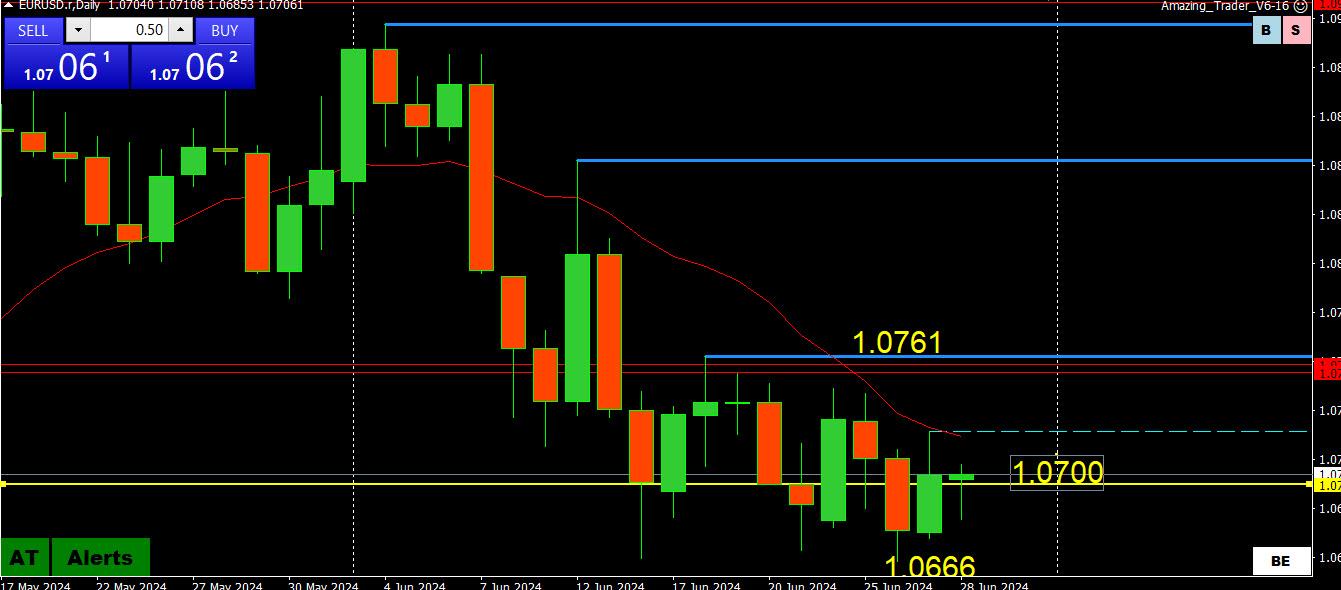
1.07 Pattern Extended to 6 days in a row, rewarding the range traders and penalizing the breakout players.
While trend is still down, the current consolidation around 1.07 suggests there will be a diredtional move once the pattern is broken (either 1.07 becomes support or resistance).
Key levels remain at
1.0666/1.0549/1.0600
1.0745/50/1.0761/1.0800/1.0852
June 27, 2024 at 6:52 pm #8197In reply to: Forex Forum
USD500 4 HOUR CHART – .GLASS HALF EMPTY OR HALF FULL?
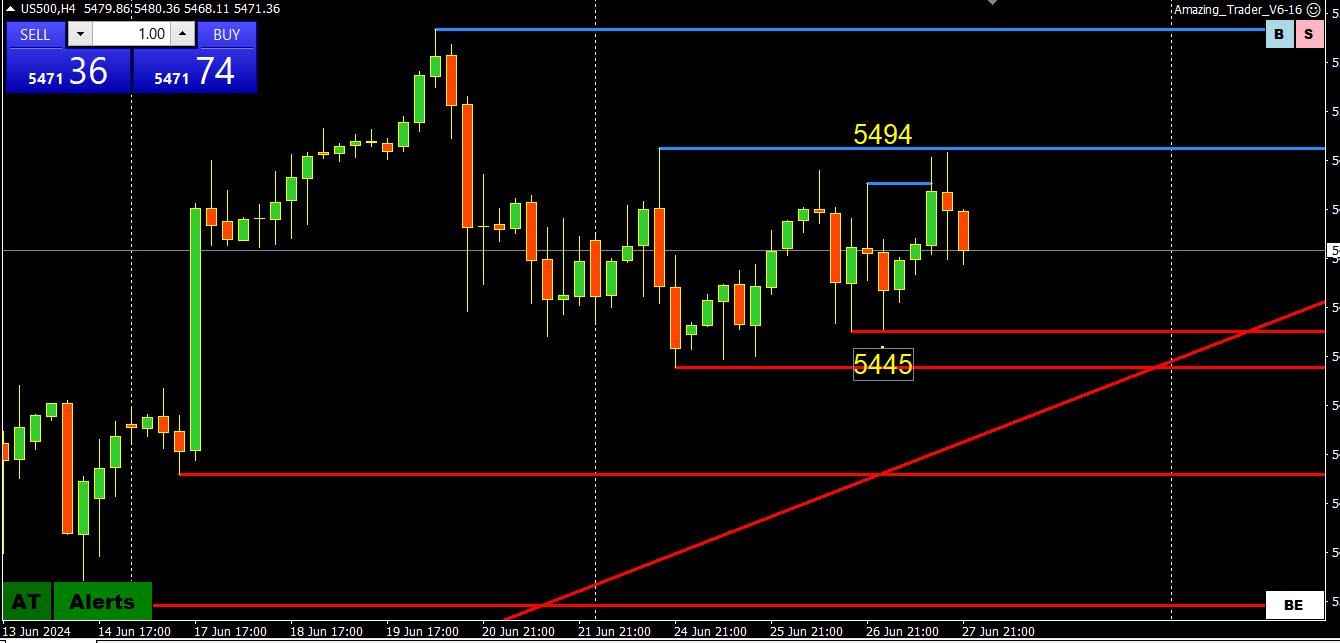
You can get lulled into a feeling there is a top after failing to hold above 5500 but when you look at how far it has climbed this month then some consolidation should not be a surprise.
Looking at this chart, a 50 point range this week seems too tight to last but don’t read too much into what happens tomorrow as it is quarter end.
June 27, 2024 at 4:07 pm #8190In reply to: Forex Forum
JP – I kid not, this is the absolute truth. As a former boxer who was competing every day/night to be a backup on the US boxing team eons ago, and was insured by USA boxing until 2014, this is my take …. What if it is a dual technical knockout? One match we both scored a technical knockout with the very same punch at the very same time and were sitting there on the mat looking at eachother laughing trying to shake it off. Became friends. What if a draw? A lot of wine in homes across the world will have been wasted and the market will not know what to do lol.
June 26, 2024 at 2:34 pm #8133In reply to: Forex Forum
MoF/BoJ are likely waiting for this week’s pivotal US data to conclude and resulting price activity to answer the question of whether to intervene or not. The bottom line, if I were a bank VP, is the Yen simply must begin to appreciate for the good of the Japan economy. I believe it will see 150 region inevitably but that is months down the road, so then if you are on the trade the problem to solve becomes efficient scaling in and out along the way (your boss is happy and the bills are paid if you are taking profits). That is where the endless intra-day battles you endured sharpened your skill levels and you can be pretty good at it.
With reference to the Euro comment and where to position, that is for longs (closer to the low end of a big figure). If going short, you want to make the throw closer to the high end of a big figure. Same for Intra-day (.8 vs .2 or just go .5 to make sure you are in the trade). I am only so confident in the Euro economic performance looking out, and the US is beginning to breathe heavy a little, so being long Euro/stocks is a bit dicey from here but barring something profound the train should keep rolling.
Precision and an awareness of fundamentals both matter.
June 24, 2024 at 2:36 pm #8049In reply to: Forex Forum
I came to the conclusion months ago that UsdJpy had become nothing but a speculators vs Boj game. Almost no legitimate economics, metrics, legitimate market flows, import/export of consequence mattered. This has been nothing but a boxing match once price entered the 153 area. Eventually the BOJ is going to get angry and they will absolutely make a wasteland of UsdJpy through multiple interventions to the point the one’s having fun won’t want to come back and play anymore and will be insolvent or having to explain to the board how they lost $4bil.
June 21, 2024 at 7:37 pm #7952In reply to: Forex Forum
June 18, 2024 at 8:51 am #7819In reply to: Forex Forum
EURUSD 4 HOUR CHARTT – PAUSED BELOW 1.0745
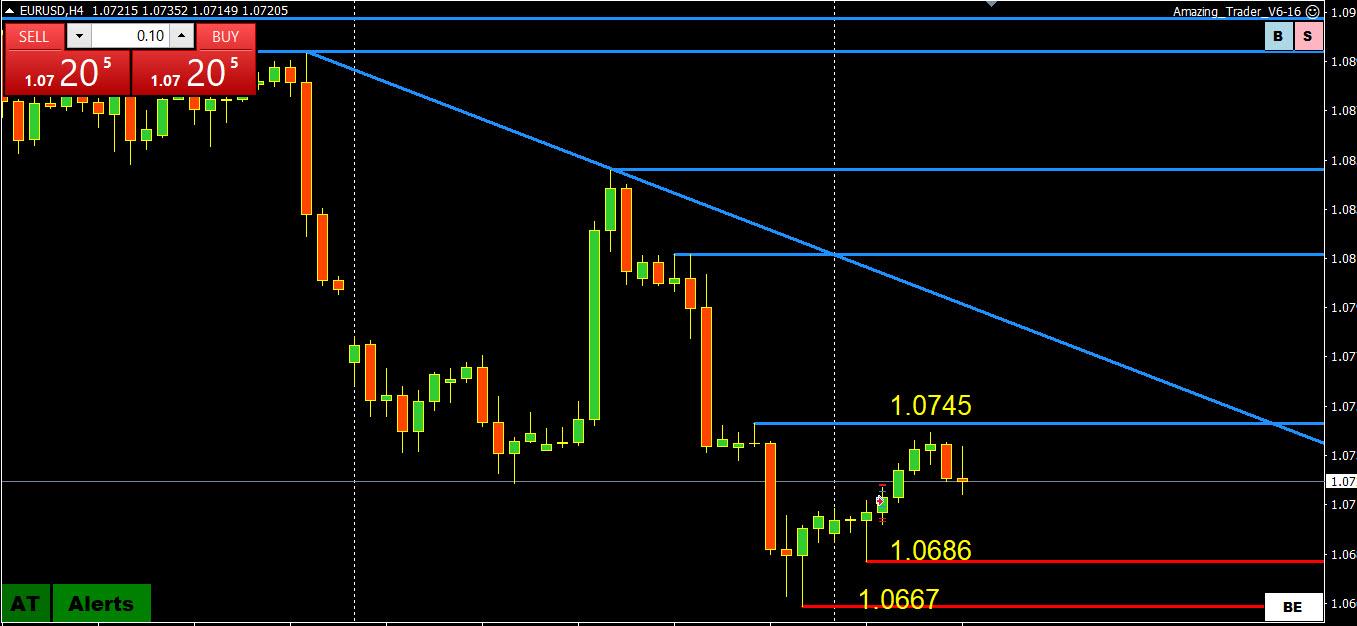
The two red lines drawn off the low is an Amazing Trader Directional Indicator pattern that has signaled a potential change in direcdtion.
You can see how that worked out. coming close but pausing below the key 1.0745 blue resistancde line.
So, all we have now is consolidation with key levels highlighted on this chart.
I posted this yesterday…
In a politically driven market (French electio) a key is to identify when the market is trading on this upcoming event and when it is in the background.
This chart is clear —
Key levels are at the 1.0667 low (major levels 1.0649 and 1.0600) and 1.0745 (suggests limited upside unless 1.0750 trades, stronger bias if it stays below 1.0719
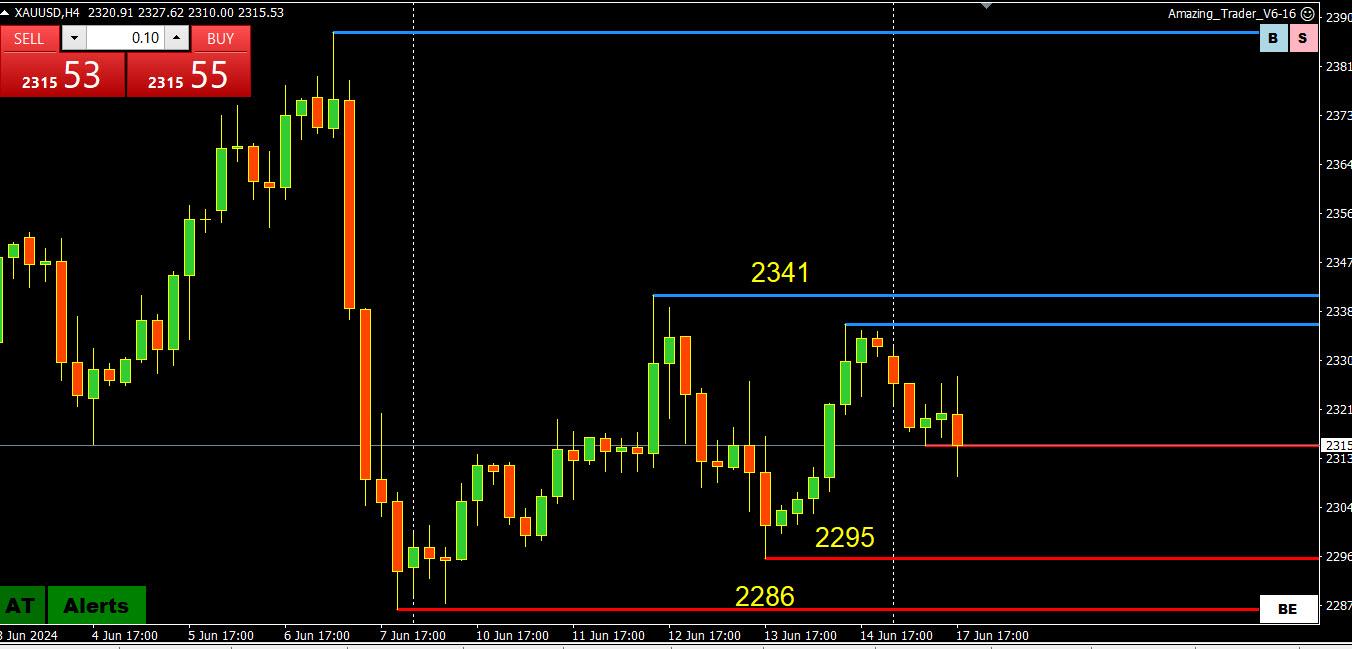
June 17, 2024 at 5:47 pm #7805In reply to: Forex Forum
June 12, 2024 at 9:50 pm #7632In reply to: Forex Forum
So I saw the same old thing yesterday pre-data, with the stalls and the contra-activity. If they are buying into data that heavy what do you think they are doing? Is big money confused? Is it a conspiracy? No. They are running 100k times what you do. They compete with other banks who don’t oblige to be on the same team. So, price discovery happens. Big guns win every time. Right now the market is dazed and waiting for the next conviction post-Fed. Something is going to break. My thought is maybe not the Fed. So unless something profound changes it is hgher for longer and they will price in mistakes. Dollar is bid, which is why I sold AudUsd this morning vs Euro because they are a little fluffy over there. The only thing that would make Aussie go higher is a gold run or war. From here.
June 12, 2024 at 3:01 pm #7603In reply to: Forex Forum
Since it is pre-Fed why not discuss approaches a little.
The benefits of momentum positioning are solid on days like this. Picking levels can be either a fun challenge or a maddening puzzle, depending on the result. Ultimately even with momentum positioning you are picking prices. One of the key differences is momentum trading doesn’t execute until the market actually does what is necessary to result in momentum. Which is 100% proof of market conviction. What constitutes valid momentum? Distance or velocity? A bit of both. The problem to solve is the ebb and flow of momentum, which can be deceiving as momentum can wane, thus causing one/one’s system to interpret that as a reversal, when it is just a pause, or indeed a reversal. Determining which is vital. Viewing UsdJpy it appears to be bottoming at present. Is it really? What does a group of large institutions in the background working together to game the market think? They are what matters, they make the market. And they include sovereign sources just as much as banks and the like. Knowing what/when/where NOT WHY is what matters. Your opinions may not match there’s.
So how do you determine what those market makers are planning right now? Do you know in your bones it is a grand conspiracy for “The Great Reset” as some with almost zero true knowledge or understanding (primarily Millenials and Genz) think? Or is it that you are a wizard who figured it out on your own?
Or is it a safer bet to simply trade the market’s momentum?
I had a real competition, in a real office, with real CTA’s and bankers in attendance one day (there were more than just one day) and a myriad of “styles” went at it in friendly competition. The top and bottom pickers came out on the losing end of that ball game as well as the level pickers. Was I successful picking levels? You bet. Was I successful with the momentum? You bet. The level picking was the most eye catching and impressive. Until it is clear you really are guessing. The participation in options and futures contracts every guru likes to claim as their key to knowledge can change swiftly and is disguised. Extensively.
Sometimes it pays to simply trade momentum. It can be learned.
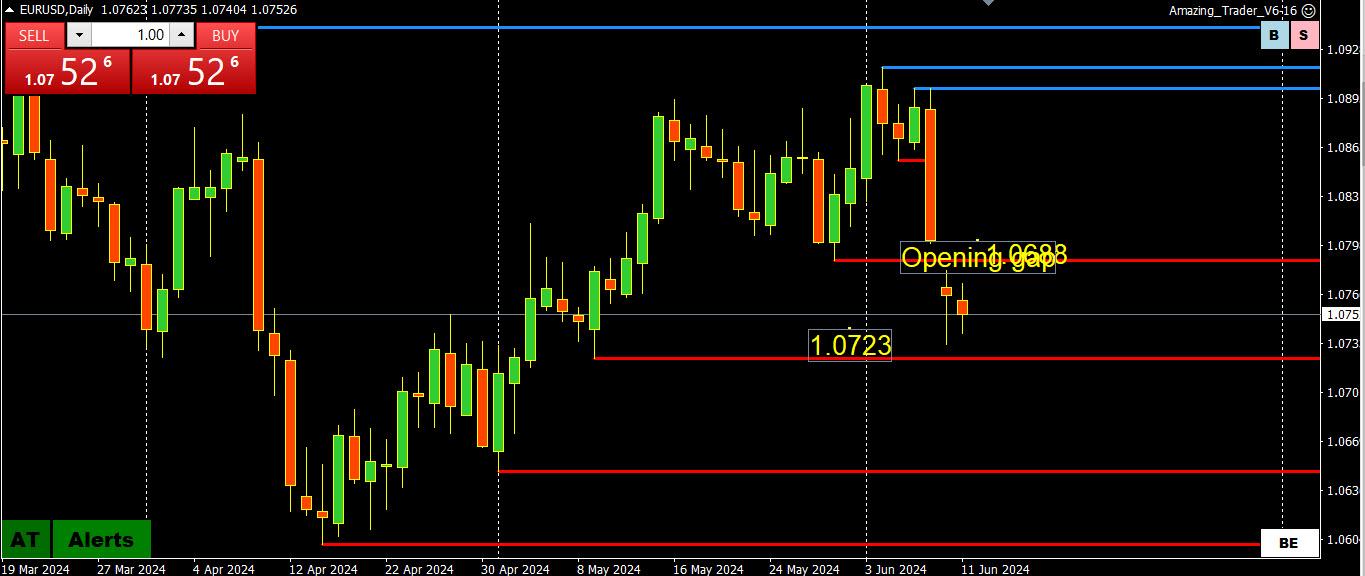
June 12, 2024 at 8:43 am #7588In reply to: Forex Forum
EURUSD 4 HOUR CHART – HAS IT BOTTOMED?
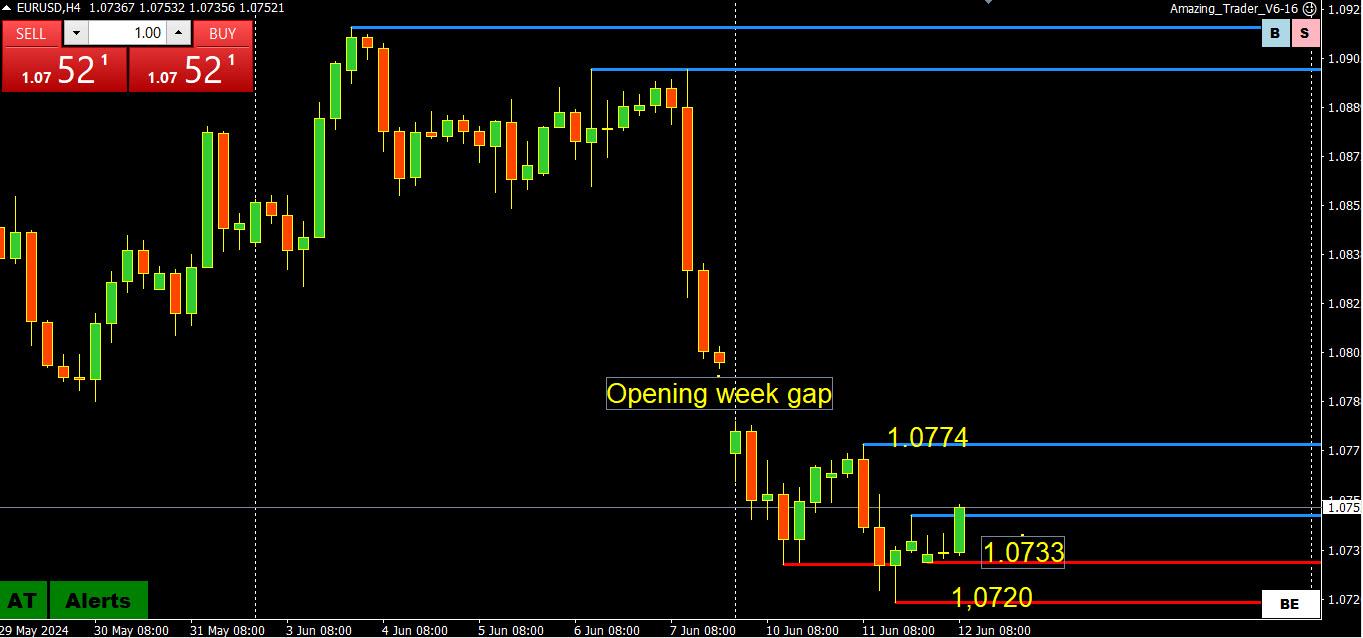
One way or another the gap should be resolved today depending on how markets react to US CPI and the FOMC.
Using Amazing Trader logic, the second red line on this chart (1.0733) forms what is called a Directional Indicator, indicating a potential change in direction.
For this to play out, 1.0733 needs to hold as supportand 1.0774 would need to be taken out.
In any case, for filling the gap to be a risk, 1.0719-20 would need to become support. Otherwise, the downside is at risk unless the gap is filled and more.
With all that said, 1.0750 will set he intra-day tone on a day where the reaction to news will be more more important than the news itself.
June 11, 2024 at 5:29 pm #7579In reply to: Forex Forum
June 11, 2024 at 10:01 am #7539In reply to: Forex Forum
June 10, 2024 at 10:33 am #7488In reply to: Forex Forum
A look at the day ahead in U.S. and global markets by Samuel Indyk
The expected rightward shift in the European Parliament after a four-day election has still managed to jolt European markets as gains for the far-right in France prompted French President Emmanuel Macron to call a snap parliamentary election.
French bonds and stocks were sold off while the euro dropped as political uncertainty had investors heading for the exits.
June 7, 2024 at 12:47 pm #7410In reply to: Forex Forum
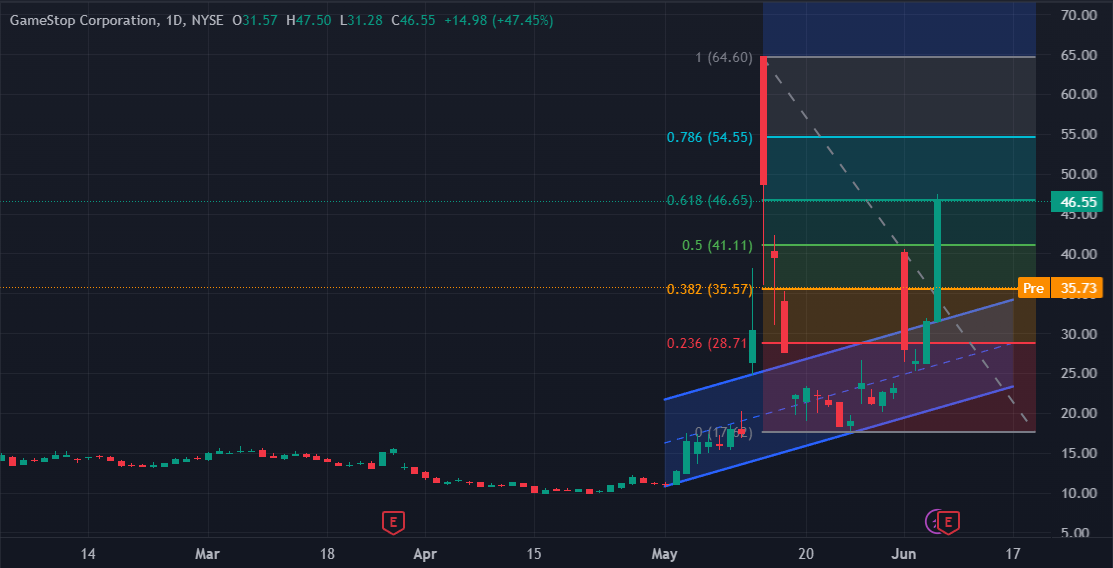
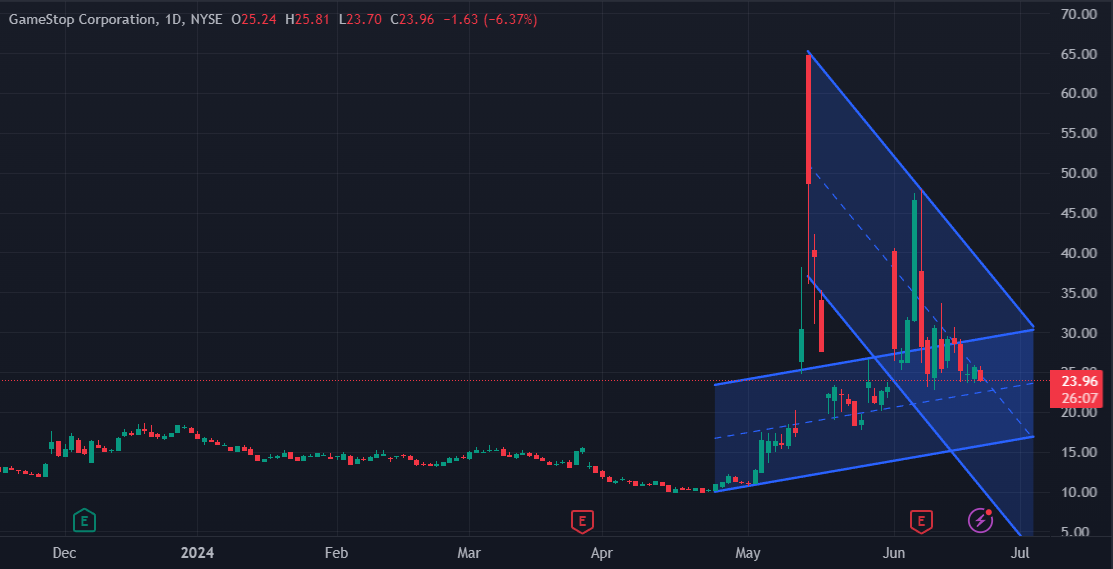
I have been very bearish on GameStop GME, mainly due to key fundamental factors. The company continues to see revenue deterioration and the ultimate impact of online competition should render its business model obsolete over the very long term. That is why there is so much short interest in this name.
However, GME stock has been skyrocketing in recent days, surging more than 45% yesterday alone.
This recent surge is thanks to Keith Gill, also known as Roaring Kitty on YouTube and DeepF——Value on Reddit. Today brings yet another key Roaring Kitty catalyst, and GME stock fans should be watching closely.
-
AuthorSearch Results
© 2024 Global View