-
AuthorSearch Results
-
July 21, 2024 at 8:23 pm #9428
In reply to: Trading Academy Q&A’s
Alan, your question is very interesting one .
I am going to give you how I treat this issue – so not an opinion or guide !
Being a midsummer and all, it is not uncommon to watch market behaving like grass growing…
In my strategy there are only four options :
– I prepare myself for longer waits and much longer hours in front of the screen
– I accept smaller profits ( like half of usual)
– I go with the smaller time frames
– I join the crowd and go to the beach
But I never go looking for some other pair/instrument.
To be able to achieve continuous profits, you have to live and breathe the instrument you want to trade.
Trying to get right some other pair that you find currently moving can bite you back.
Now i am not saying it is not possible to switch within pairs, but for that to be profitable you must have previously done homework, clear strategy, fixed R/R and Risk management , and that is not really possible to do seriously ad hoc.
There are significant differences between different pairs – from the spread, size of bars on any given time frame , all the way to possible slide both ways…so very difficult to apply exactly the same rules to different instruments.
They can also react on Data even opposite , but at least sometimes muted sometimes exaggerated.
In reality, you would need at least a week to prepare another pair strategy, until the move will be already done…and in the mean time your primary pair might just move again…
So I gave honestly how I deal with it – if you have any other ideas, please share it here with us…we might get to some other solutions.
July 20, 2024 at 10:58 pm #9403In reply to: Forex Forum
NEW YORK, July 19 (Reuters) – As earnings season goes into full swing, bullish investors hope solid corporate results will stem a tumble in technology shares that has cooled this year’s U.S. stock rally.
Wall St Week Ahead: Investors count on earnings to calm $900 billion US tech rout
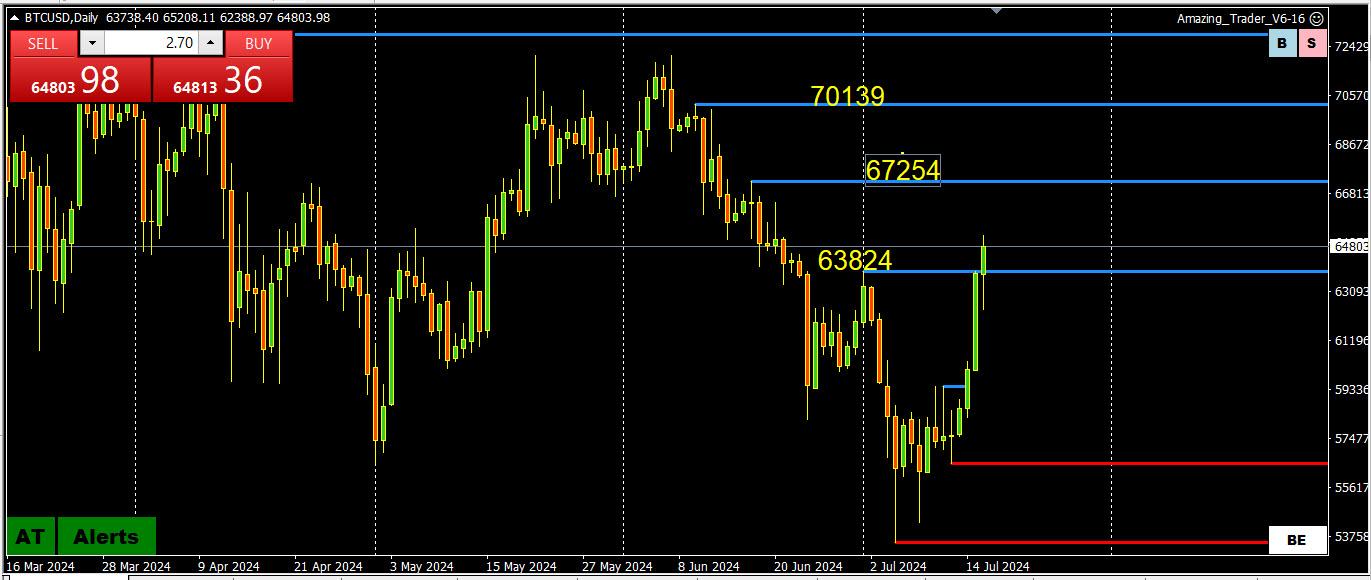
July 18, 2024 at 8:56 pm #9341In reply to: Trading Academy Q&A’s
Well Robinson this is now Way better !
Two things :
– If they break below that trend line that was a resistance before – now support , they will negate the whole Up move
– Add another parallel trend line on that absolute low that we see on this chart
– To me this looks Bearish right now
But opinions are like underwear – you change them every now and then J
Now professional advice : If you Buy it, be sure that your Stop loss is locked in – it is not a problem when you are wrong, but it is a disaster if you are wrong and don’t have a Stop.
July 17, 2024 at 11:44 am #9261In reply to: Forex Forum
July 16, 2024 at 8:59 pm #9219In reply to: Forex Forum
July 16, 2024 at 10:06 am #9177In reply to: Forex Forum
July 16, 2024 at 9:55 am #9175In reply to: Trading Academy
Channels Within Channels
To be able to determine the Current Direction of the market, it is enough to draw a trend line, make a parallel to it and you get a channel.
But how to determine how far that trend can go on….how to place stops and profit taking targets?
You have to find Smaller Channels within the big one.
Here I draw a Monthly EURUSD chart.
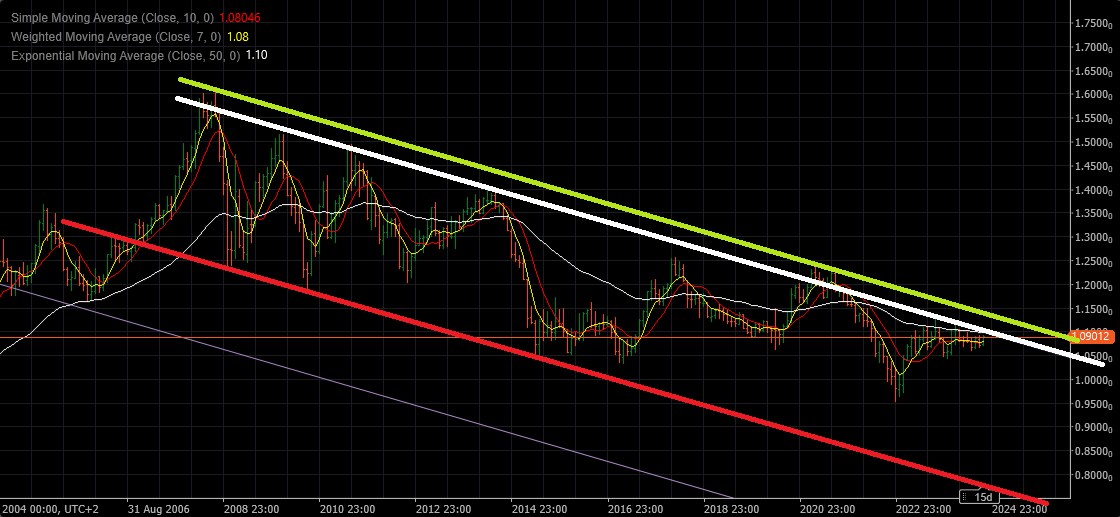
First I draw that Red line : as that was the first time I had a possibility to connect two dots on chart , using the angle that I have from past.
So as you can see from this chart, I was using Support line to create the possible Resistance later on – and obviously it worked.
As you can see it comes later on as a Support
White line was second – the moment when I had two highs that I could connect with the parallel line ( parallel to the red line)
Much later ( in 2020. ) I added the last one – Yellow line
So we have a Big channel – without previous experience . historical trend lines , having the right angle for the lines, and creating the channel , we would have a real picture much much later – and that is usually the moment when the market start to change the direction…so no good
Next step was to draw Smaller channels within the big one:
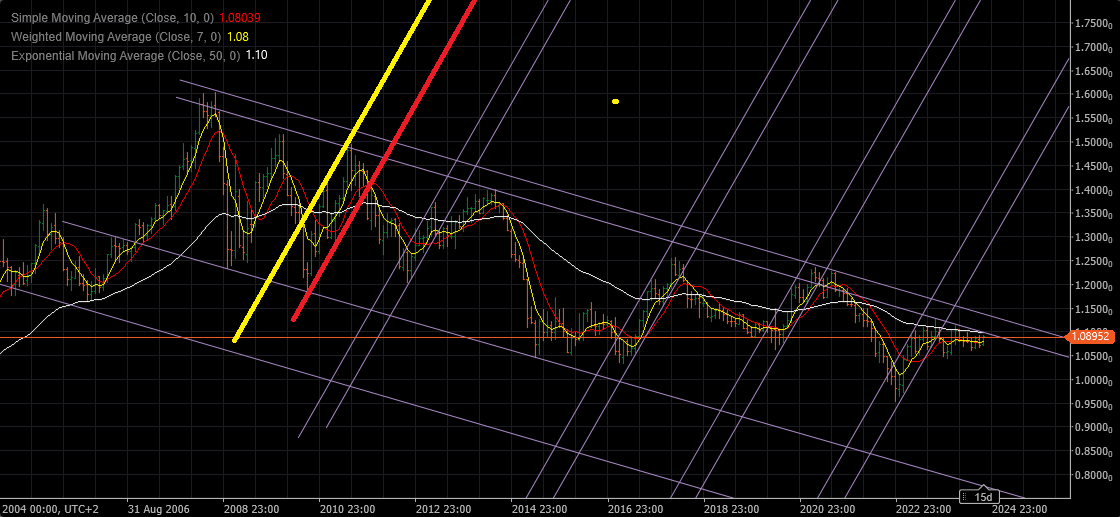
First Red line , then Yellow and later on others as time was passing by.
As you can see, there is a Rule – Once the market figured out that we are in the down trend and what are the borders of the channel, Up moves started to create narrower little channels – and they are almost exactly the same.
Now it’s easy to draw it when you have all the levels ( tops and bottoms ) but in reality it is more of a Trial and Error game – you try these lines on every new high/ low until you see the logic of it.
Forex is a game of educated guessing, probability , risk management and strategy.
Once you get accustomed to drawing your charts like this, I am sure your views will widen and you will be able to understand what’s probably coming next.
Be aware that there is no technique that is absolute – there is always margin for error , and your job is to keep it as small as possible.
July 15, 2024 at 11:49 am #9138In reply to: Forex Forum
July 13, 2024 at 9:02 am #9094In reply to: Forex Forum
July 12, 2024 at 6:41 pm #9074In reply to: Forex Forum
Jay – it is order based so yes. There are occasional times it ends up being close to any number of indicators but absolutely not the same and extremely reliable. It will coincide at times with a moving average point, other times a stochastic point, other times options orders, other times bollingers, on occasion volume profile, other times you name it. But if you think you will manufacture by using those things you will not end up with the same result. My best version was done on Esignal, which you have to pay a lot of money for. Currently using a hybrid which is not as good but close enough.
July 12, 2024 at 5:47 pm #9070In reply to: Forex Forum
Jay –
Point of control is where the more weighty transactions take place for any given instrument. While there is no guarantee that those areas will be revisited in the fashion I noted earlier, but the probabilities are very strongly weighted they will. That is due in part to the fact that large orders from large institutions/entities transact there. This is based on decades of factors of input for analysis, with the result being solid in terms of probability. One of the better forms of imagery I could compare it to is a volume profile. Be advised, this is not a volume profile and you will not find it there. But in some ways there are similarities. Having it is step one. Step two is application that actually works. Requires dedication.
July 10, 2024 at 10:53 pm #8918In reply to: Forex Forum
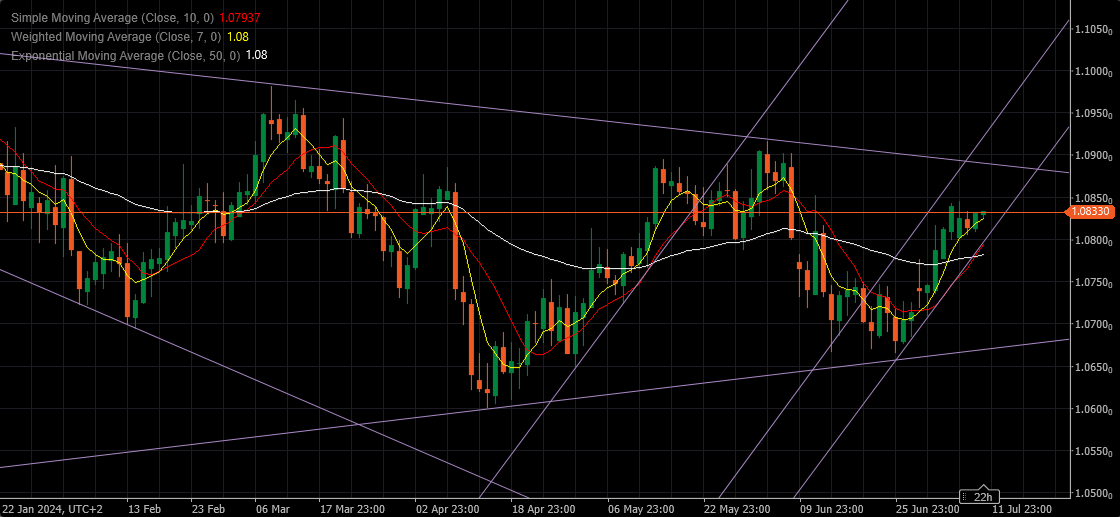
EURUSD Daily
Supports at : 1.08200 & 1.08000
Resistances at : 1.08450/500 , 1.08700 & 1.08900
The angle is right, Pattern very Bullish – two options :
It hits straight to Resistance at 1.08900 – in that case probability is it will Fail to break
It takes a breather and few days of consolidation – in that case we go through the resistance and about another 200 pips up from these levels, just to meet the Major Resistance line at 1.11
 July 10, 2024 at 10:39 pm #8917
In reply to: Trading Academy Q&A’s
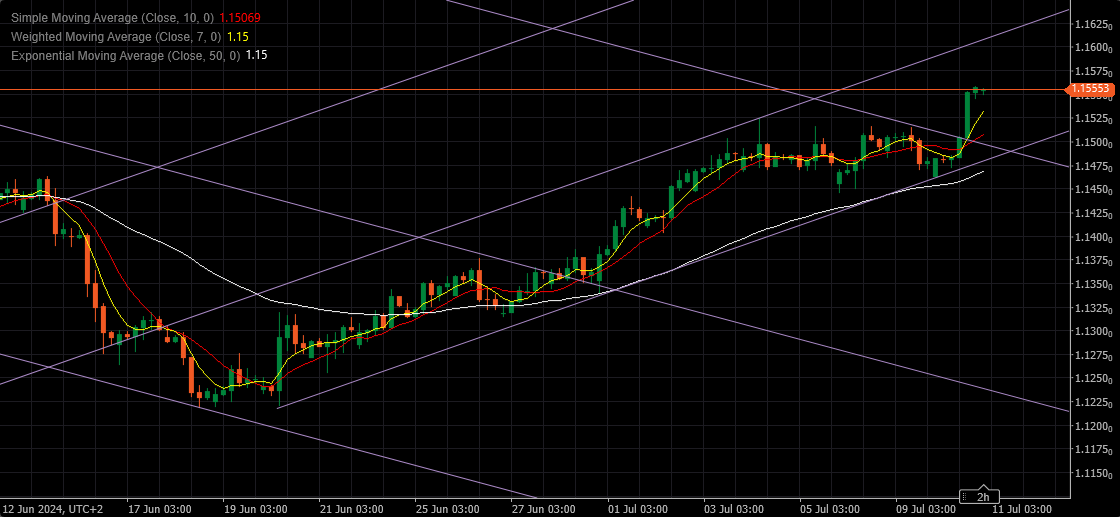
Yes Robinson it was 😀 Now go back to my chart below – the resistance trend line that was cloned ( so hypothetical trend line that I placed on previous Uptick without any other reason except that it follows the angle that repeats itself ) had obviously tons of stop losses just above it .
Broke it and opened a new bar just above it –Buy ( 1.15038 – Stop at 1.14980 -5-6 pips – we’ll talk about Risk Management later in the game)
Now look at my chart with drawn Channels ( yes I am going to be obnoxious with these channels till you all accept it and start drawing them ) – there is a clear picture in front of us.
Obviously it will try to reach for the top of that channel – possible consolidation prior to it )
And to conclude the lesson : these trend lines of mine are working every single time – practice drawing them !
To be able to survive in this game you cannot rely on your gut feeling or opinion, but on full strategy and what you see in charts.
 July 10, 2024 at 4:54 pm #8895
In reply to: Forex Forum
Had a brief call with someone I respect tremendously yesterday (Jay) regarding EurGbp. My metrics show the pair remaining offered on buy cycles toward 8450/60 area for now.
On Crypto and the FED and Stablecoin – It is difficult to substantiate the thought that all crypto vehicles will be buried once the use of Stablecoin is established, but the ones that survive will be Bitcoin and a few that help the poor in poor countries, or offer something solidly unique and useful within realistic value of use.
A lot of talk from politicians regarding bank stability should a shock arise during the Powell testimony. As I noted yesterday, major US banks recently roundingly passed stress tests and technology is improving. The one issue concerning me is the effect of a major cyber attack should it occur and/or flat out war with the US and another major power(s), which one would think is unlikely unless some insane person gains access to terrible weaponry. Otherwise the banking industry looks strong.
July 9, 2024 at 12:55 pm #8798In reply to: Forex Forum
Some metrics including options, forwards, open interest etc are showing a solid bid at current levels. That matches the larger bid cycle but it is against the grain of the recent closer in selling. Market is looking bid further out, so the pair either likely fails and dumps today post-Powell or goes on another run up the hill.
July 8, 2024 at 11:22 am #8715In reply to: Forex Forum
July 7, 2024 at 12:37 pm #8672In reply to: Forex Forum
July 5, 2024 at 5:50 pm #8627In reply to: Forex Forum
July 3, 2024 at 1:36 pm #8528In reply to: Forex Forum
Weeks ago a highly skilled trader and genuinely good person asked me which entities I thought are behind most of the rate, currency, and alternative flows of late. I track a lot of information on a daily basis to the point you would think I run a bank. There is no question that UBS, Goldman, Barclays, and Morgan Stanley are considerably aggressive in testing new markets and participating in staples. Considering the logistics of the firms, one could argue a weighty portion of market activity is from somewhat politically neutral sources regarding US politics and market allocations. Ultimately their primary function is to produce solidity and return for investors is it not? I like that aspect of the current markets-wide participation climate.
Outward US bond shorts are increasing after the 1st debate in the US, indicating higher yields for longer in the eyes of those institutions should Trump be elected. Should Biden or a different candidate be elected from the democrat party one might argue that dynamic is likely to completely be the opposite, which is why those banks are taking those rate oriented positions in strategies which allow them to maneuver if so. Significant market players are doing a very good job of forecast positioning. Major institutions also heartily passed recent stress tests, which test their ability to withstand sudden market shocks. Something to consider looking forward.
July 3, 2024 at 1:00 am #8496In reply to: Forex Forum
-
AuthorSearch Results
 f
f
© 2024 Global View