I found the comments from Michael interesting due to, in part, that I am and remain a verifiable Quant. Not Youtube Quant but real Quant. A Quant who has actually run an investment firm and had coffee over a chair in multiple cities by invite, all paid for. It is how this CTA approaches markets. That said, After careful analysis I believe that person is almost absolute in analysis.
Very simply, if you take a breath and look at the math “vibration” there is a median in markets which will be met 100% of the time. What matters as an active trader is your timing within the timing. That is difficult.
For example, anyone can say that Euro will hit Ysquared in time. That would be theoretically correct regardless of indicator. The variables is what causes discount in equations, factors that cannot replace real time motion.
And so, you must factor such variations. Which is why such things as standard deviations of 3.0% and 3.5% matter more than the usual 2/0% deviations that you hear about on any given form of media, including the more popular formats.
After back testing and real time performance, the back testing is garbage in real world scenarios when you are on the phone with a major broker. They can tell if you are a skilled linguist or for real.
I concur with the mention of vibration in markets. I have a deep past with calculations that lives depend on, and so there is no room for variance.
I felt it important to acknowledge that prior to making a call for the end of week price level in various currencies. My hit rate is 98.6%.
How you approach it is what matters based on how you attack markets and your existing tolerance levels.
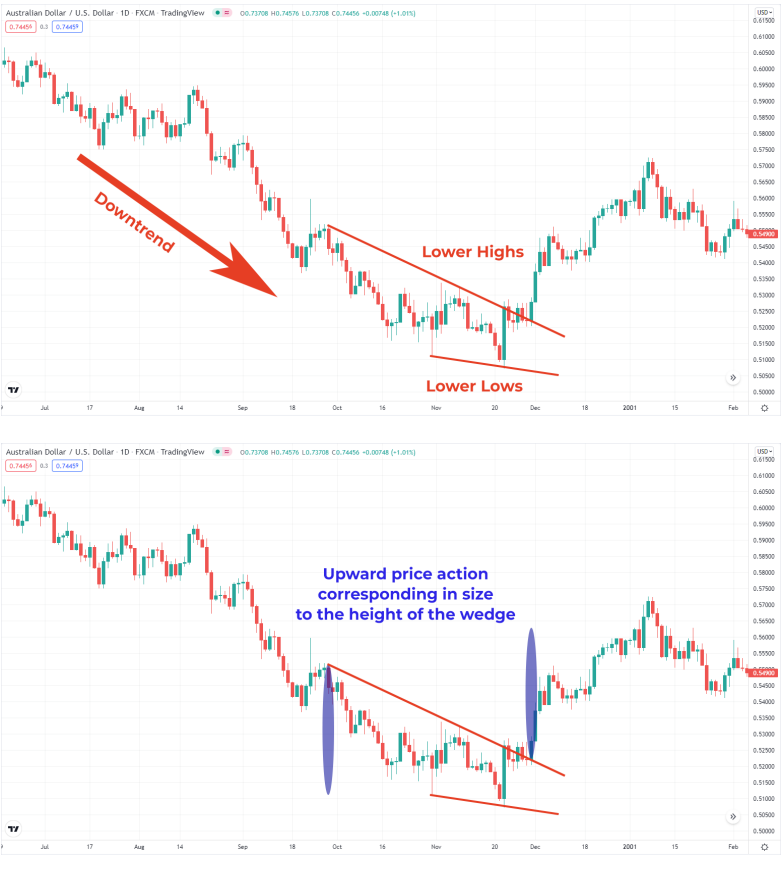
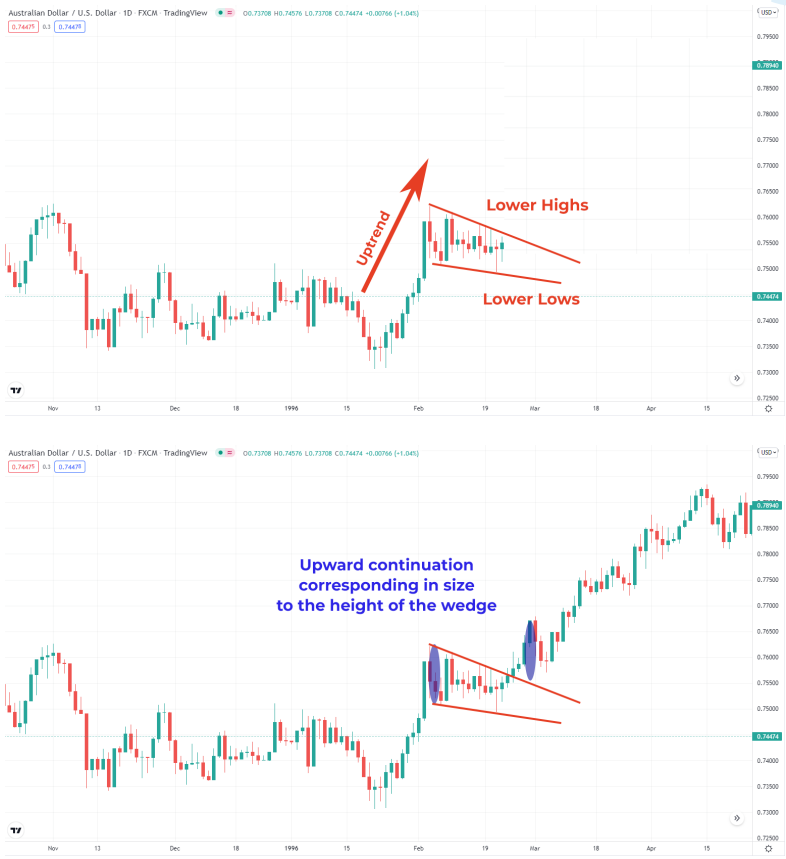
A falling wedge is a bullish chart pattern that takes place when the line slope points down and the trend has been pointed up prior to this occurring. This pattern may indicate that traders are taking a moment to get caught up, but that they are likely to want to push the pair even higher once they are ready to resume the trend.
Key Notes on Falling Wedges:
1. Often leads to an uptrend, which means it’s a bullish pattern 2. Indicates that lower highs are being formed faster than lower lows 3. Falling wedge formation after a downtrend is usually a bullish reversal pattern 4. Falling wedge formation after an uptrend is usually an upward continuation
Why Wedges Matter
Wedges are important in trading because they can serve as either a continuation pattern or a reversal. They work both ways because they are simply signalling that consolidation is happening in the market that you should probably take a look at. When you see these patterns forming, you want to make sure you do not ignore them.
Think about using wedge pattern formations in combination with indicators that may help confirm where a trade is going. This may prove useful to you as you try to figure out exactly how to place the right order at the right time.
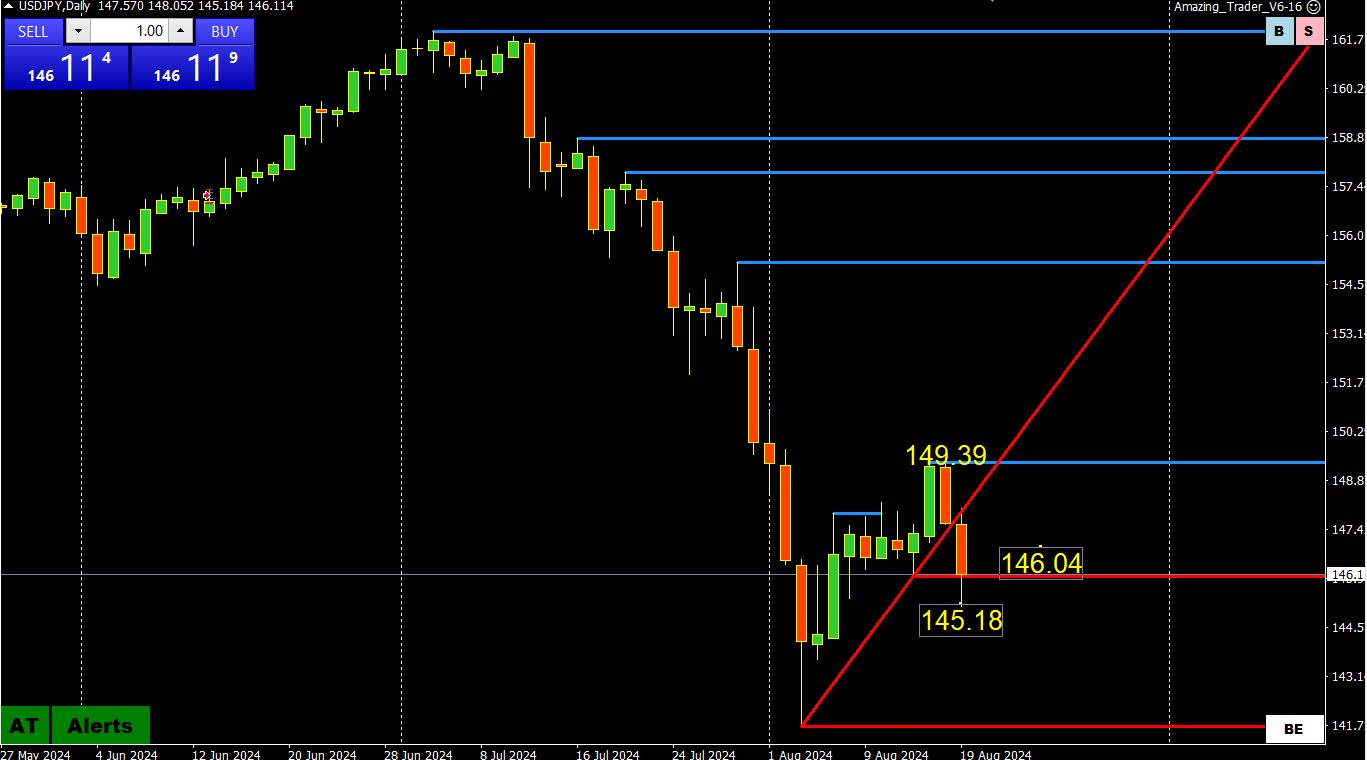
Good enough on the sell side of UsdJpy. Fundamentals supported the sell on top of the technicals and the predatory stop running and absolute Bs market movement. Should see 146+ again in coming days and perhaps by tomorrow unless there is considerable disconnect with established metrics.
Lets see…
Price gouging solves itself when 1) the first gouger runs out of supply and when “me too” opportunists arrive with new supply.
2) price gouging, in its pure certified form, gets solved when the gouger gets either shot by pissed gougee or by govt price-control enforcement forces.
Yesterday I posted (factually per Reuters) that hundreds of millions of individual social security and sensitive data had been hacked and sold on the black market in the dark web in recent weeks. Almost a billion actually. The place to go to see if your data has indeed been hacked and sold is https://npd.pentester.com/.
In case you missed it, the Social Security numbers and personal identification of hundreds of millions of people in the US, UK, and Canada have been hacked and sold on the black market in recent weeks. The safe bet is to not assume your data was not in there. This is a big industry.
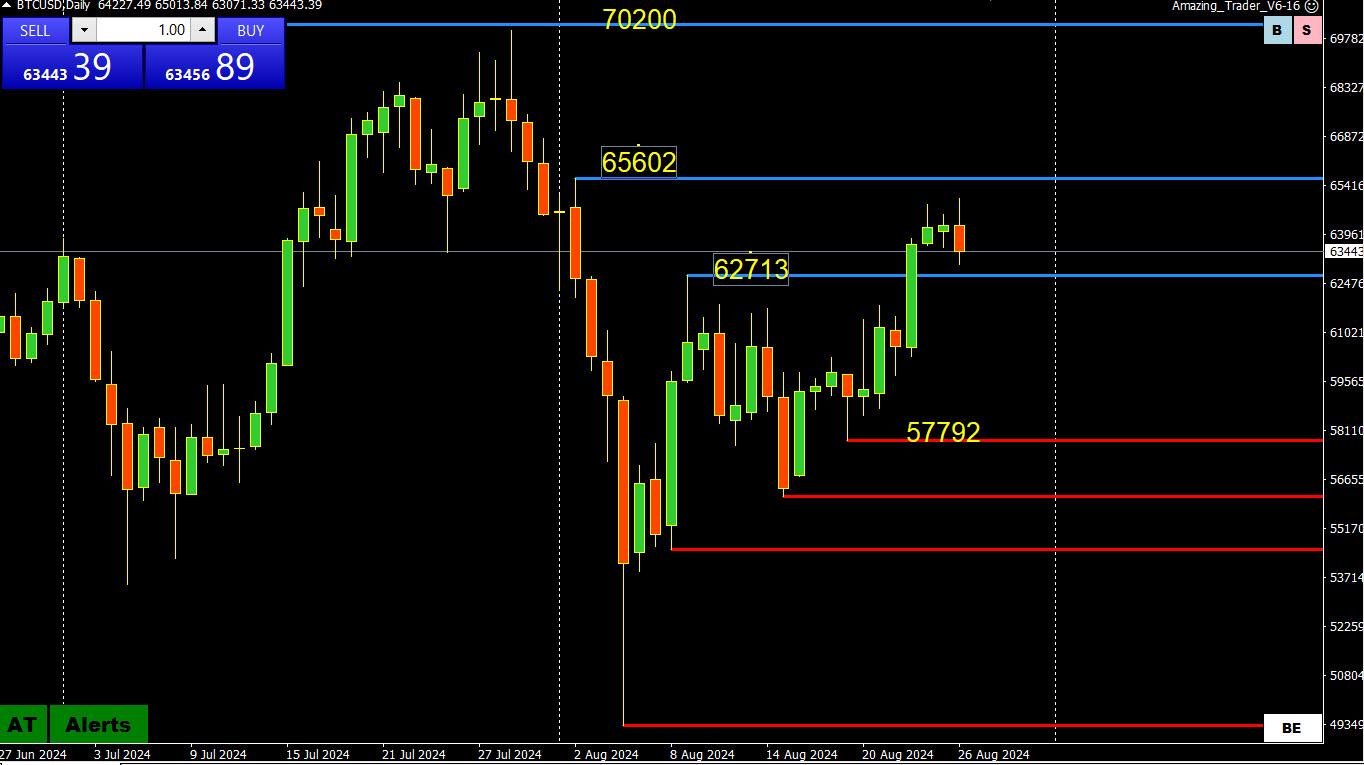
As I pointed out in the Weekly Outlook, 146.05 was the key level on the downside and USDJPY smashed through it (145.18 low) but so far has not established below it.
At a minimum, this confirms the move up to 149.39 was a retracement but if this leads to consolidation, then look for 145.148 to be a potential range.,
JP – Ok then all we need to do is tax every worker to cover the cost of making chocolate free for everyone and vast problems are solved. Easy plot dot. Just following woke economic principals.
SF 3:01 – If you have habits without which you cannot get through your day I, the uglier than ugly guy at sold many gaffs, intentionally and eagerly, with no feminine side nor an inner child, truthfully honestly un-apologically, am on stand-by to …. ….
take full advantage
psst / according to FRED “Average Hourly Earnings of Production and Nonsupervisory Employees”
july 2024: $30.14/hr vs marsbar $1.25
july 1969: $3.22/hr vs marsbar $0.10
The AMEX Gold Bugs Index went straight up and is a mix of risk on sentiment and hedging at the same time this time. Geopolitical tension, war, failing economic structures, failing political con games weigh while ever-present demand not just to keep your girlfriend from complaining but for high end defense electronic and other solid use reasons.
And then there is speculation. Buy side internal metrics a 5 times greater than sell side this morning.
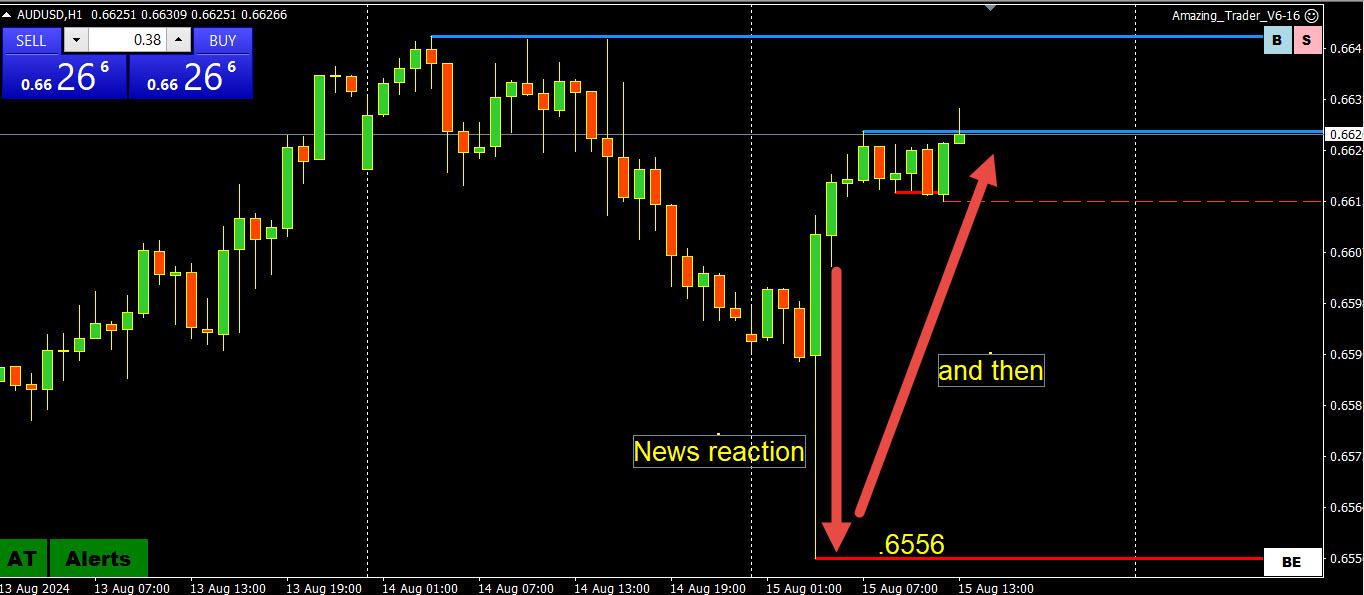
You need to understand the dynamics of the market and how it works so you can evaluate the reaction to a news event or a news headline.
There are news algos that are programmed to react to keywords. So, if a news headline comes out, such as a geopolitical news headline, the algos would react by buying or selling even if it eventually turned out to be a non-event.
Now, let’s get down to what most traders look at, which are economic data reports. No matter how fast a news feed you have, the news algos, programmed to react to economic reports, will be faster. I have a fast news feed and before I even see the data, markets have already reacted.
This was the case overnight and is a classic example.
As this chart shows, AUDUSD was trading at .6588 prior to the release of the July employment report. fell to .6556 on the release and then quickly rebounded, currently trading at.6627.
This is commonly called a whipsaw, which can be painful to seasoned traders but disastrous to retail traders without deep pockets.
Whipsaw: In trading, a whipsaw is a slang term that describes a volatile market where price suddenly moves in one direction and then quickly reverses.
Why did it react that way?
News algos reacted to the headline, including a tick up in the jobless rate but on closer inspection, it was not a weak report. This was no solace to those who saw their stops get run on the initial reaction only to see the market quickly reverse.
This is why I do not hold positions into economic data releases, as stops are not safe, even if you have the right idea as witnessed by the AUDUSD reaction to the data.
So, bottom line, if you want to be a player in the global trading market, you have to understand how it works and why you see sharp reactions to data that sometimes follow through and other times quickly reverse. News algos are mindless, and react first while traders evaluate the moves afterwards.
A case can be made for a 145-148 (or 146-148) consolidation range after the brief blip yesterday to 148.22 failed to follow through. A solid move above 148 would be needed to put 150 in play again.
If USDJPY settles into a range, then the cost of carrying a long JPY may become a factor.
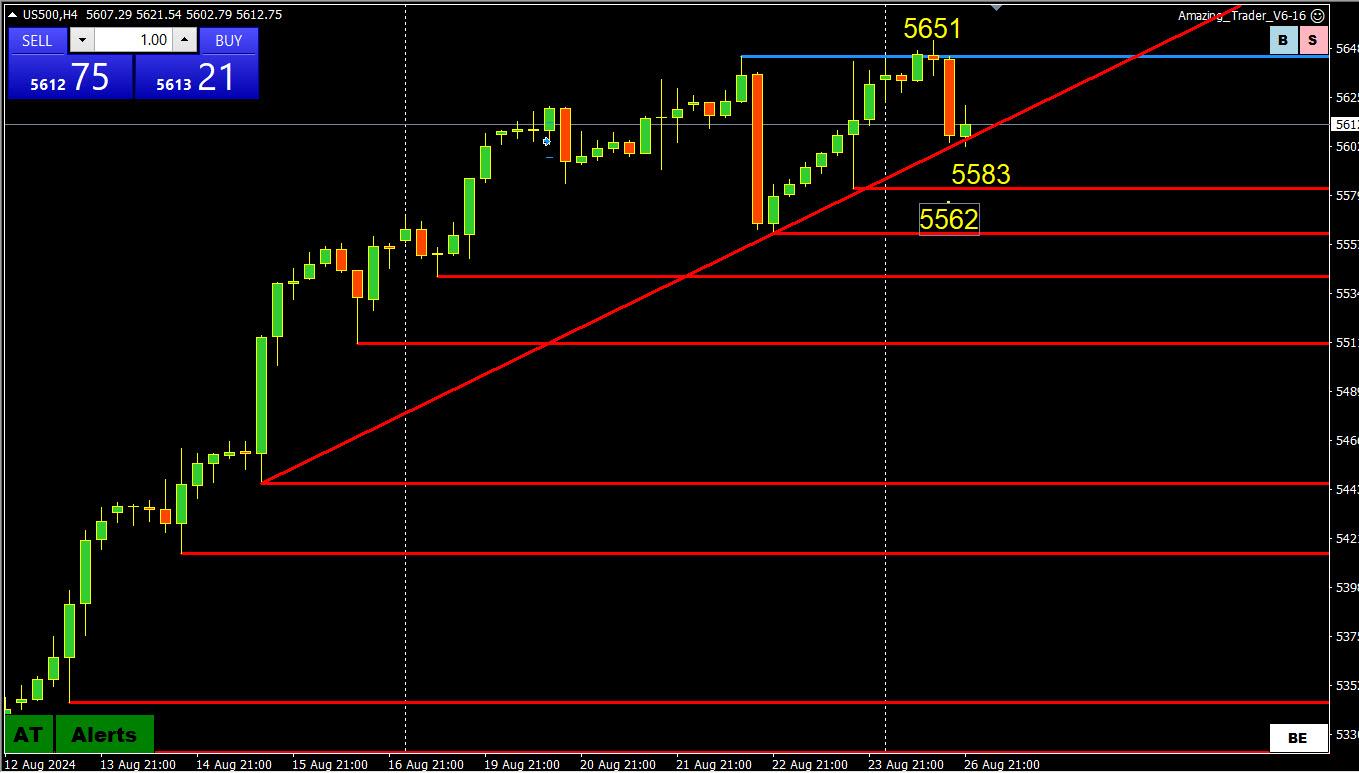
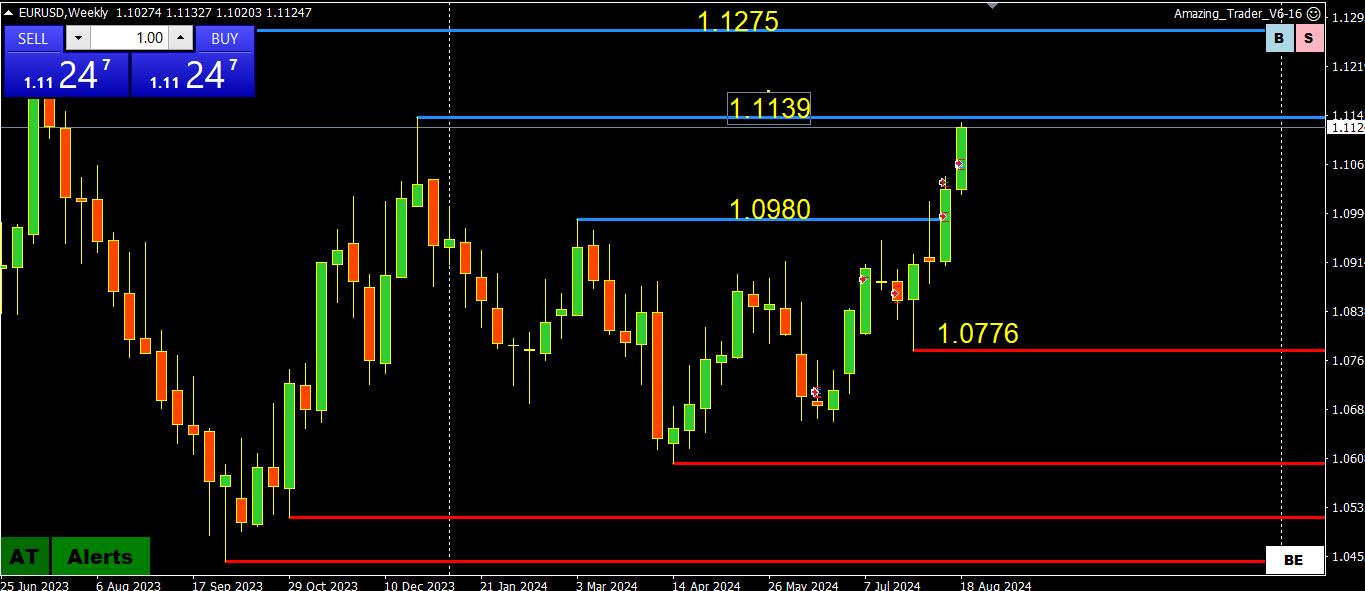
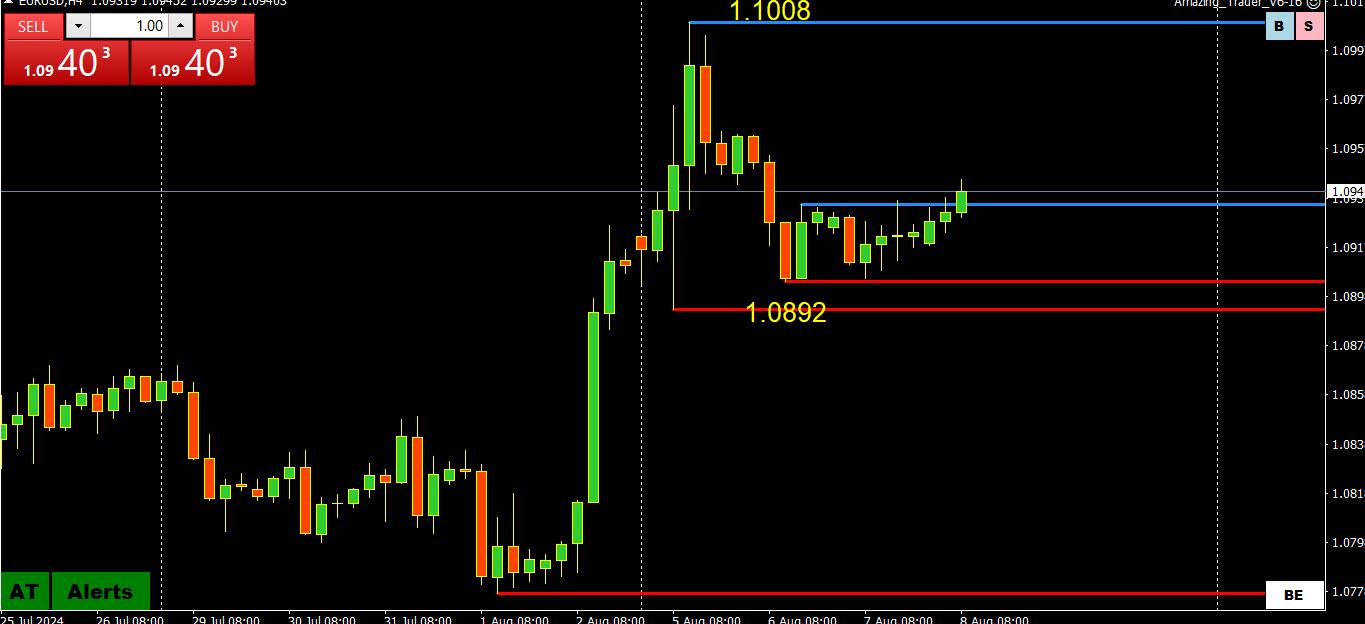
The only 2 levels that matter for me are 1.0892 (uptrend intact while above it) and 1.1008 (high for the move) as EURUSD consolidates.
While within 1.09-1.10, look for 1.0950 to eventually dictate whether or not the market makes another run at the high
One word of caution: When in tight ranges (yesterday’s range was 31 pips), what you see on a short term chart (i.e. candles or bars) may look like big moves when in fact they are small moves within a tight range.
Author
Search Results
Viewing 20 results - 281 through 300 (of 532 total)