The upcoming week has a light economic calendar, especially from the US in a forex market that seems to need news to create volatility. Arguing for consolidation, at least to start the week, is a light economic calendar and that there are no key USD buy stops unless last week’s highs are taken out.
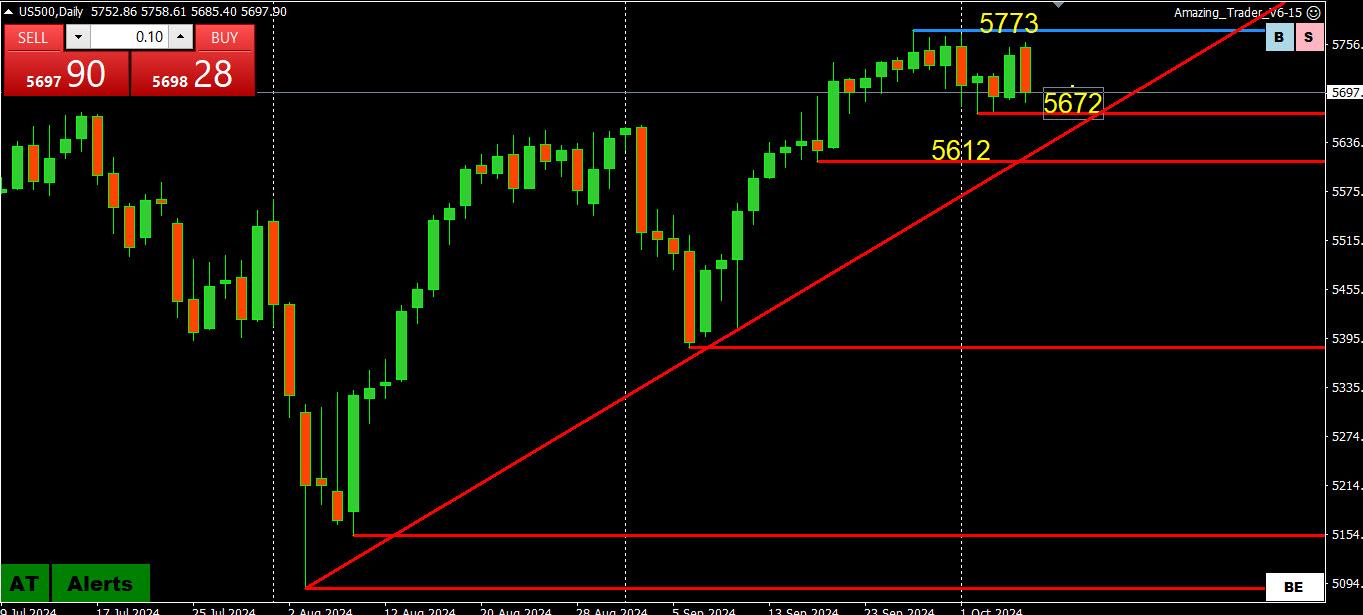
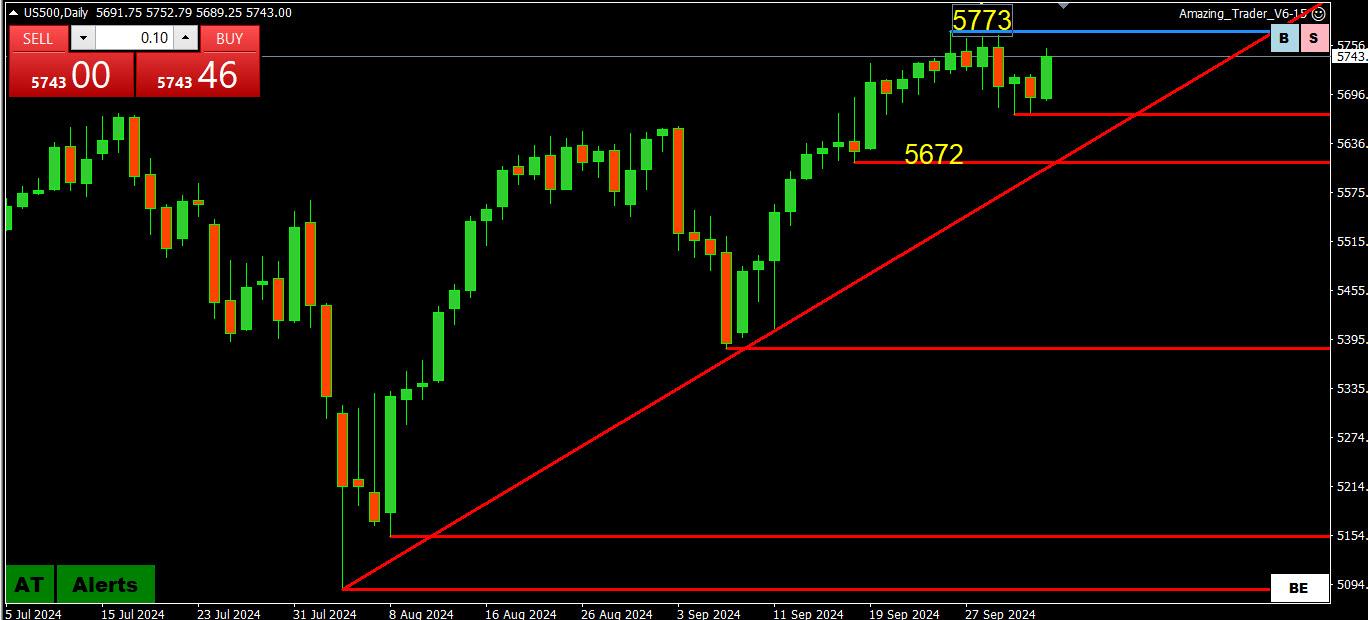
Let’s look at daily charts to see the broader picture.
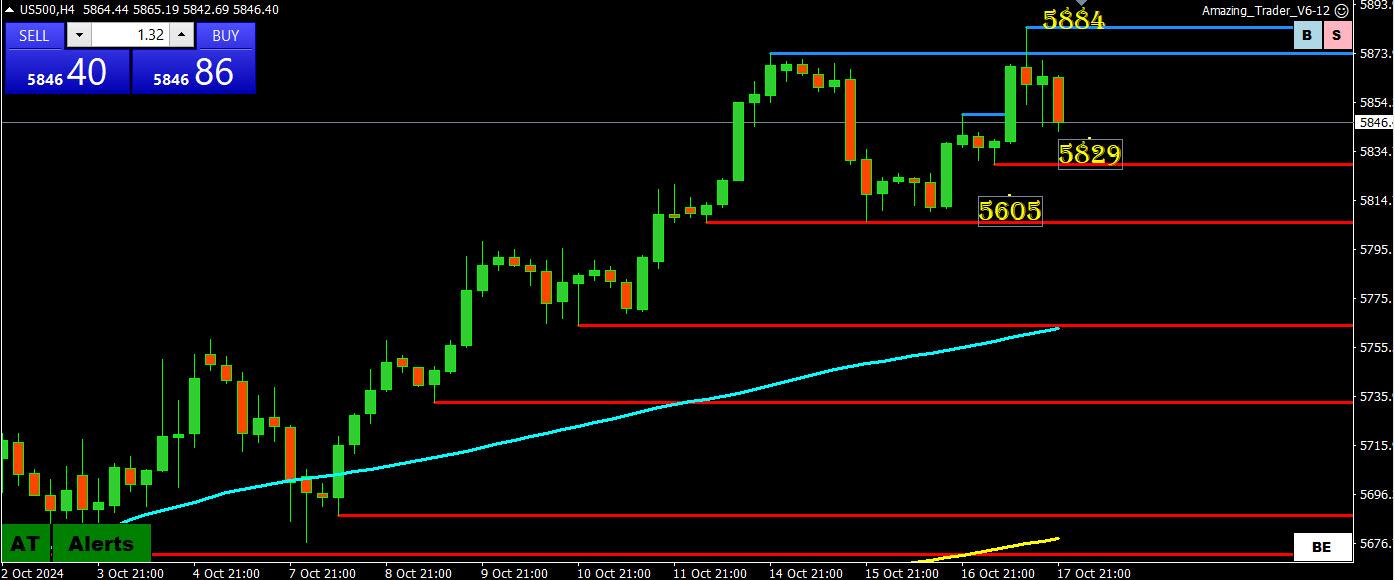
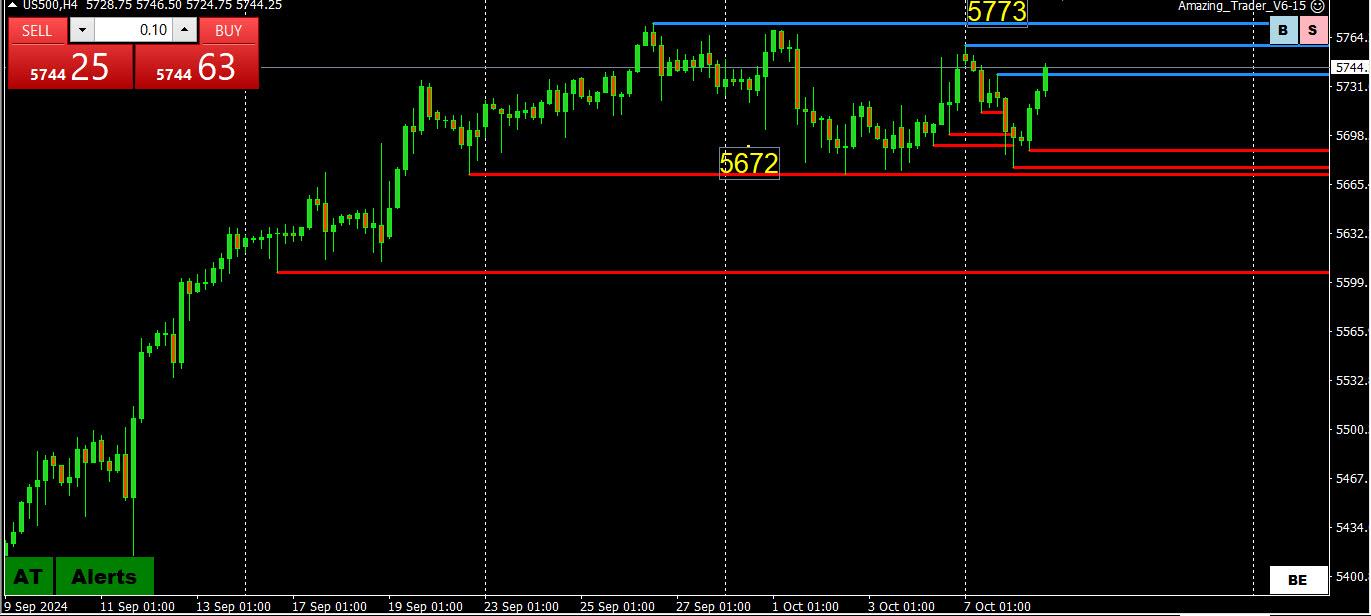
US500 4 HOUR – ANOTHER GLASS HALF EMPTY OR HALF FULL
Glass half full: Another record high, strong uptrend as long as it stays above 5605
Glass Half Empty: 4 days setting new highs but not following through. Needs to set a new high and close solidly above the old high to build further momentum.
I am really nailing Sterling and Yen right now and it is important to understand I was a CTA on the phone filling orders through many houses with large contracts and the competition was intense, but you just behave solid. So I am seeing repetitive patters right now in these pairs and if you have any common sense I would pay attention. At times I will shout something like “long Yen” that means with your brokers you are selling Yen. It is very fast and there are major banks filling orders so you must be on you toes. That said, if you just relax you can see what they are doing.
Stocks got a boost and risk on has seen the USD back off on China news….Just the mention of China trying to do soemthing seemed to cause a thin market reaction…. looking at that news, nice fading opportunity.
China could issue CNY 59bn of Treasury binds over three years, via Caixin, citing sources; funds will be uaed to help local governments resolve their off-the-books debts/.. Source: Newsquawk.com...Try Newsquawk for 7 Days Free
Sterling futures are getting clobbered to open the week, but EurJpy is being bought. Usually, with good percentile of accuracy, which direction Euro and Sterling are going after 7pmPST that will be the overall direction of the week. Yen pairs are isolated in this regard. Lets see what happens in the next 4 hours. I have spent countless hours of analysis on this, it is reasonably solid. I just hope some of you out there who take my posts to heart are good people. I am a former CTA who knows a thing or two.
Canadian consumer prices on Tuesday are expected to break lower to a below-target 1.9 percent. UK consumer prices on Wednesday are expected to post a 1.9 percent year-on-year rise for September, down a tick from August’s 2.0 percent.
The big report in the week is the September data on retail and food services sales on Thursday. There’s room for a few surprises in the numbers, but a lot could depend on how much of the underlying information came in from storm-affected areas in the days before and after Hurricane Helene made landfall on September 26. It is late enough in the month that effects may have to wait for the revisions when the October report is issued on Friday, November 15.
At the moment, rising motor vehicle sales and falling gasoline prices are two factors that are moving in opposite directions. There is likely to be an increase in the dollar value of motor vehicle sales both on units sold and prices paid. Gasoline prices fell fairly steadily over the course of September which in turn could reduce the dollar value of sales even if the volume of sales increased. Elsewhere, storm preparations could mean a boost for sales of building materials, nonperishable food and bottled water, and emergency supplies like ice, batteries, and generators. Demand could have been higher both before and after the storm hit.
Also on Thursday is the October housing market index from the NAHB. Homebuilders’ confidence started to recover in September with steep declines in mortgage rates. At the start of September the weekly Freddie Mac rate for a 30-year fixed-rate mortgage was 6.35 percent and fell to 6.08 percent by late in the month. However, some of that was due to a reaction to the FOMC cutting the fed funds target rate range by an aggressive 50 basis points on September 18. Markets are now less giddy about future rate cuts since the release of the solid September employment report on October 4. The October NAHB report could reflect homebuilders’ renewed caution about the outlook for much of the new home construction market. However, it may also capture some expectation of a need for replacing destroyed housing stock after the hurricanes.
In the absence of fresh economic news, markets are like steering a boat without a rudder.
This leads to looking for correlations to steer the boat. In this regard, early USD strength seemed to correlate with weaker stocks, which have since recovered and the USD has backed off its day highs.
Note, correlations work until they stop working so keep an eye on Stocks to see if the pattern continues (or not).
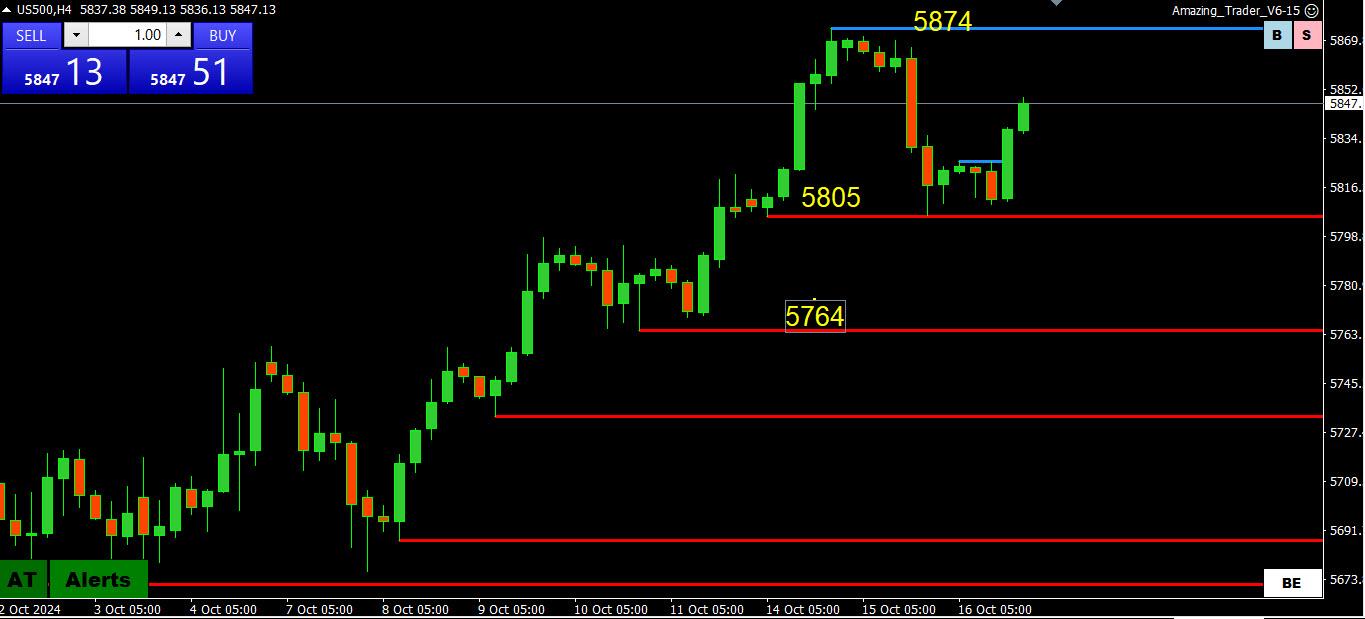
As for U5500, trading with a bid (while above 5700) but consolidating unless 5758-73 are taken out.
‘
JP, the answer to your question depends on whether there are stops below 1.0950. Right now there is a double bottom, suggesting someone defending this level but the more times a level is tested the weaker it becomes unless of course if it holds rock solid.
As I noted, test may have to wait until US CPI but in any case, a 50 pip range is too tight to last for long.
Commodity currencies were signaling risk off and US stocks finally paid notice.
‘
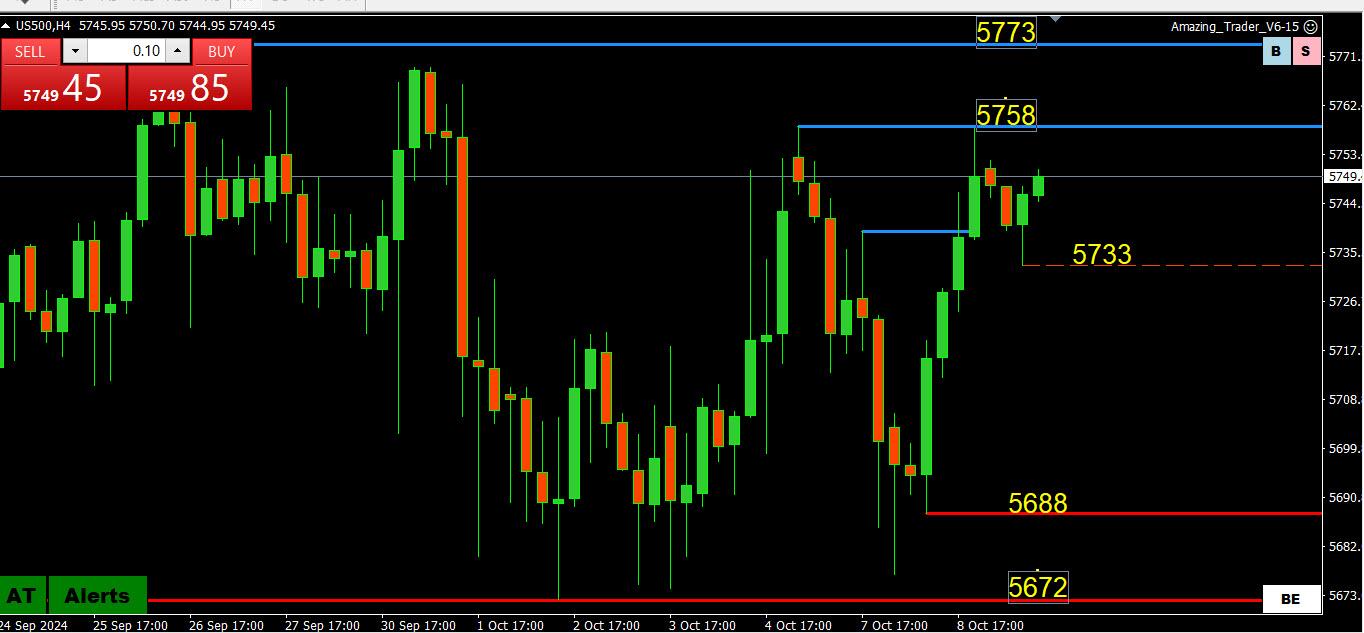
‘Going strictly by the charts, the high is likely in for now (unless 5773 is taken out) and 5672 support needs to hold or risk the downside picking up steam.
So choice seems to be consolidation (above 5672) or retracement (below 5672).
There is a bit of buy side activity in Dow but it is not widespread.
Clearly this is a risk off start to the week. It started immediately with the Asian open and never changed. Significant developments will be needed to turn that around.
I find it interesting that some media are giddy over last week’s US jobs numbers. They seem to have forgotten in a week’s time the last revision was almost a million job losses off and on the negative side. I have absolute ZERO faith in ANY numbers that come out of this US administration or its offshoots. Might as well believe Al Capone, at least he was a good liar not a bad one.
The only thing that increasingly counts in markets is how the flows are going because the economic numbers are tremendously unreliable.
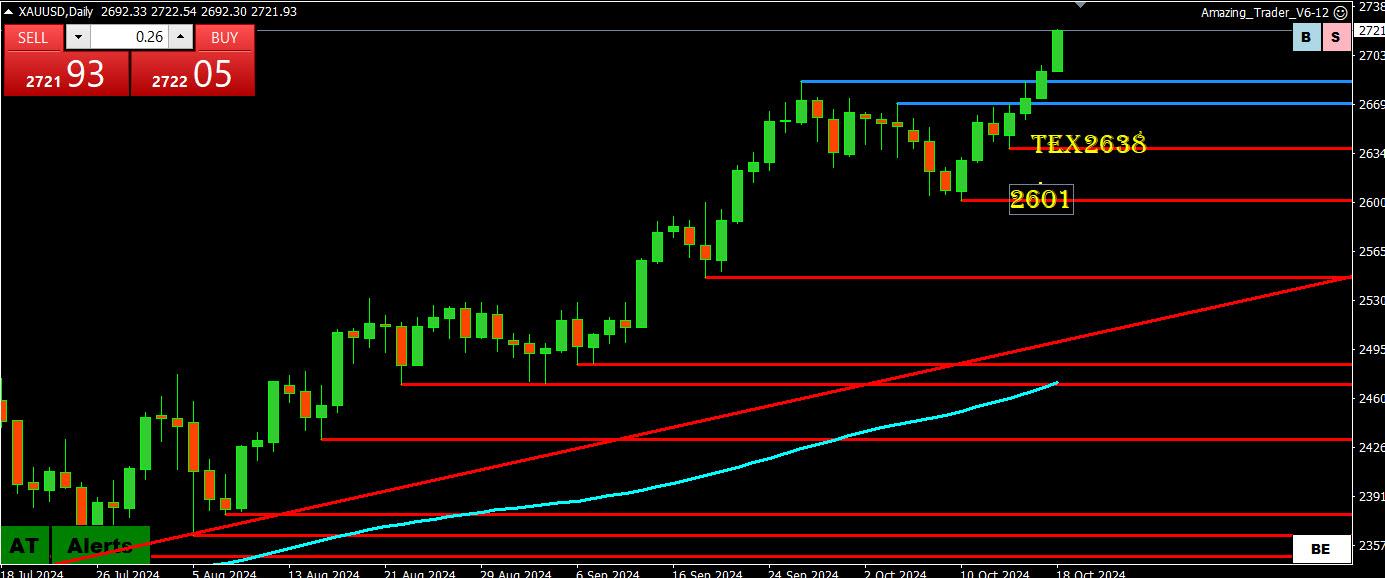
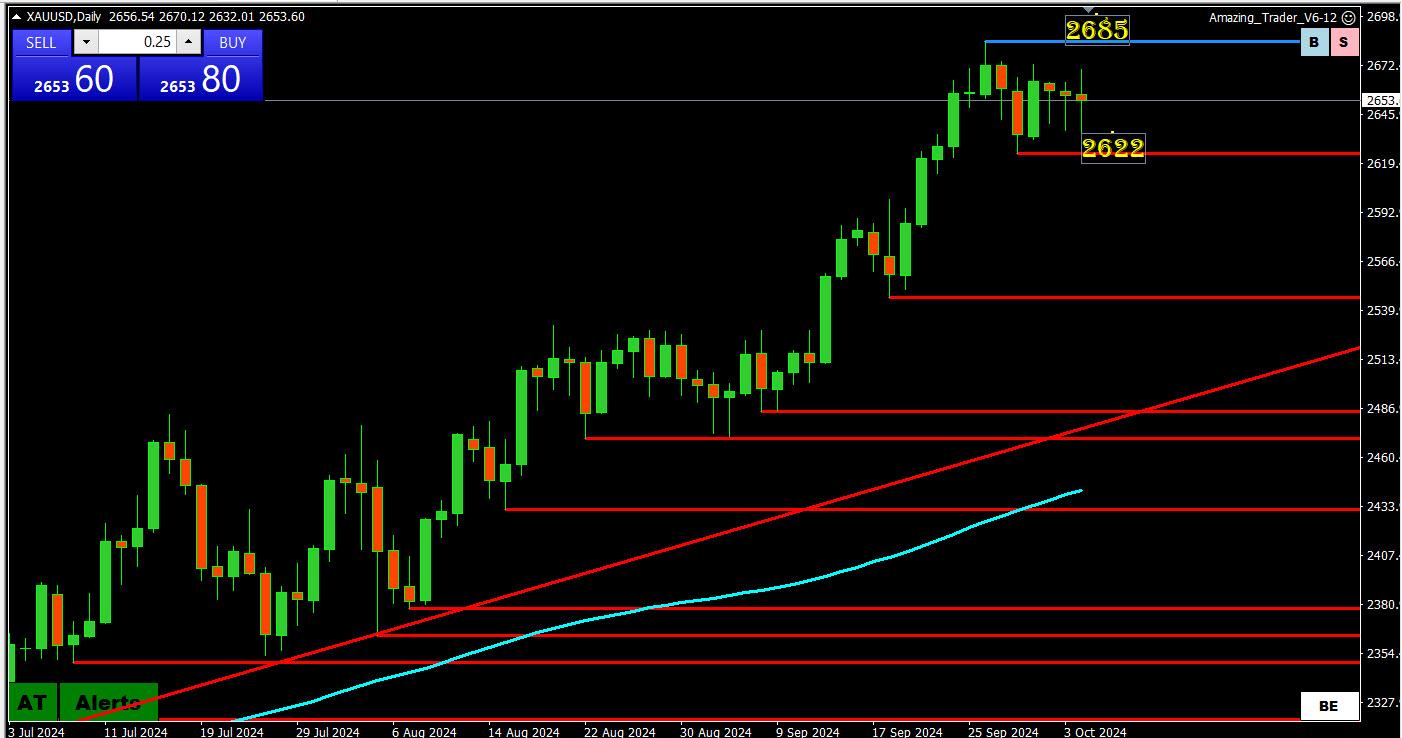
XAUUSD has traded within 2622-2685, the latter being the new record high, for 7 days in aa row.
Tug-of-war: Higher US yield vs. simmering Middle East geopolitical risk.
While this consolidation will not last, if you view 2600-2700 as a range, then 2650, currently having a magnetic pulll, will eventually dictate the next move.
The Put to Call Ratio in US stocks bounced off of relative lows from last Friday and so the odds are strong that there will be aggressive selling opening next week without something substantial to support it. An isolated metric but one that holds water usually. Euro likes happy stocks. It does not like mean stocks.
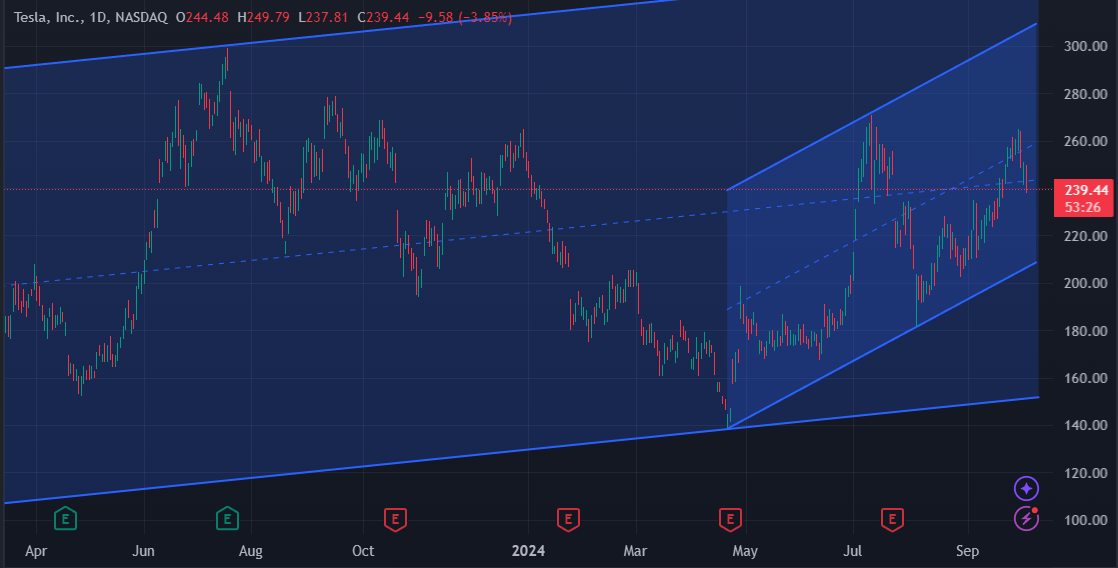
TSLA: Tesla Stock Skids After Q3 Deliveries Narrowly Beat Mid-Range Expectations
Tesla shares drop 3.5%.
Company delivers 462,890 cars.
Growth is 515,000 units sold in Q4.
EV maker shipped 462,890 vehicles in the September quarter but failed to top the high-end of Wall Street’s expectations. Shares fell 3.5%.
Tesla stock TSLA skittered 3.5% Wednesday after a lackluster delivery number. The EV maker reported third-quarter deliveries of 462,890. It managed to hit above the mid-range consensus views of 462,000 but fell short of meeting the high-end calls for 469,828 vehicles. The Elon Musk-led company had issued its own guidance of 461,978 units shipped globally.
Author
Search Results
Viewing 20 results - 221 through 240 (of 532 total)