and degenarte traders ask: where and how to profit
my version of DLRx is at 103.75
and chart signal suggest puppy needs to hold the level
if not the construct would go “bearish” from current consolidation
this first week of the month, outside of tariffs, will see some incoming data fpr players to consider:
ISM, PMI, NFP
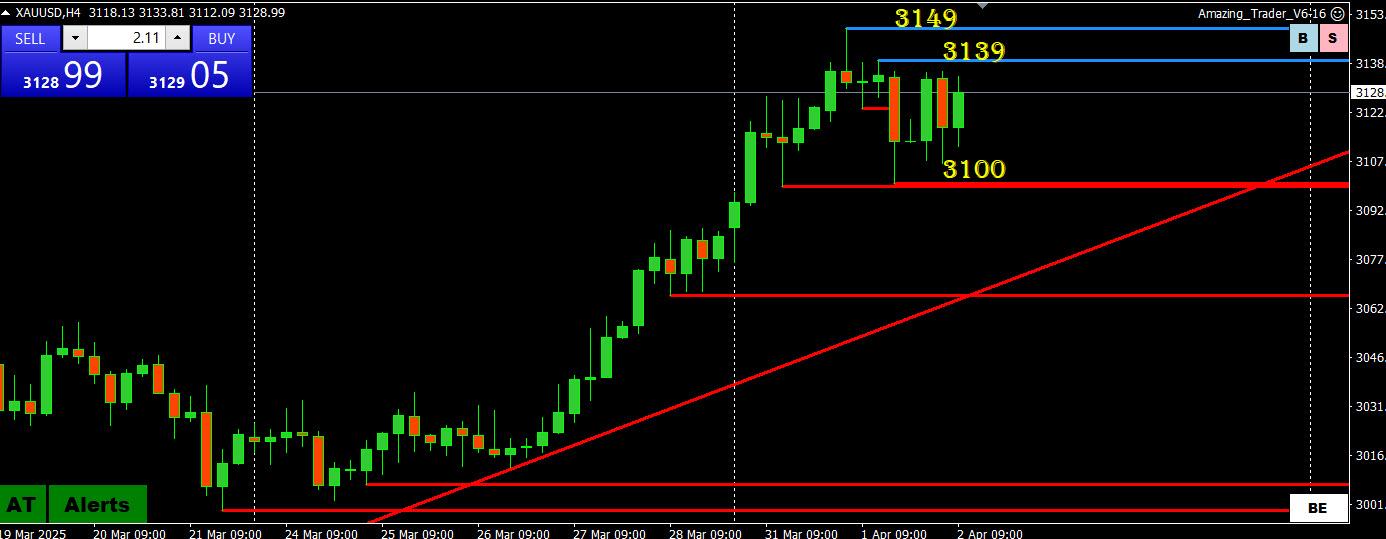
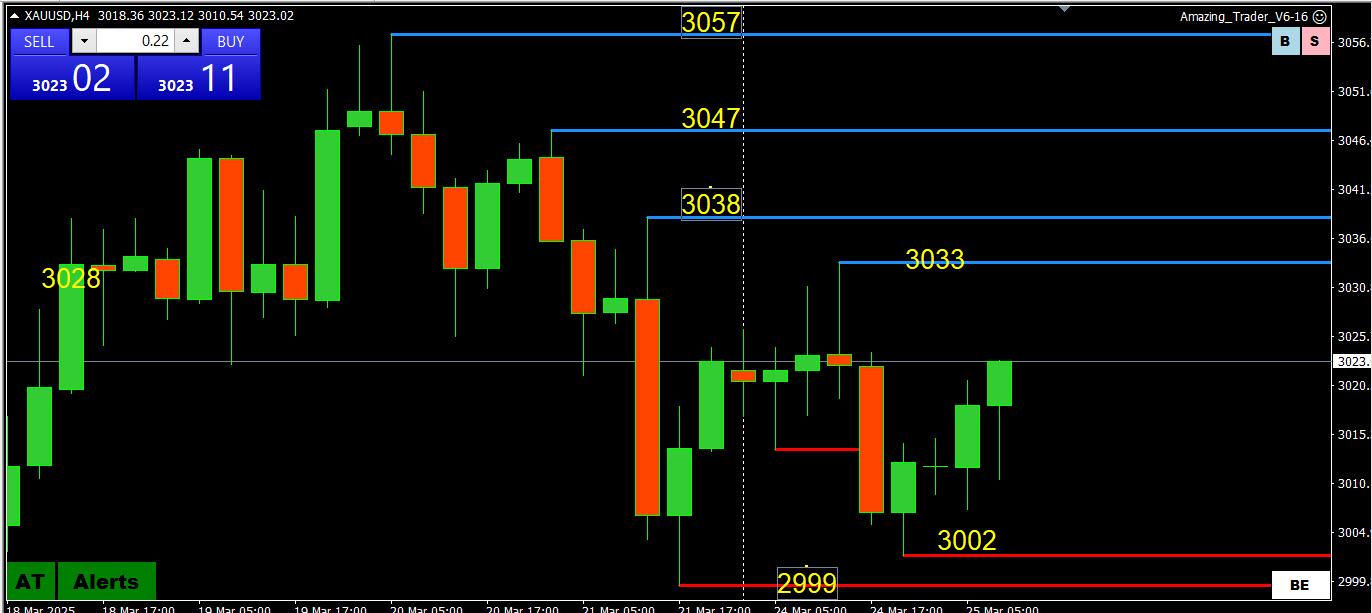
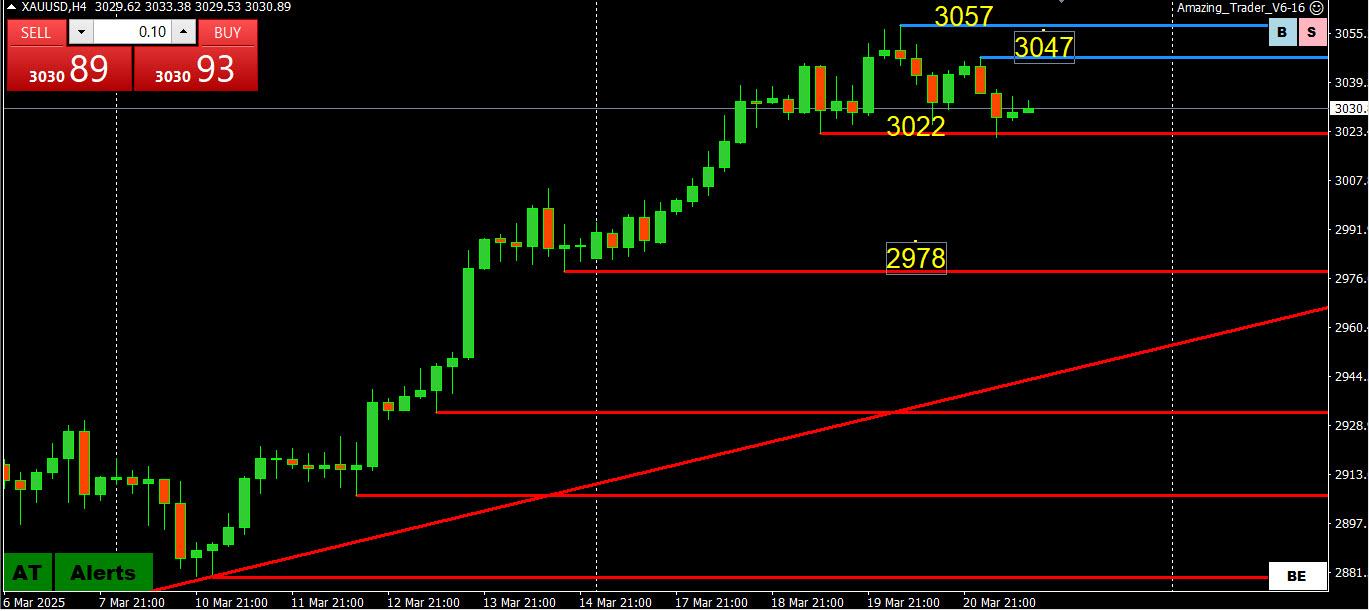
Glass half fllled: biding its time for another run up unless 3000 is firmly broken… above 3038 would be needed to end lingering retracement risk and put 3047-57 in play again
Glass half empty: lingering retracement risk while below 3038… would need to break 2999 to extend it
I have been using it long ago, but never as exclusive Indicator.
RSI 9 was my favourite.
What I can see from your Cheat Sheet, idea to draw trend lines on it never crossed my mind to be honest 😀 And just by looking at it right now, I can see logic.
Let me give you some unorthodox view on RSI – my approach was the same as everyone else’s and it gave me hard time many times, until I had a chit chat with a friend of mine. At the time ( late 90’s) he was a chief dealer at one of the Central Banks.
He told me how they use it – and I was shocked :
When RSI gets above 100 or below 20 – so overbought or oversold, and hesitates to change the direction, it is a prime sign that market will continue strongly in the direction it was already in – so while we water rabbits were going contra, expecting it to change the trend, market ( and all those CB’s) were just using our stops and orders to continue their Rally.
Of course, after some time market changes the direction, but it is not the same when it does like 3-500 pips higher/lower: D
I am not saying that it always works, but just one interesting Tip for you…
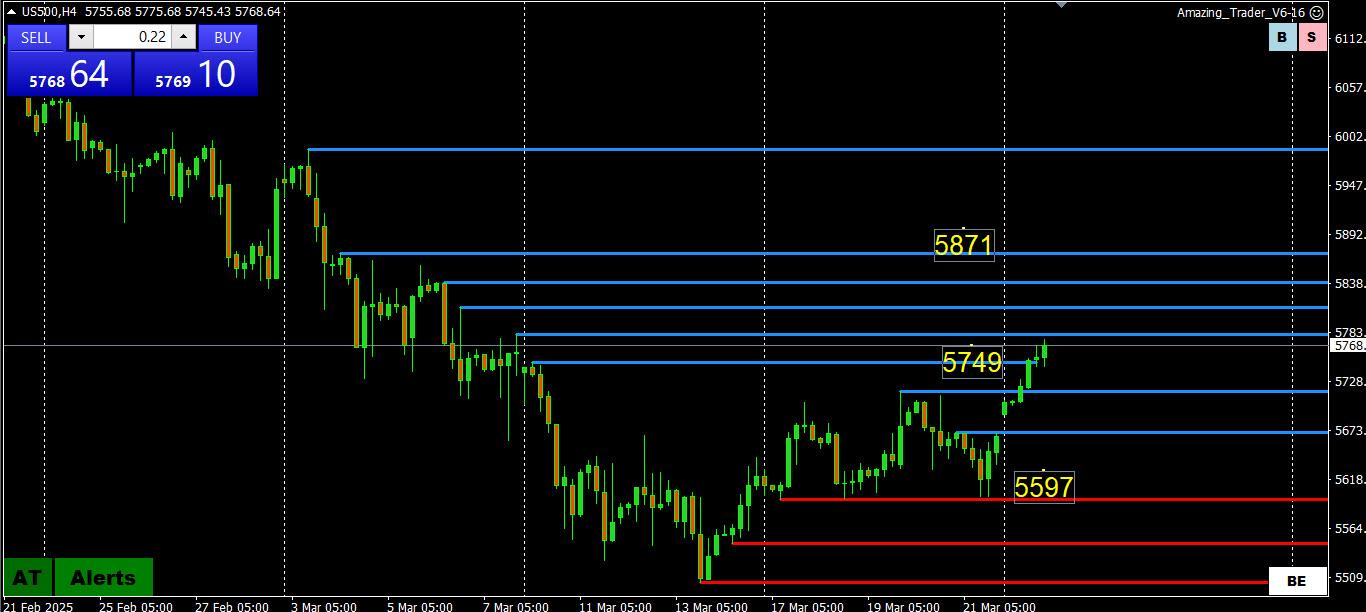
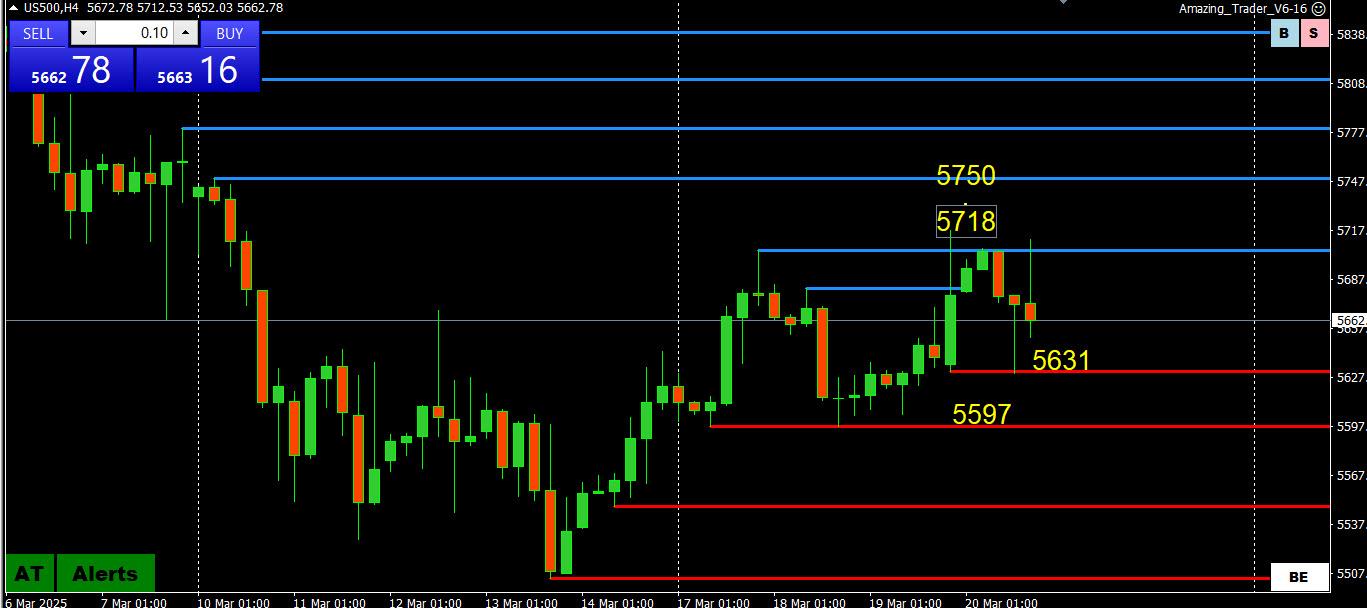
Last week, the 4 week down pattern was broken with an inside week… this week has started out with a higher high but as this chart shows, there are layers of resistance to get through from 5749-5871… at a minimum a solid 5800+ and then 5871+ would be needed to shift focus back to 6000.
On the downside, as pointed out last week, there is a double bottom at 5597 and only through there would shift the risk back to the low…. Keeps a bid if 5749 becomes support
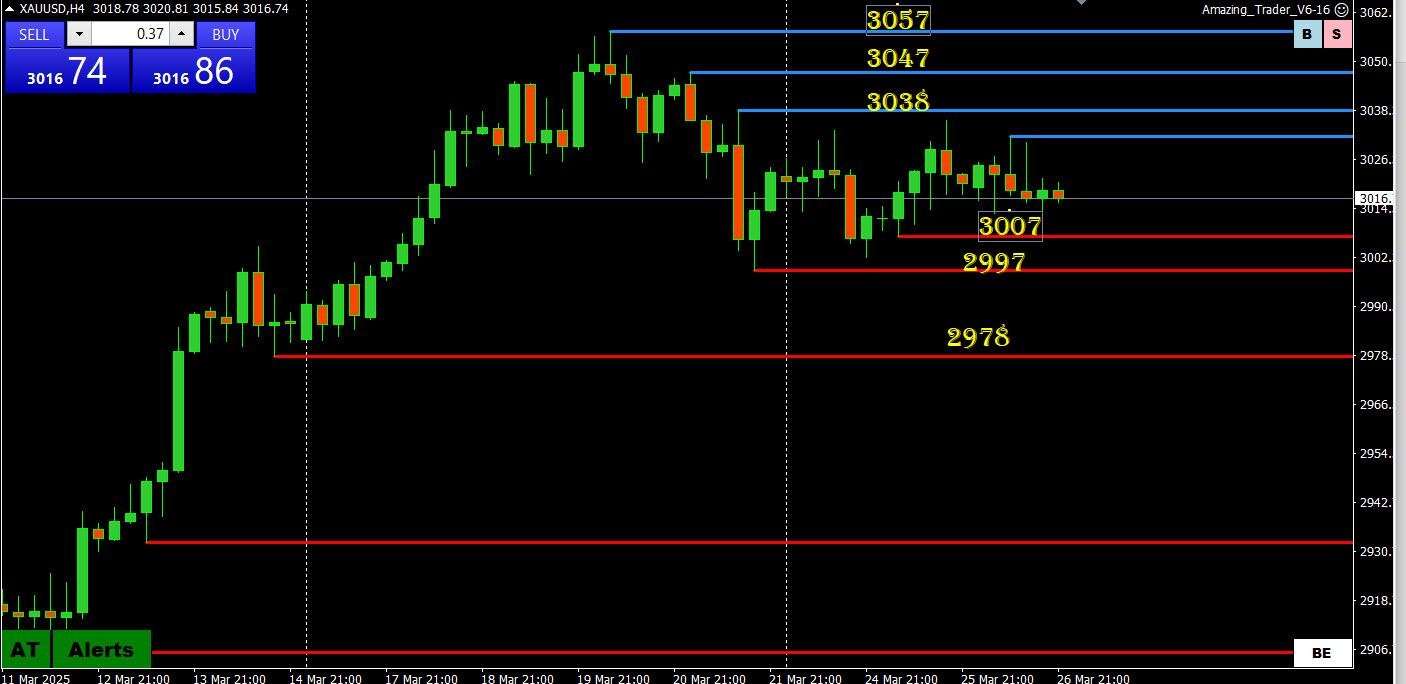
Chart still showing a downside risk that needs to take out 3038 to break the momentum… but only above 3047 would put the record 3057 high in play again
On the other side, the quick bounce Friday from 3000 suggests consolidation unless this level is taken out.
Range: 2999/3013 – 3038/3047/3057
For those that missed it, the following came out Friday and may have been a trigger for the XAUUSD sell off.
Robert “Bo” Hines, executive director of the President’s Council of Advisers on Digital Assets, said that if the move to sell some of the gold in Fort Knox to buy Bitcoin remained budget-neutral, it could be considered.
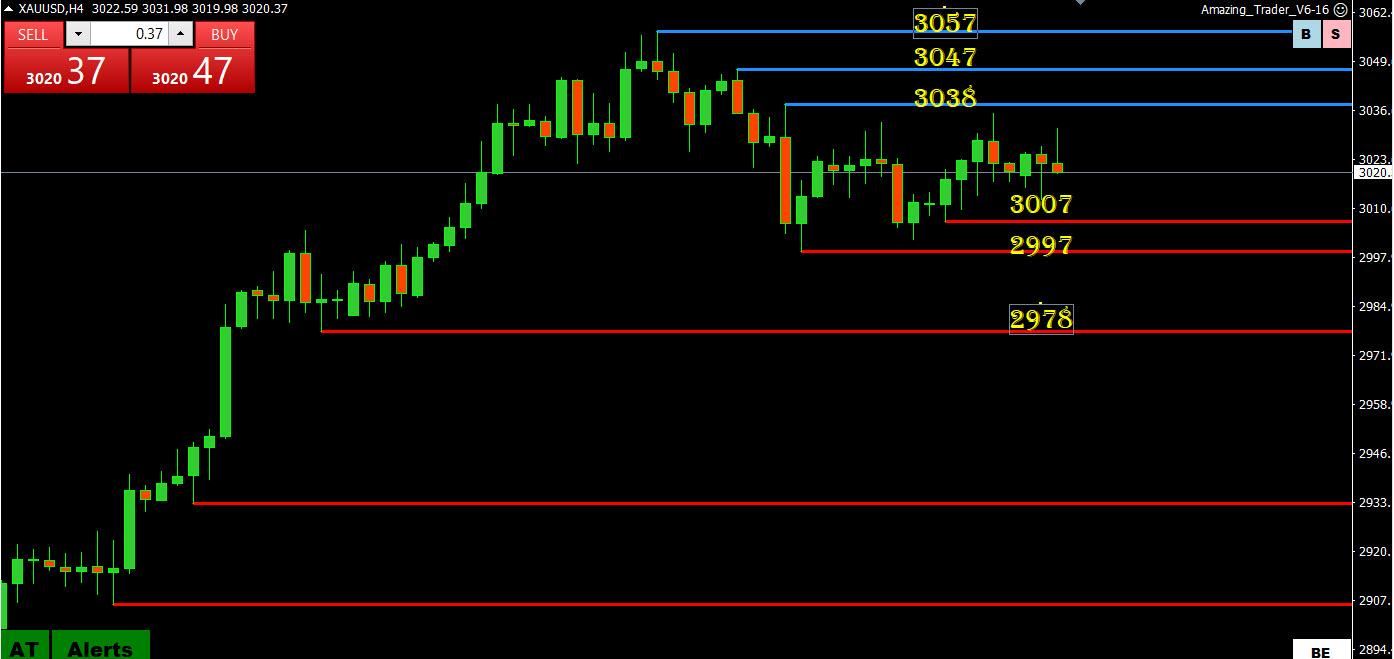
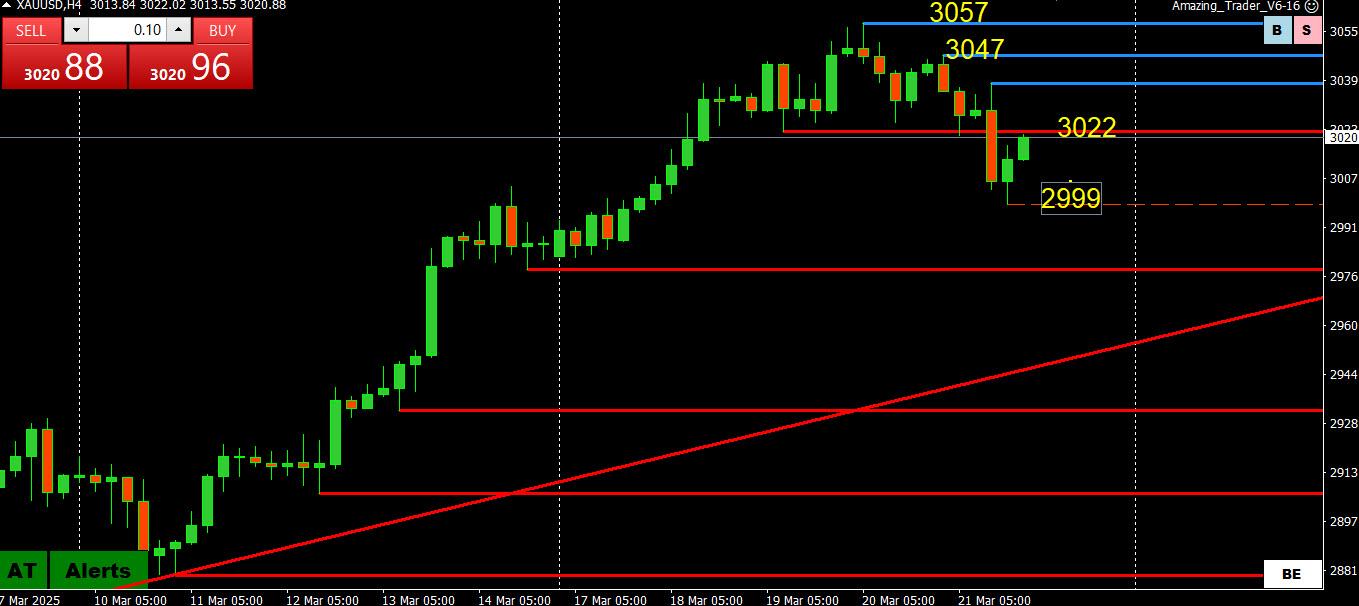
AT Directional Indicator (2 blue lines off the high) indicating a downside risk BUT only a move through 3022 would suggest anything more than consolidation.
Below 3022 lies 3000-05
Above 3047 would put the record 3057 high in play again.
DLRx 103.60
–
overall USD is getting some love from market, BUT not enuff to be charging out of call it consolidation zone
another overall is that bonds too are more mixed that lop-sided.
jerome tried to bamboozle players with some blablah about stagflation …
and so my so-far instinct observation is that with CB yikyakings about rates and ploicies over, players are and will put focus on any “clarifications” about April 2nd tariffications dynamics.
still overall in my reading of market sentiment about the dollar is that there retisence to rush into it, which by extention means that a rally in the dollar should have limited octane. in other words dlrx puppy will be needing to rush through 104 decisively and hold the level.
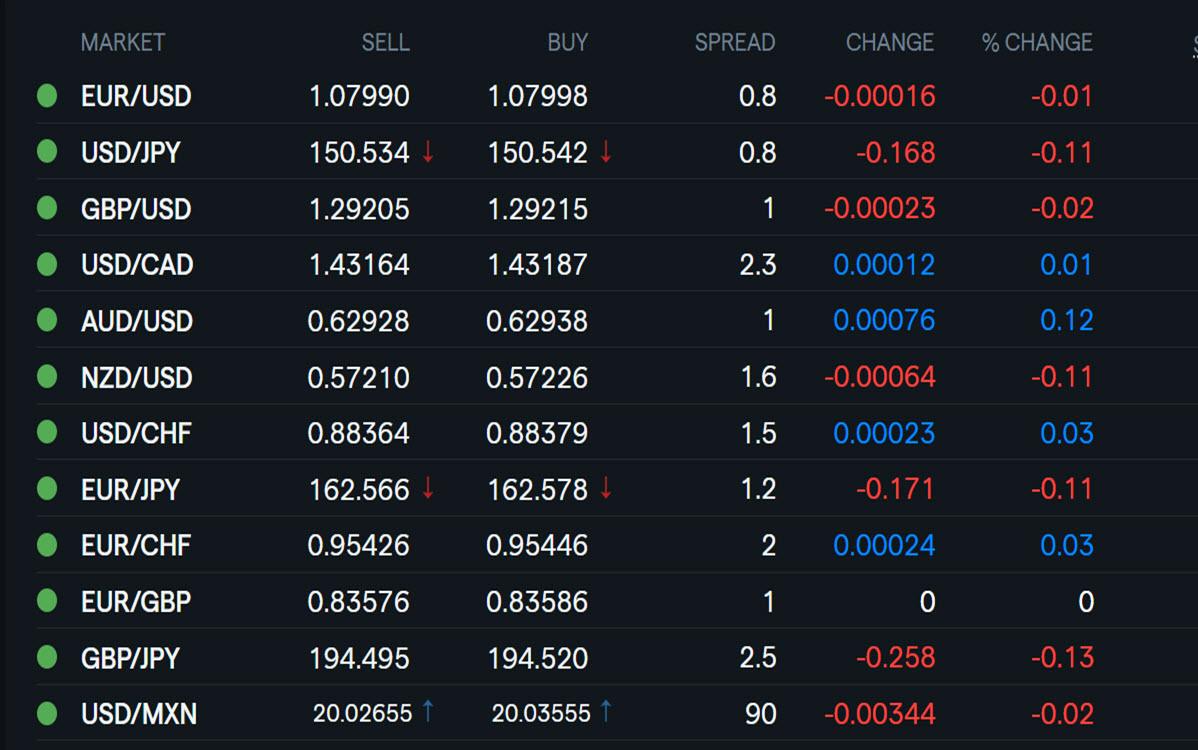
euro 1.0832 as I type.
I am biased down on this one. I maintain it needs to test decisively 108.20 Sup failure of which should open up approx 100 southerly pips and towards the 200dma
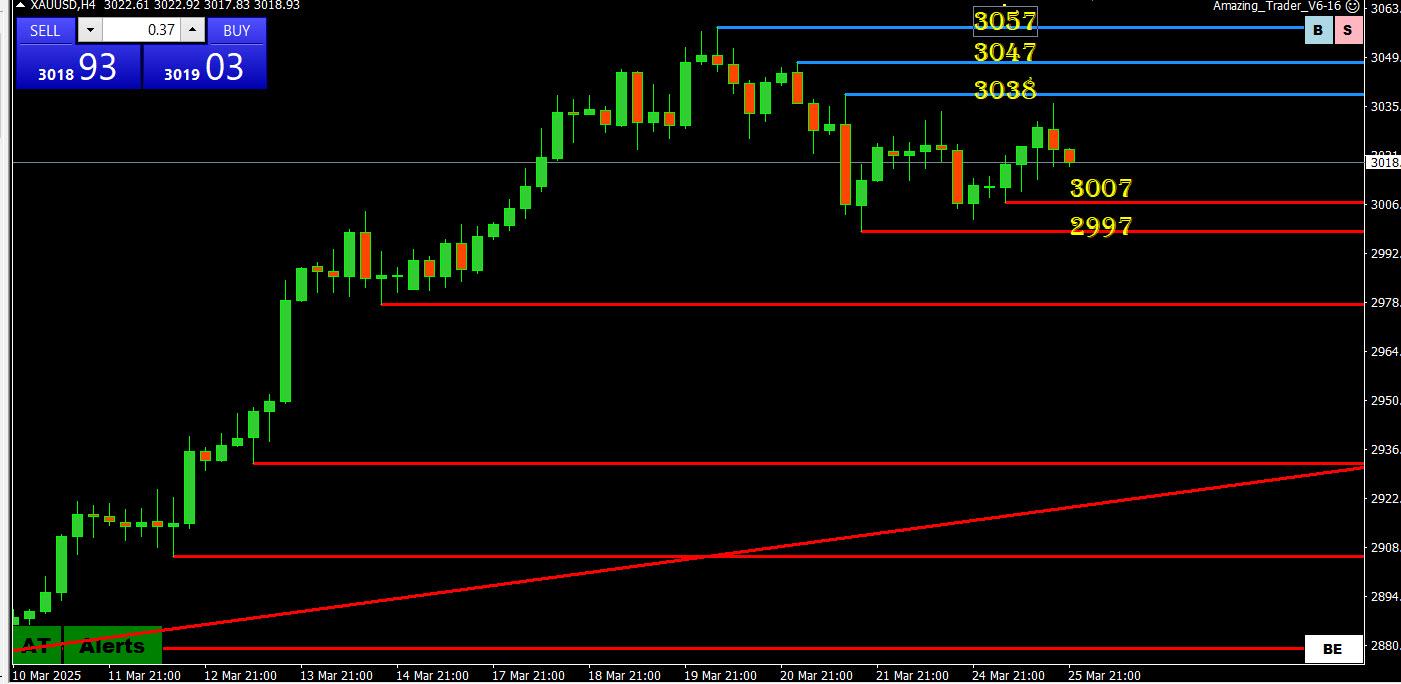
AT Directional Indicator (2 blue lines off the high) indicating a downside risk BUT only a move through 3022 would suggest anything more than consolidation.
Below 3022 lies 3000-05
Above 3047 would put the record 3057 high in play again.
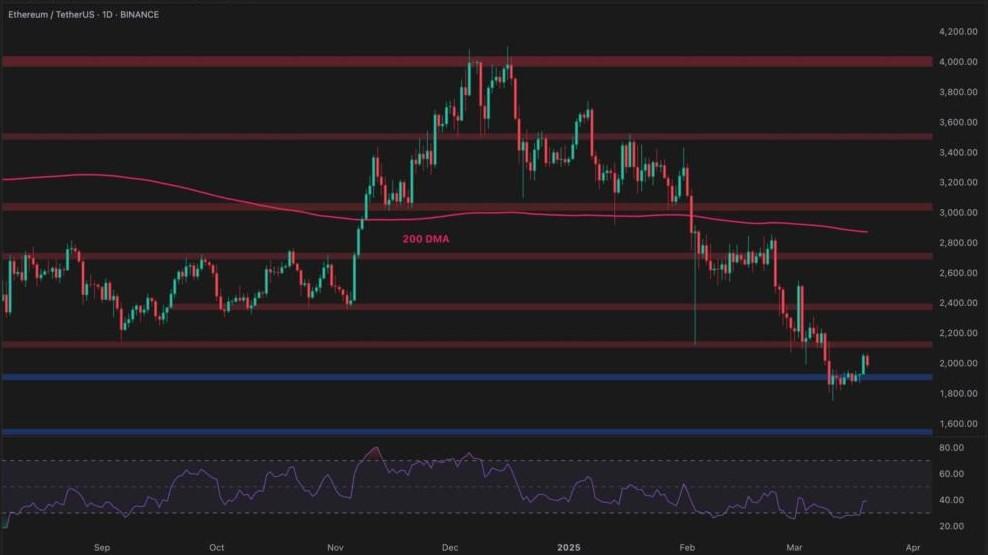
Ethereum Price Analysis: Is ETH Ready for a Decisive Break Above $2K?
Ethereum has been going through a terrible period of depreciation, as the price has been consistently making lower highs and lows. Yet, things might just be about to change.
On the daily chart, ETH has been in a strong downtrend, breaking below the critical 200-day moving average and losing multiple key support zones. Prices have recently bounced from the $1,900 demand zone but face resistance near the $2,100 level.
The 200 DMA, currently above $2,800, adds additional overhead pressure, making recovery attempts challenging. Meanwhile, the RSI is climbing from oversold territory, indicating potential short-term relief. However, unless ETH regains the $2,400 area and the 200-day moving average, the broader trend remains bearish.