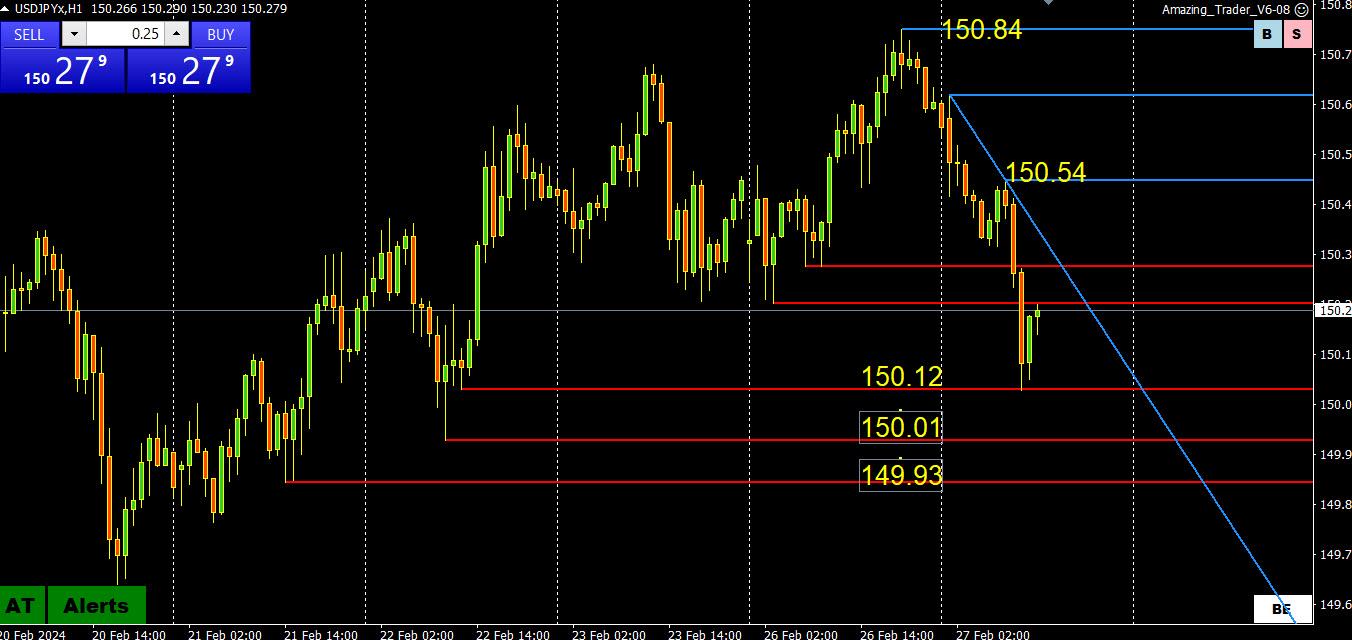
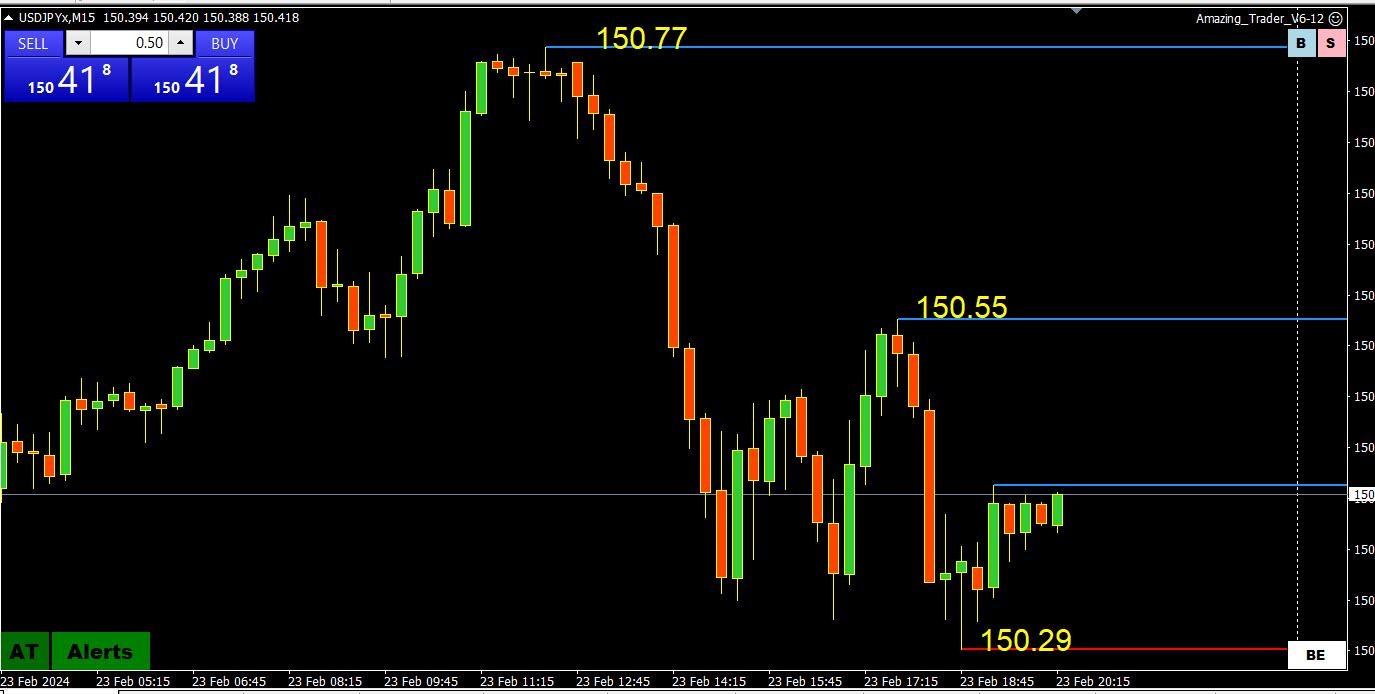
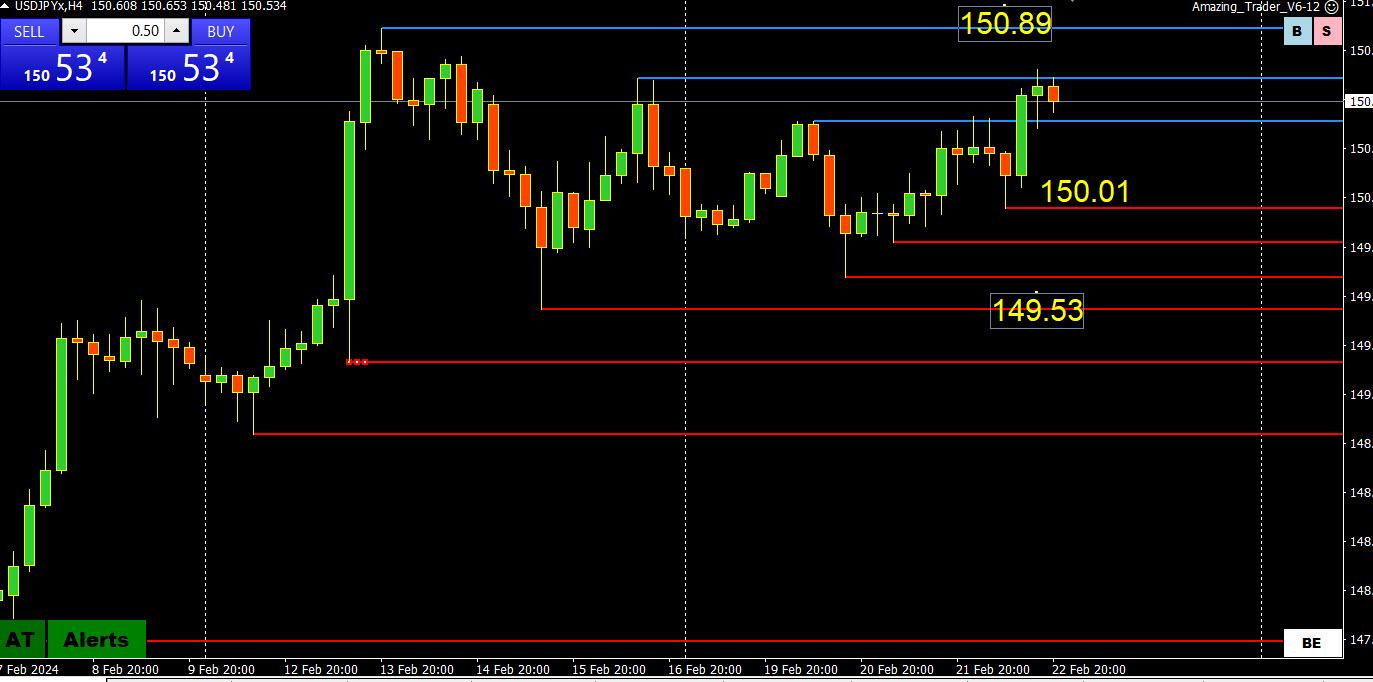
Blue lines dominating, indicating some shift in risk to the downside or more of a two-sided market after another failure to take out 150.89
However, price action remains contained while within 149.53 and 150.89 where 150 should continue to set the bias
Supports on either side of 150: 149.93-150.01-150.12
150.54 needs to hold on top to keep the focus on 150 and away from 150.84-89
Why did USDJPY fall today?
Technicians will cite another failed run at 150.89 and market positioning that is heavily short JPY, both vs. the USD and on its crosses
Those who say news matters will cite the release of a smaller-than-expected fall in annual Japanese inflation in a market that is hypersensitive to any data that might prompt the BoJ to raise interest rates.,
For those of us who like to play around a bit with crosses, Nok/Jpy moves a little slower than other pairs and appears to be targeting 14.35 again. Bias has been decidedly buy side in the prior 10 days, any declines have not pierced outer range pivots but have been compromising upside key value areas and, 14.35 is one of them. Any price activity from 14.32 is likely to pull back today/overnight in our model.
USDJPY: Stuck in Limbo – Uptrend Consolidation or Downturn Signal?
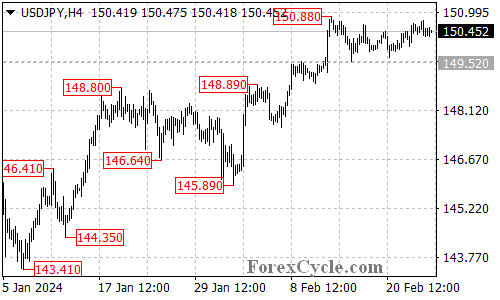
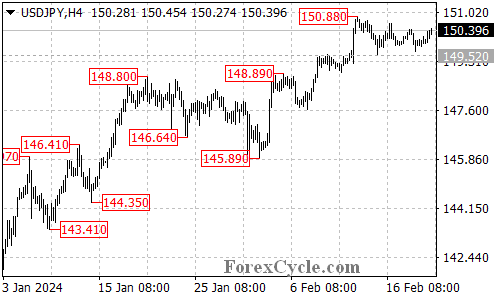
USDJPY has been stuck in neutral territory, oscillating within a trading range between 149.52 and 150.88. This sideways movement leaves the near-term direction unclear, prompting questions about whether it’s a pause within the uptrend or a sign of a potential reversal. Let’s delve into the key support and resistance levels to understand the possible scenarios.
Uptrend on Hold? Sideways Consolidation as a Signal
149.52 Support: The Bullish Anchor: As long as the price remains above this crucial support level, the uptrend initiated at 145.89 remains valid. This suggests the current sideways movement could be a healthy consolidation phase within the ongoing uptrend.
Breakout Potential: If the bulls manage to accumulate enough strength and push the price above the 150.88 resistance level, it could signal a breakout from the range and trigger a further rise towards the 151.90 resistance, potentially solidifying the uptrend.
Downturn Signals: Watching the Support Crack
149.52 Breach: A Reversal Indicator: A breakdown below the 149.52 support level would be a significant development, potentially indicating a completion of the uptrend from 145.89. This could lead to a decline towards the next support zone around 148.80, marking a potential trend reversal.
Overall Sentiment:
The current technical picture for USDJPY presents conflicting signals. The sideways movement creates uncertainty, leaving the near-term direction unclear. While holding above 149.52 and breaking above 150.88 suggest potential bullish continuation, a breakdown below support could signal a trend reversal and further decline. Monitoring the price action around the mentioned support and resistance levels will be crucial in determining the pair’s next move.
Disclaimer: This analysis is for informational purposes only and should not be considered as investment advice. Please conduct your own research before making any trading decisions.
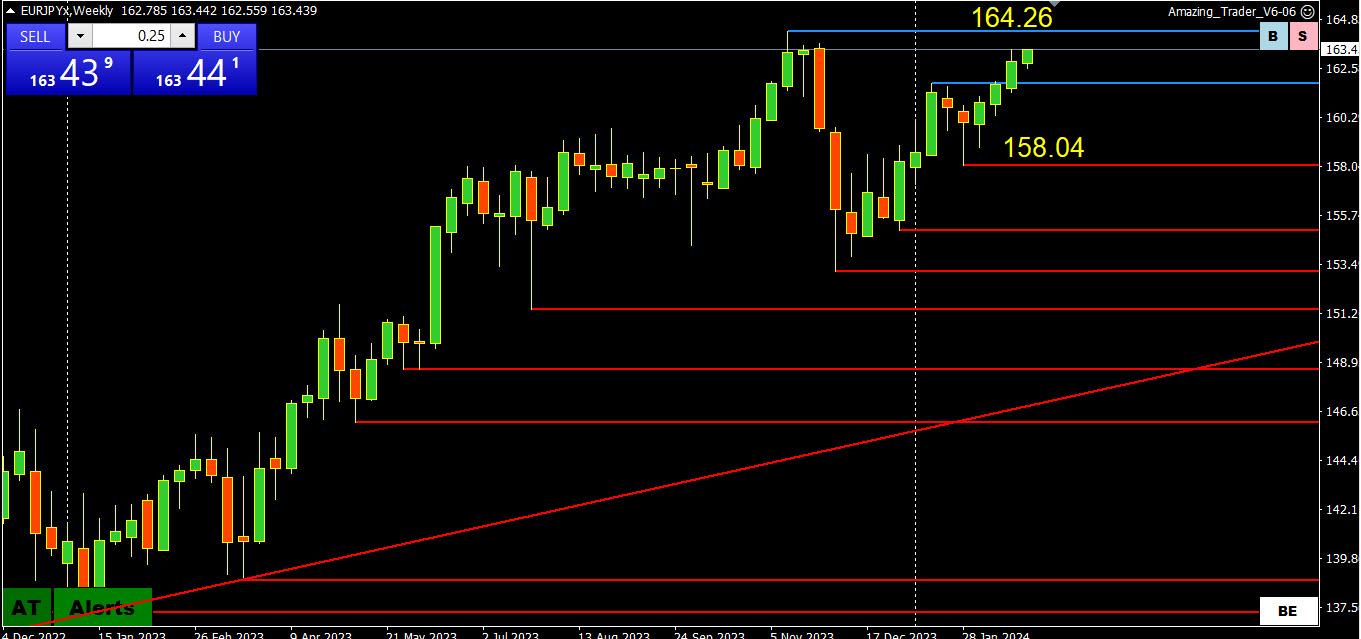
There is not much to say about this pair, except that Pattern wise it is destined to try 152.000 area.
Problem comes from the fact that we have already double top in place, and if rejected for the third time, it will be not only technically visible, but would mean that BOJ decided to put Money where their Mouth is.
We can always see sharp drops in JPY , followed by even sharper ascent . But any possible drop below 145.000 and consequently 143.300 would put the whole Up trend in question.
Monthly yields are up, yearly yields are down. Not a unanimous vote for the day. Believe Aud/Jpy should hold 98.65. Like long side of Eur/Jpy from 162.50 area still though not expecting much. See 150.30 area holding.
With bond yields edging up and BoJ dragging its feet there are probably a lot of carry trades being put on
With Nikkei soaring to record highs, there seems no rush for the BoJ unless it wants to replace verbal intervention with a rate hike hint risk comment.
Markets will soon start looking ahead to a hot PCE inflation release next week, which is also on month end.
Usd/Jpy is an equilibrium price for the pair in our model, the pair has been sideways overall for 5 days. As long as the market is not too aggressive in the eyes of the BOJ I could see the market testing 151 due to interest rate differentials and other factors, but clearly that level is a concern for the BOJ. A bit of a quandy. Favoring the bid from the 149.50 and 150 areas unless the market gives up.
USDJPY Analysis: Sideways Movement Continues, Resistance and Support Levels
The USDJPY pair has attempted to break below the 149.52 support level but failed and has since moved sideways within a trading range between 149.52 and 150.88.
As long as the 149.52 support level holds, the sideways movement could be seen as consolidation for the uptrend from 145.89. A breakthrough of the 150.88 resistance level could trigger another rise towards the 151.90 resistance level.
On the other hand, a breakdown below the 149.52 support level would indicate that the upside move from 145.89 has already completed at 150.88. In this case, the pair would find support around the 147.50 area.
Short for Eur/Jpy is 162.57 with a very, very tight stop. Aud/Jpy is same fashion. Not short Usd/Jpy due to USD strength overall. These are only small pip trades and only for the bored and agile, as well as being counter trades. Purely intra-day. The proper call has been to be long these pairs.
Preference this morning has been a long aud/jpy, long eur/jpy, long usd/jpy so far, but now countering out of boredom and seeing possible exhaustion even if only for small pips
In case anyone is completely bored and looking for an intra-day play I am short Eur/Jpy as a counter trade, a bit risky, move at your own comfort level. Usd is bid overall.
JP – Indeed. Hence the only thing that looks good until the minutes is long Aud from 6550 just for pips, long Usd/Chf from 8790 for the same reason, and job Usd/Jpy in and out. Then the market may talk with the minutes.
Author
Search Results
Viewing 20 results - 1,401 through 1,420 (of 1,461 total)