This caught my attention in the Reuters Morning Bid report I posted earlier
Yet, the BOJ has made it clear that official rates will only be going to zero and there will not be a series of hikes, so the death of the carry trade is likely overstated.
Of interesting note: “All economic models are wrong, but some are useful,” Huw Pill concluded in a letter to lawmakers last June that laid out the limitations of prediction methods. “We should really be thinking of economic forecasts in terms of probability distributions,” said Stephen Millard, deputy director of Britain’s National Institute of Economic and Social Research, who spent more than 26 years at the BoE.
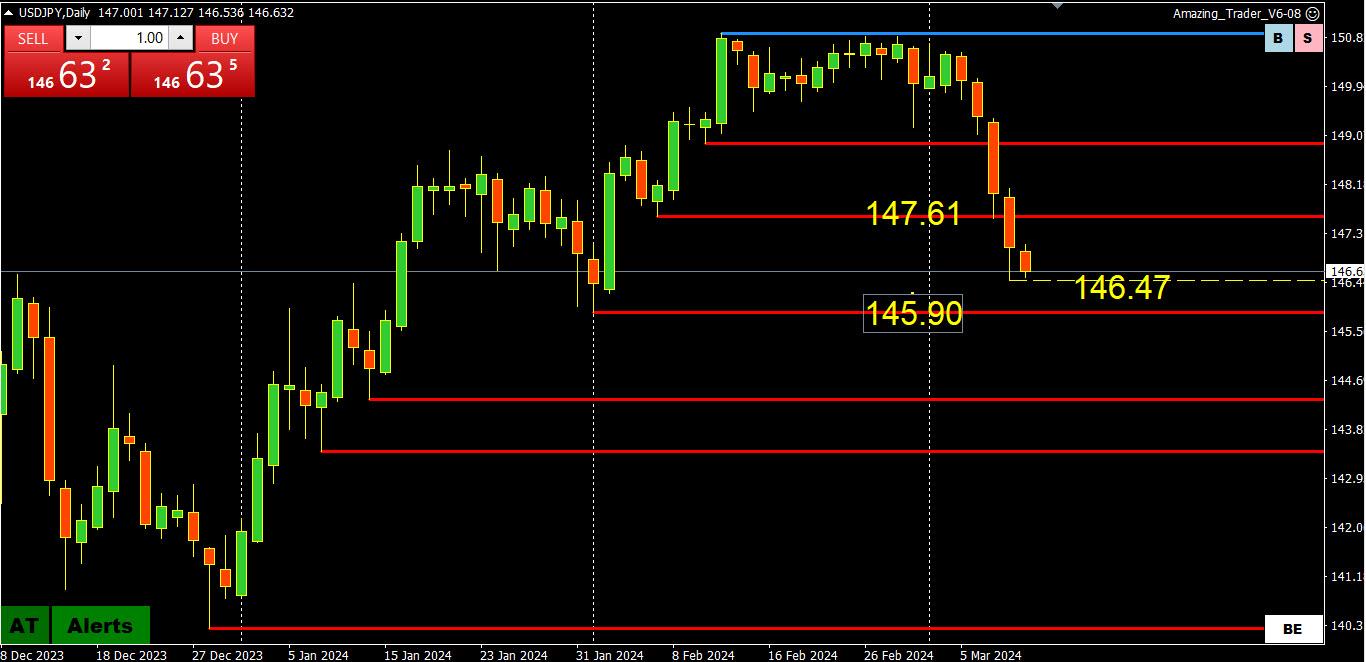
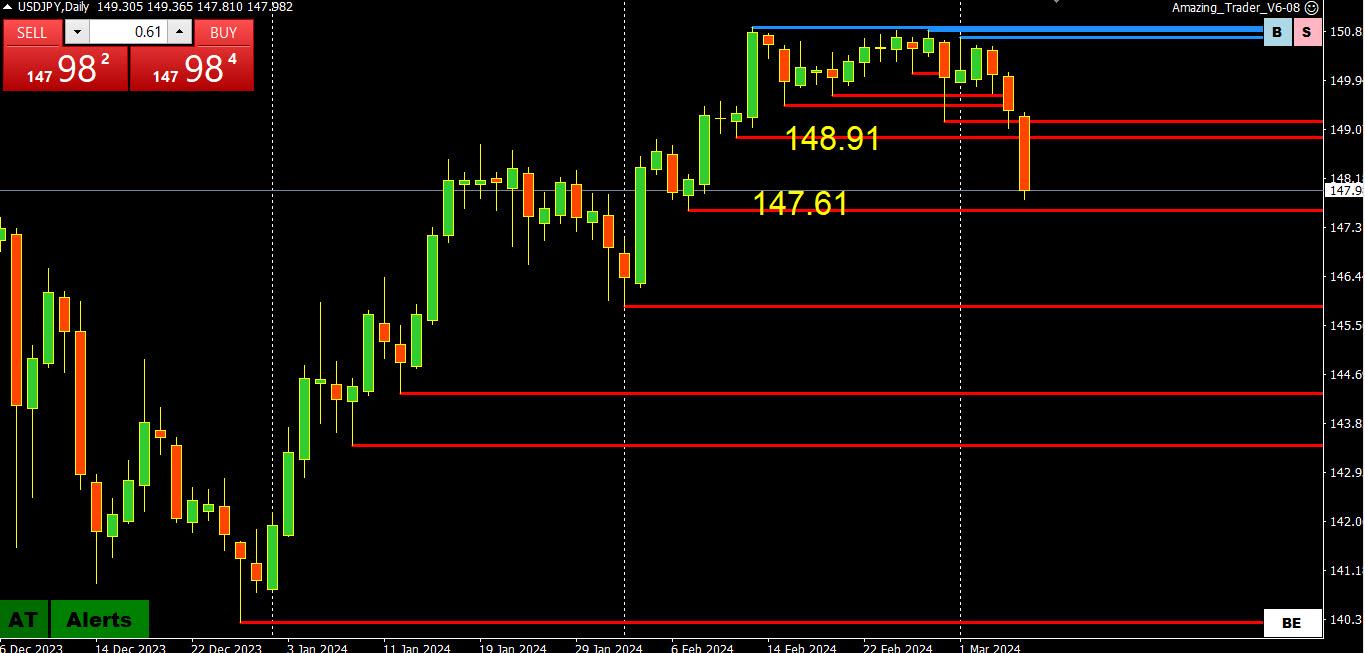
As noted last week, the break of 147.61 exposed 145.90 as the next target.
Another test just below 146.50 suggests this will be the pivotal level determining whether there will be a run at 145.90 and then 145.
As also noted (when USDJPY traded below 148), expect a limited USDJPY upside ahead of the March 18-19 BoJ meeting where there is a risk of the neverending story of a rate hike to bring Japan out of negative interest rates finally reaching a conclusion.
USDJPY Technical Analysis: Key Levels and Potential Scenarios
USDJPY’s downward momentum from 150.88 has extended to a low of 146.47, currently testing the support level at 145.89.
The initial resistance level is located at 147.25. As long as this resistance level remains intact, the downside move is likely to persist. A potential breakdown below the 145.89 support level might trigger further downside movement towards the 144.30 area.
On the upside, a decisive breakout above the resistance level at 147.25 would suggest that consolidation for the downtrend is underway, with the pair potentially encountering resistance around the 148.00 region.
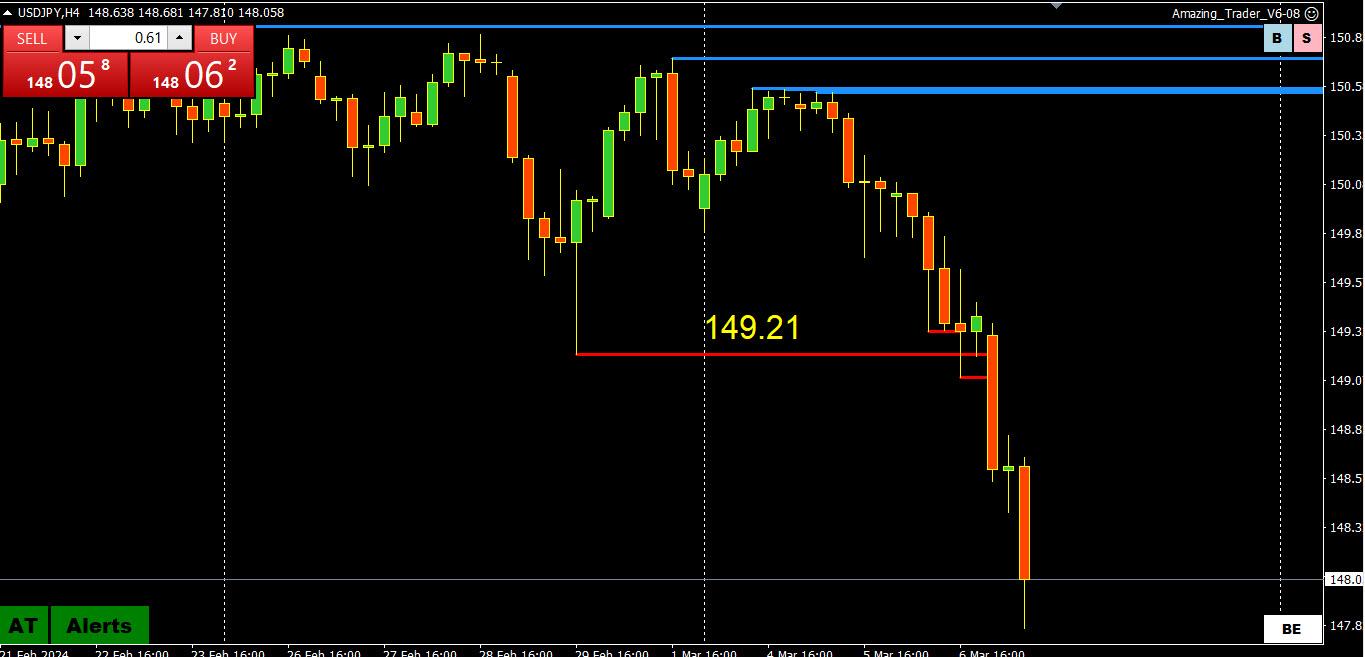
Red AT support lines are being broken like Swiss cheese in a market likely thinned awaiting the US jobs report today.
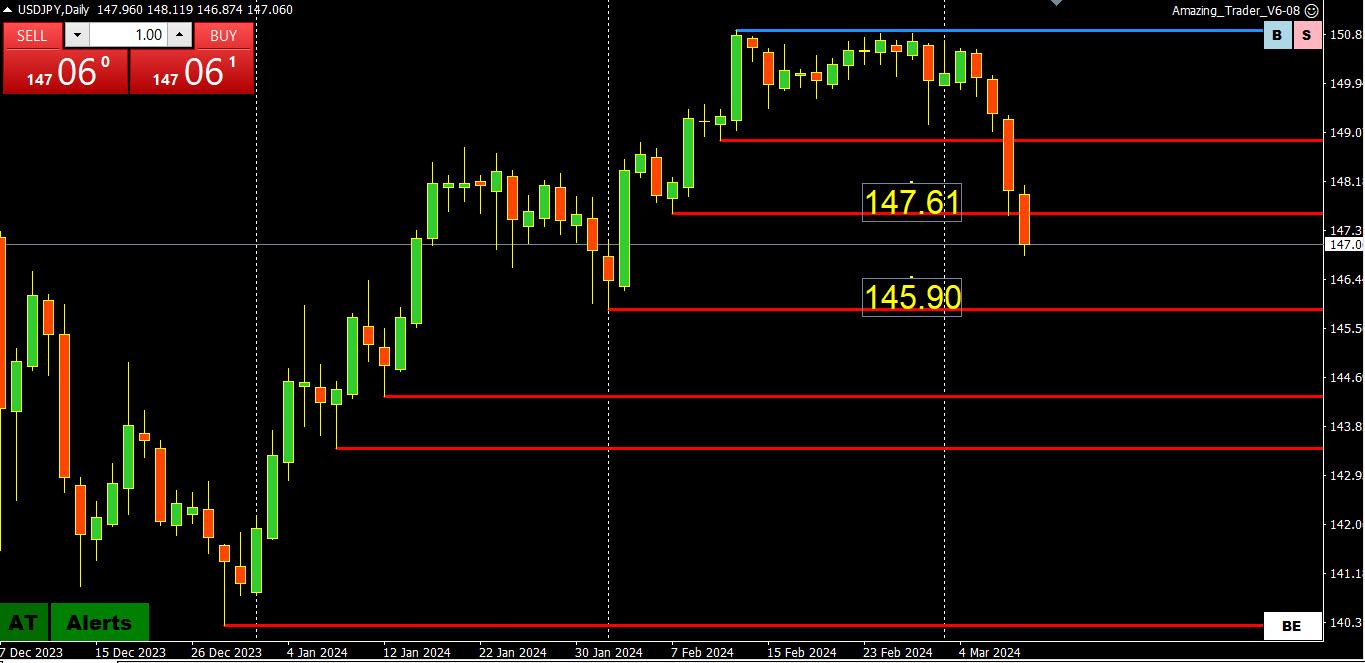
With consolidation around 148 failing to last, the break of 147.61 leaves a void until 145.90.
On the upside, resistance is now between 147.61=148.00. Only back above 148 would deflect the risk
From the earlier Reuters article, suggests a limited USDJPY upside ahead of the BoJ meeting:
Bank of Japan (BOJ) officials have begun ramping up their hawkish rhetoric and shown increasing confidence that the Japanese economy was moving towards the BOJ’s 2% inflation target, just ahead of the central bank’s March 18-19 policy meeting.
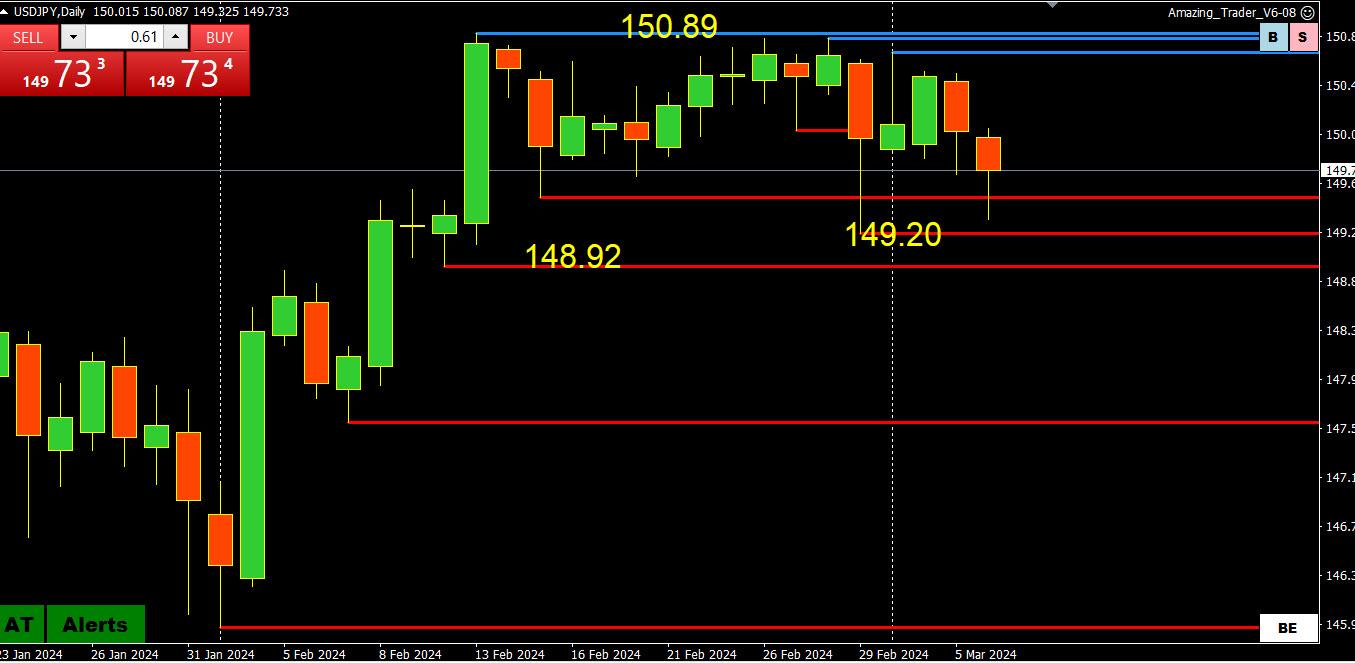
Those following my posts have seen me use the term “invisible hand” to describe some force preventing USDJPY from breaking the 150.89 level.
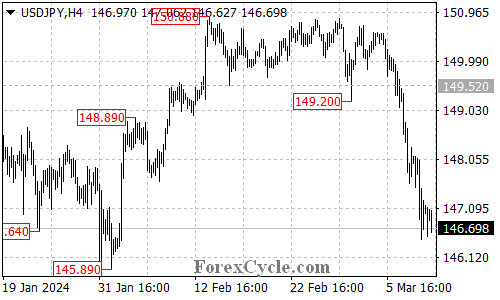
Looking at this 4-hour chart shows (note 3 lower AT blue lines on top) a currency running out of steam.
When you look at my charts take notice when you see 3 higher red or 3 lower blue lines (using The Amazing Trader = AT) as it is often followed by an acceleration of a move in the direction of the lines (applies to any time frame).
I am posting a daily chart to show the next key support level at 147.61 but in the absence of any nearby resistance after the sharp fall, look for 148 to replace 150 as the new pivotal level. Below 147.61 shows a void until 145.90.
Back above 148.91-149.21 would be needed to negate the risk and shift the risk back to 150.
I will post a 4-hour chart next to show the top was pretty clear.
JP – one would think! As long as they keep liberal arts out of it, but it doesn’t go that way in places like Berkely Univ. My belief is 1 hour field trips into the worst banks in one’s locale would be more of a lesson in one day than 10 semesters of politically slanted blab mixed in. Side note – I think ChfJpy is finished with the 170 to 171 range. Maybe one more push in there but expecting no dice.
JP – I’m long UsdChf with you and have a resting buy in Usd/Cad lower toward the figure. On the side, EurJpy is virtually guaranteed to get to 162 at least ultimately in time.
GV – No way I am on the buy side of UsdJpy, even if it takes off uphill, with the BoJ lurking. For me, its sell buy waves and deploy resting/trailing sell stop entries.
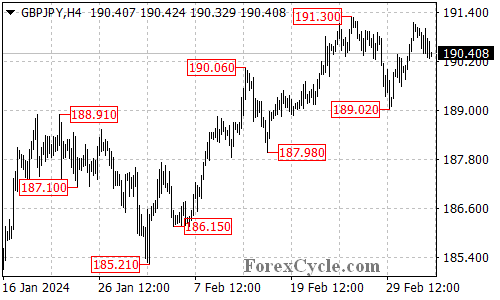
GBPJPY Analysis: Current Levels and Potential Scenarios
After an unsuccessful attempt to surpass the 191.30 resistance, GBPJPY is currently testing the 190.20 support level.
A breach beneath this support could prompt a further decline towards the 189.02 support level, with a potential target zone around 188.00.
Nevertheless, as long as the 189.20 support remains intact, there is a possibility of a renewed ascent towards retesting the 191.30 resistance. A breakout above this level could signify the continuation of the uptrend originating from 185.21, with the subsequent target likely situated around the 193.00 area.
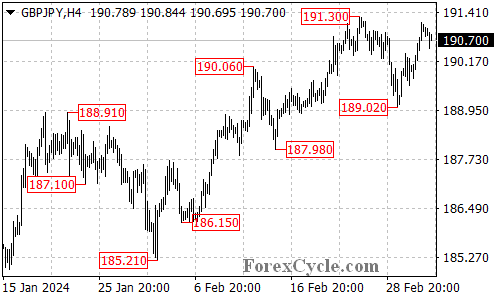
GBPJPY Analysis: Key Levels to Watch for Potential Trend Movements
GBPJPY is currently encountering resistance at the 191.30 level. A breakthrough above this point could indicate a continuation of the uptrend from 185.21, with the next target potentially located around the 193.00 area.
The initial support level stands at 190.20. If this level is breached, it may initiate another descent towards testing the 189.02 support level. Further downside movement could target the 188.00 area.
Re: Reuters – Strongly – considering – thinking – tightening …Ehmmm…still USDJPY should try for the highs once again….Oh I forgot Likely ….and where is the money to support that blubber ???
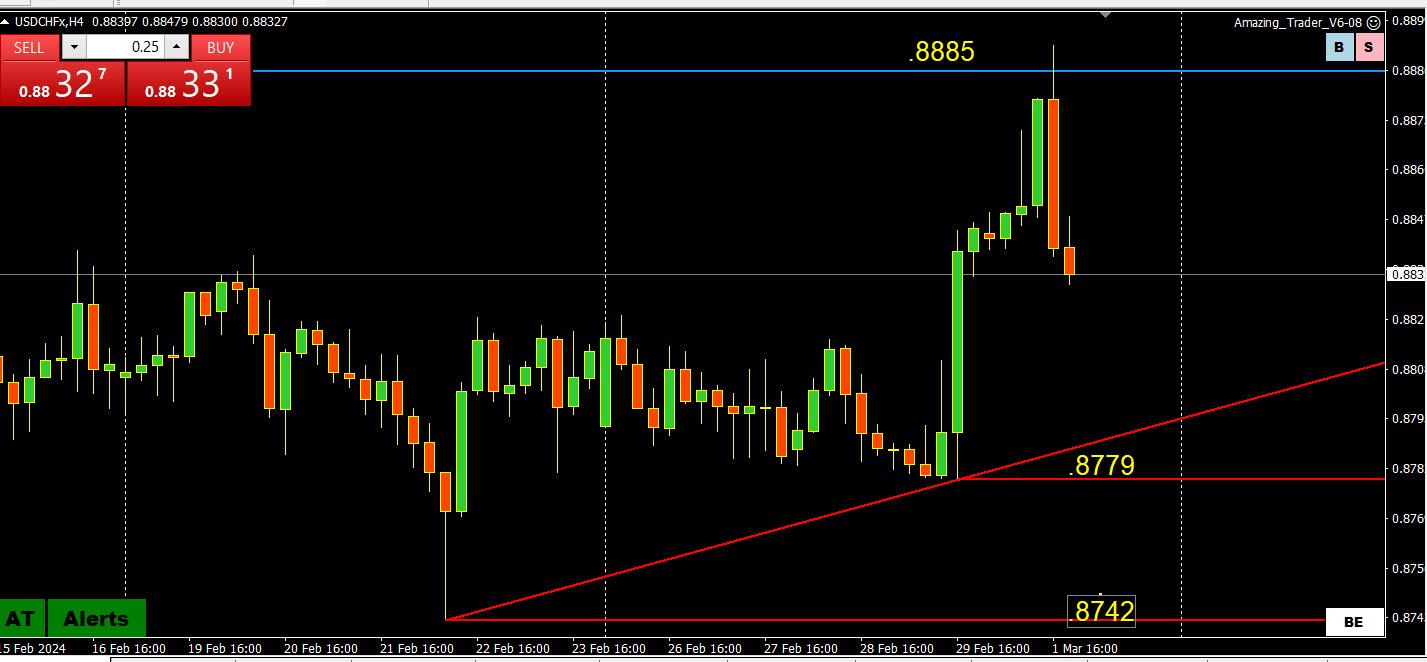
I swore off trading the CHF after the infamous 2015 SNB-inspired flash crash (new traders should Google it) but JP has alerted me to perhaps start trading it again.
This chart shows a failed breakout and subsequent retreat. Ket levels can be seen in the chart.
The CHF along with the JPYT are two of the most sensitive currencies to moves in US interest rates although respective central bank risk is in the opposite direction. . The SNB is seen as the most likely CB to cut interest rates first while the market is waiting for the BoJ to finally raise rates.
Author
Search Results
Viewing 20 results - 1,361 through 1,380 (of 1,461 total)