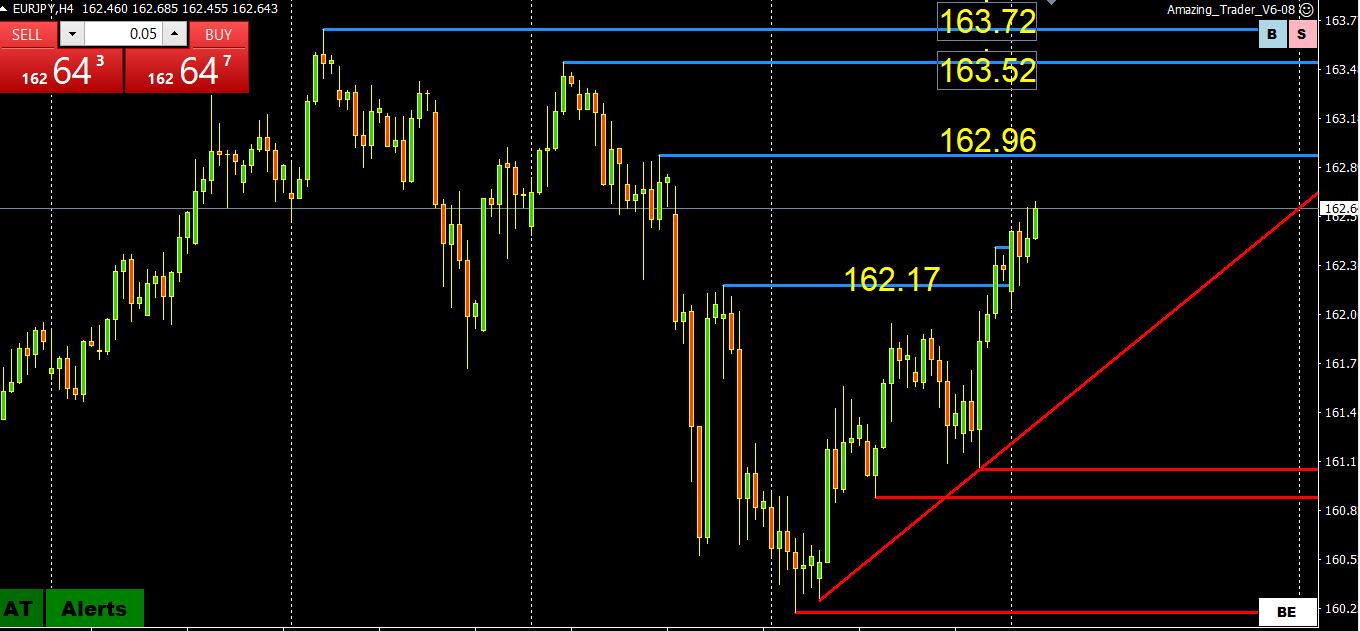
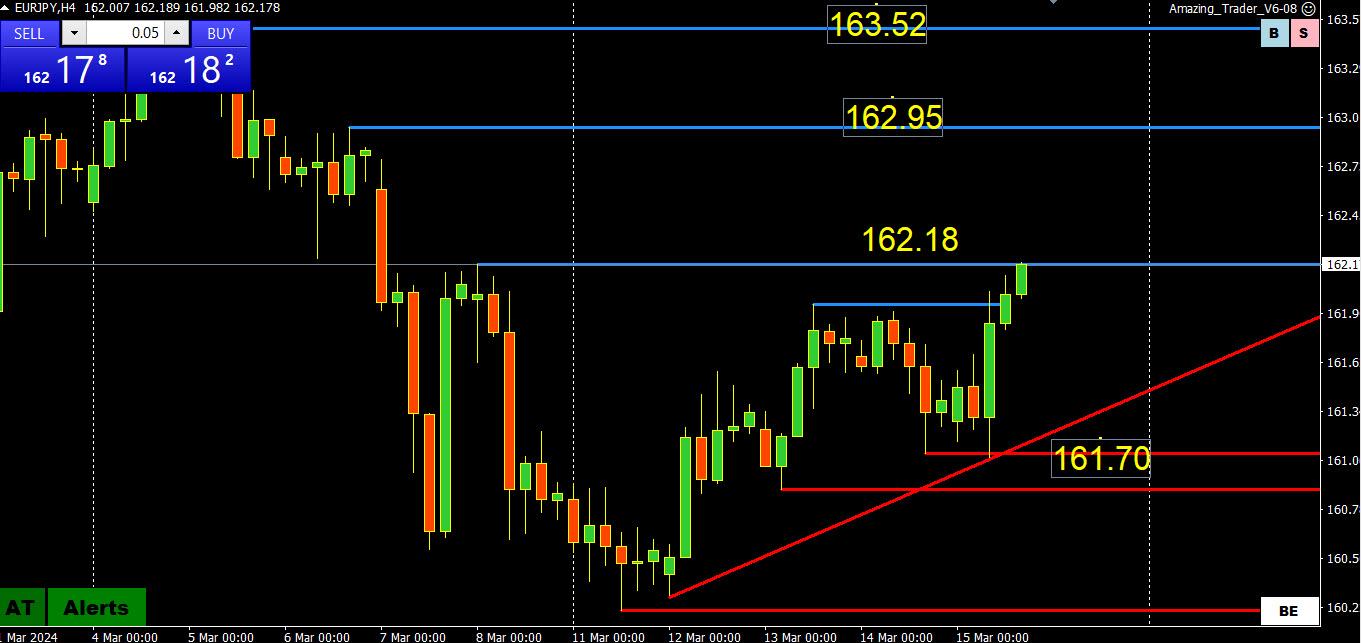
The key flow giving EURUSD support is a firmer EURJPY ahead of the BoJ decision early Tuesday.
If you want to sell JPY and not force the BoJ to intervene, one way is to follow the path of least resistance, which is on its crosses.
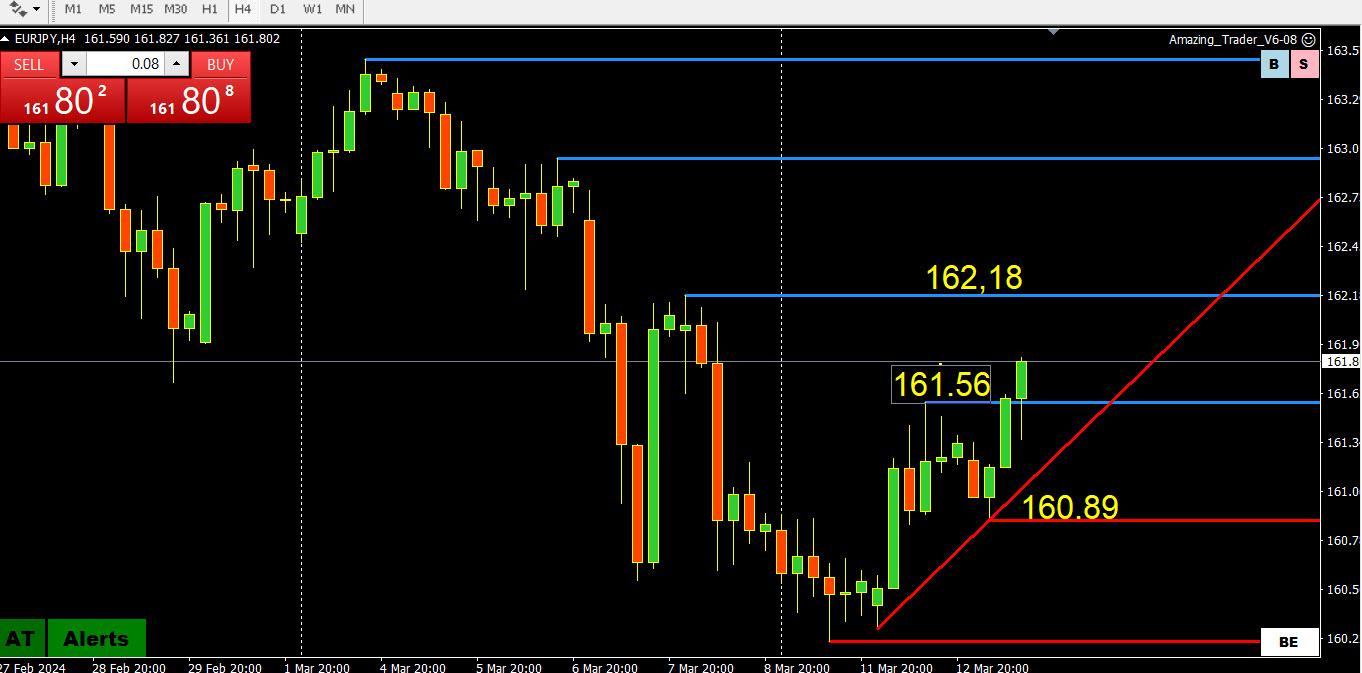
The chart shows 3 levels of resistance above the market and on the downside, needing to hold the 162.17 level to keep a bid.
As SF Monege pointed out. the prudent approach is to step back and let the dust settle on the BoJ decision as all that is certain is that there should be volatility following it.
THE FOCUS TO START THE WEEK WILL BE ON USDJPY AND JJPYCROSSES AHEAD OF THE BOJ MARCH 19 DECISION.
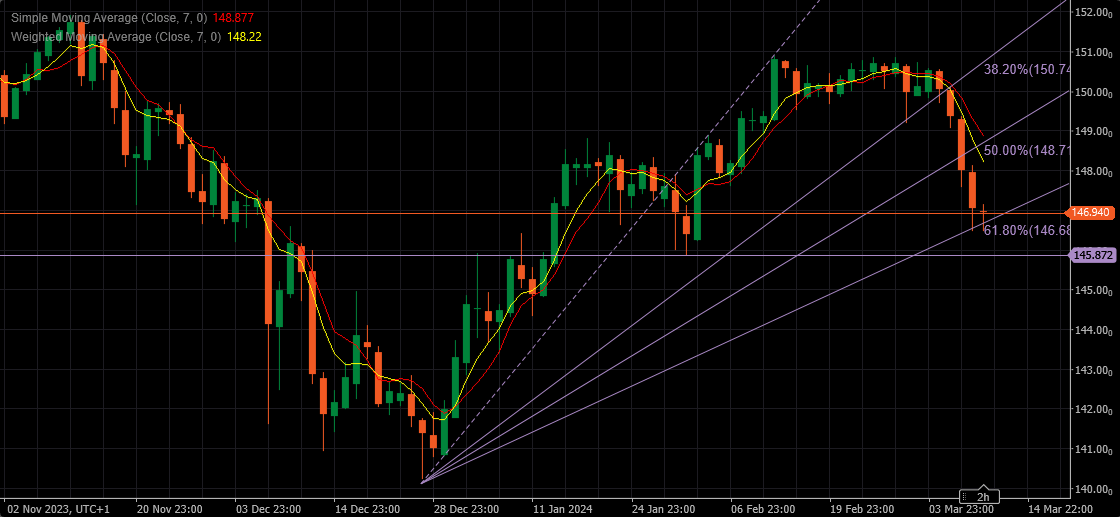
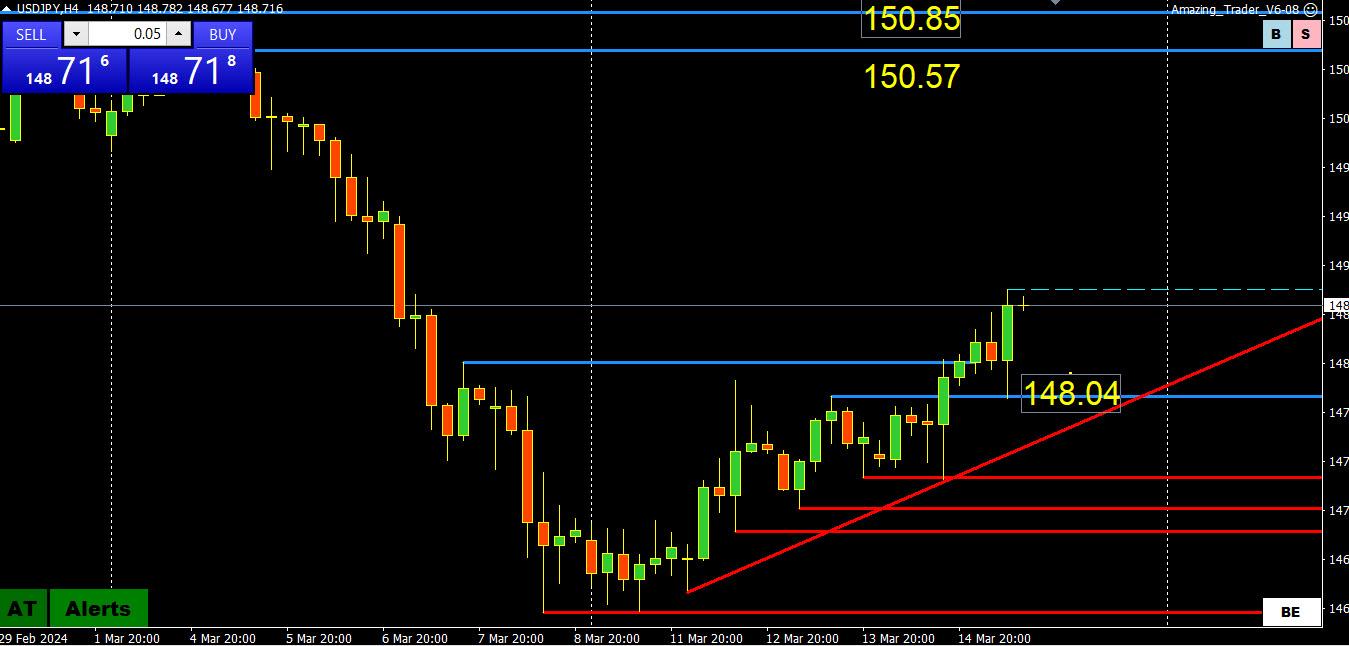
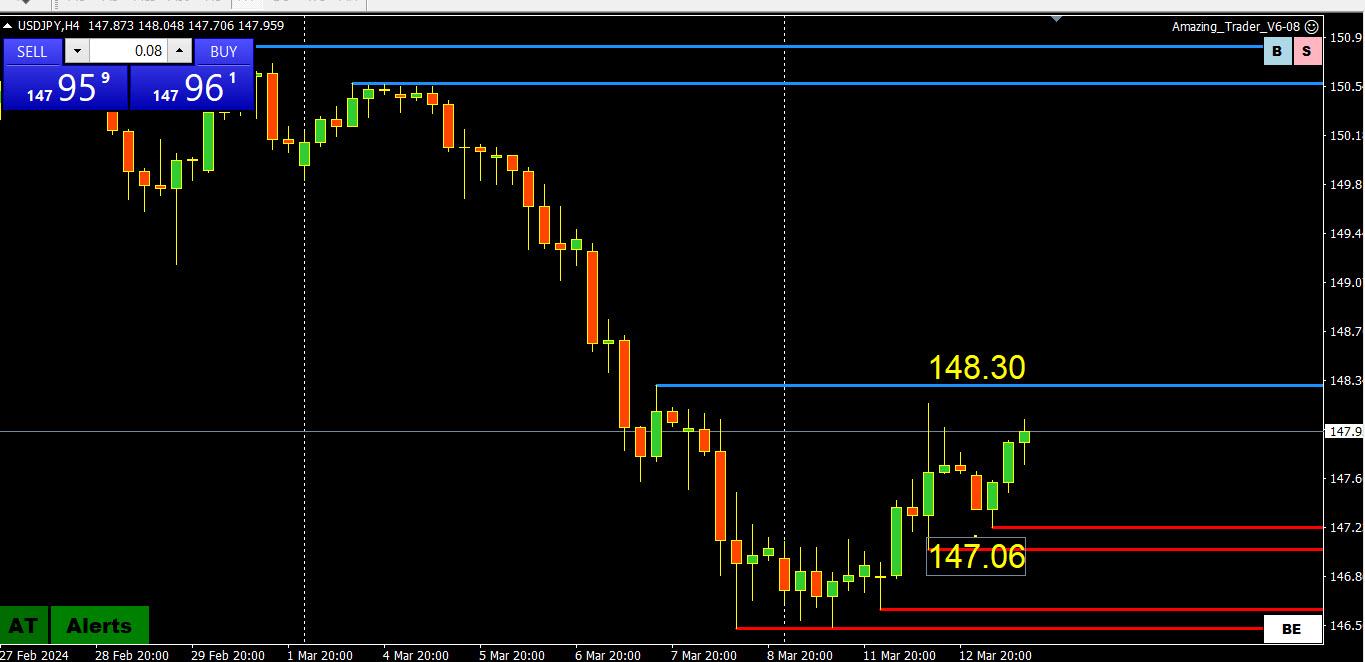
The only levels that really matter are 148 and 150 as key levels lie outside of it although 148.03 (and the trendline) are key supports on this chart (suggests 149 as the midpoint)
Hah…. Thanks, I think. Funny day. Just when I thought ok we’re set for some across the board directional follow thru -> Nothing.
Lets review
– Quad witching today.
– US yields higher.
– BoJ guy hints at policy rate change (higher) at next weeks meeting.
– Dovish comments on economy and rates (lower) from ECB guys.
Yet-> JPY weaker, EUR stronger against some flat against others, Copper Silver higher. Not a whole lot of logic found here.
FX market (read EUR) remains as non-comital as it’s been over the last year. I think it’ll stay that way with a bias against the weak links (chf) over the next few weeks.
Stocks I think are running on air which could see a downdraft the next six weeks or so. That said is it really worth trying to time the stock market as in the long run it only goes up.
Bonds not going up any time in the forseeable future. There’s A LOT of people that enjoy earning an effortless 5%……
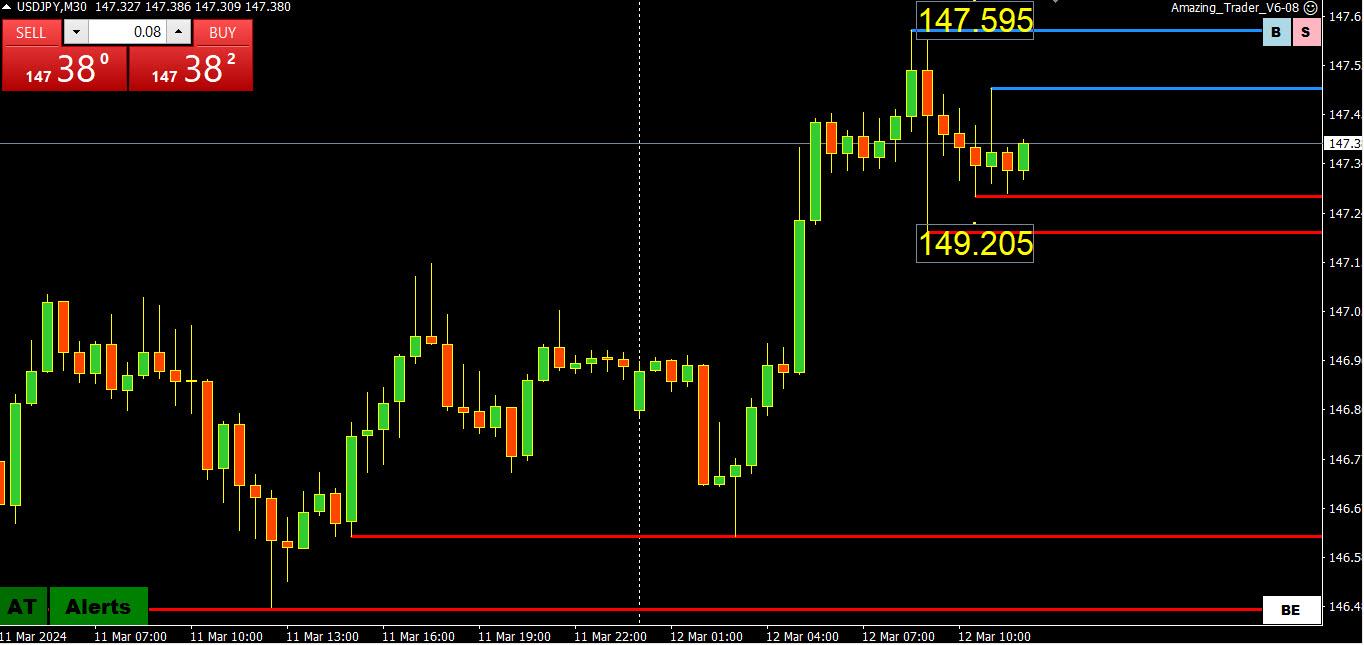
USDJPY 30 MIN CHART – Correcting but still below the latest breakdown level
A failure to decisively break below 146.50 leaves the range to 148. On the other side, only 148+ would deflect risk on the downside.
As I noted, 147.61 was a breakdown level so the one blocking a shift in risk back to 148. So far the rebound has paused just below it.
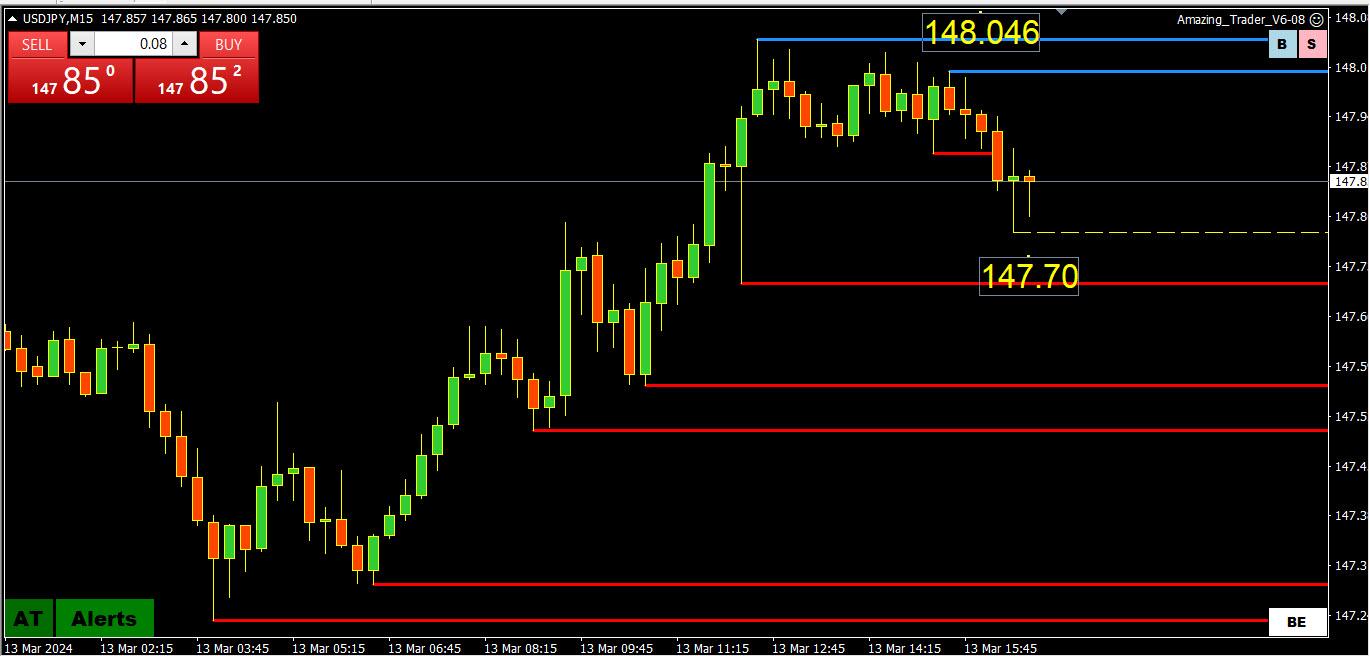
Intra-day levels are in the chart.
NOTE
USDJPY bounced after BoJ Gov Ueda, testifying, gave no hint of a rate hike at next week’s meeting. He said we will see what data shows later in the week.
If trading USDJPY, do it intra-day as one off-hand comment overnight can send this pair up or down as market awaits next week’s BoJ decision.
Ok in on the buy side CadJpy108.81 – Not for the squeamish to buy against Yen right now, riding in the money shorts in other pairs so worth a shot with no apprehension to bail fast. I get bored especially in Asia.
If GbpUsd does in fact find a bid toward 2850 I am really eyeballing GbpJpy 189 or the 189.20 area to re-enter short again depending on strength of conviction. Data from Japan in 10 minutes. My approach can be very aggressive at times so if you are new to this taking your time with it is prudent.
A bit different approach to USDJPY
As major supports behind this Up trend are far and away right now -143.250 & 139.000, only approach to trading USDJPY is intraday – time frames from 1h and bellow.
But if we look at it on this Daily chart, the following can be concluded – if in next two days USD finds the strength to go above 148.800 (lots, I know we will be looking at the renewed and even stronger Rally Up.
However, ” If” is not a reliable trading tool, but “Wait and see” comes as a good strategy , so we should accept that approach…
In the mean time, as long as USD is on the defensive, Short it on the smaller time frames given Sell signals , be fast and do not be greedy .
Read earlier that Claude Erb, a former commodities portfolio manager at TCW Group, plots bitcoin’s actual price over the past decade along with Erb’s application of Metcalfe’s Law with the result being a fair value of $35,000 for Bitcoin.
Side note, some ideas for orders I tried to post earlier but it would not post for some reason – buy side AudChf 5790 – Buy side AudCad 8900 – Sell side GbpChf 1260 – GbpUsd Buy side 2812 or lower – AudUsd buy side 6594 or lower – UsdJpy sell side 147.10 or higher –
Author
Search Results
Viewing 20 results - 1,341 through 1,360 (of 1,461 total)
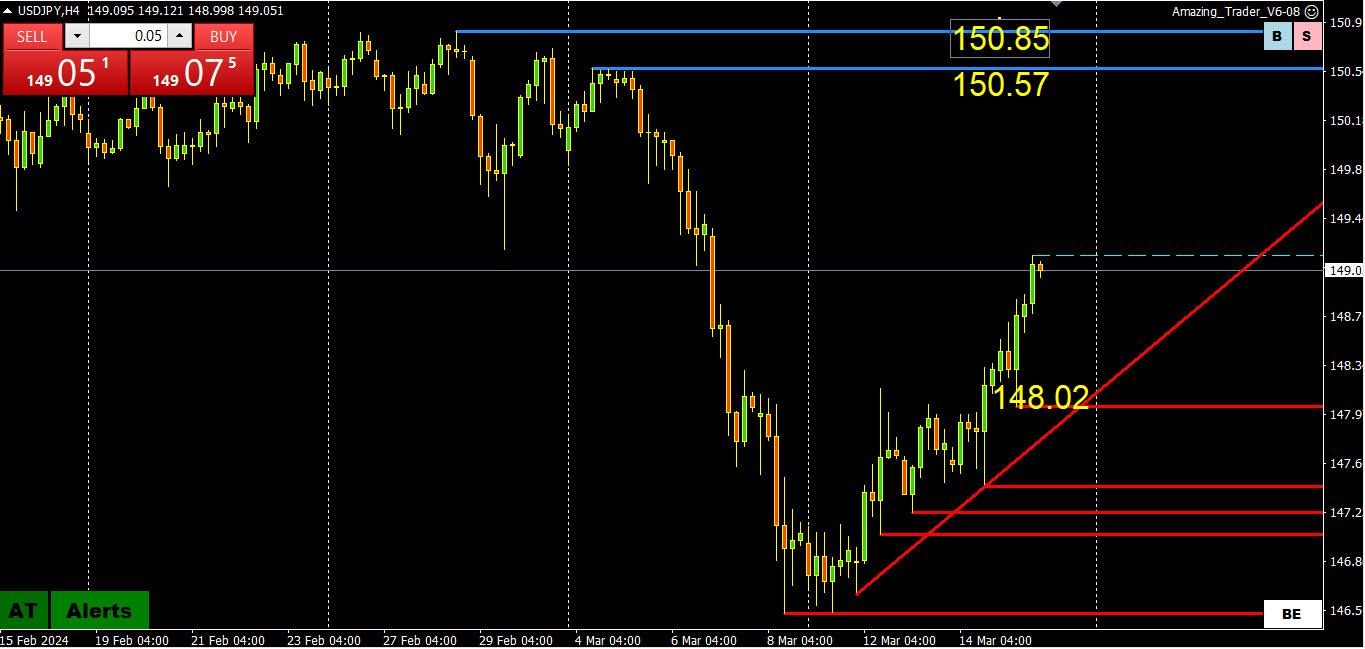

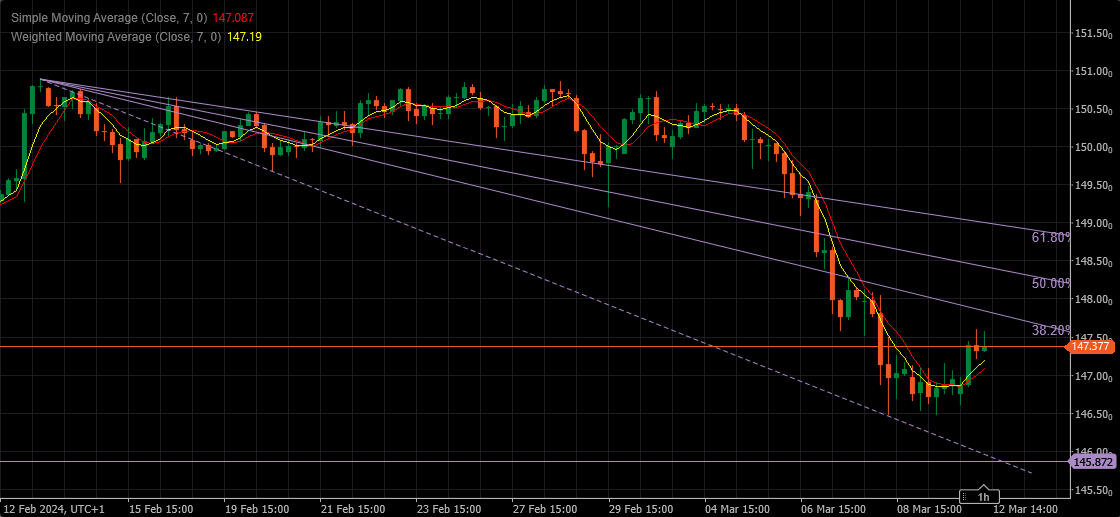 USDJPY 4H Chart – Fibbo Fans