I’m short aussie several pairs especially audcad … everything else got its portfolio mind blown for people yesterday and you can’t legitimize buying usdjpy
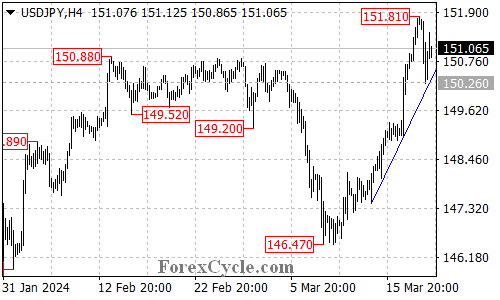
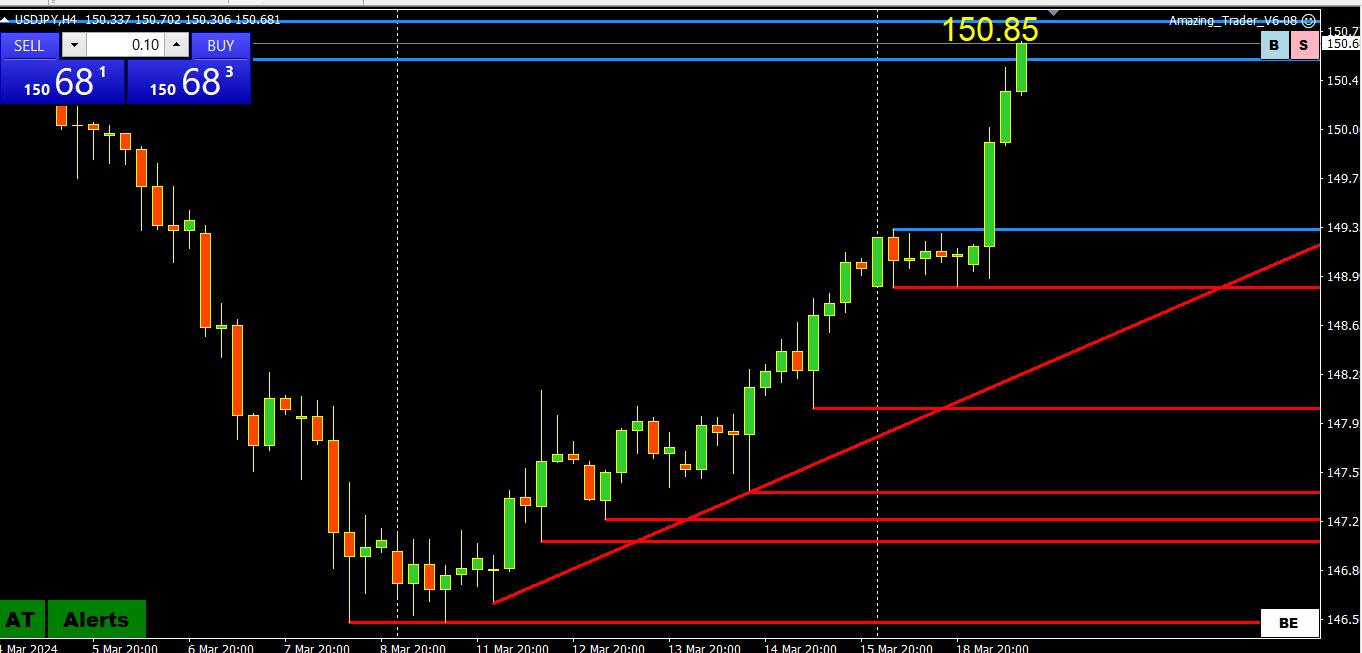
USDJPY has experienced a retracement from 151.81 to a low of 150.26, with the pair now testing the support of the ascending trend line on the 4-hour chart.
If the trend line support remains unbroken, the current pullback from 150.26 could be interpreted as a period of consolidation for the uptrend starting from 146.47. In this scenario, there is still potential for further upward movement towards the 170.00 area after the consolidation phase.
The key support level to monitor is at 150.26. If the price falls below this level, it could indicate the potential completion of the uptrend that initiated from 146.47, with the next target set at the 149.00 area.
With BoJ making a move on rates I think it gave the market less concern over intervention, so Amman’s assessment earlier may be spot on as he usually is. I am just not touching longs in UsdJpy because anything overly aggressive to the upside could put the “I” word back in play. I’m in crosses only pre-Fed.
Viewing a 10 year monthly time frame in UsdJpy the pair went parabolic April of 2022 from 112. One might think BoJ is hoping the Fed/market will cause a pause entering these levels, or they have a quiet agreement with the Fed. Or if they don’t get what they want they will be in the market.
I’m trailing UsdJpy with sell stops entry a bit further out than market and adjust as it keeps going. No way I am long this pair from here out with BoJ lurking.
What there seems to be especially in eur/usd and to some degree gbp/usd is a lack of desire to commit. The weaker links (jpy and chf) are easier to punch down on so there in lies the path of least resistance. That said I don’t get the feeling there are that many people that have been short jpy for months or even weeks…..
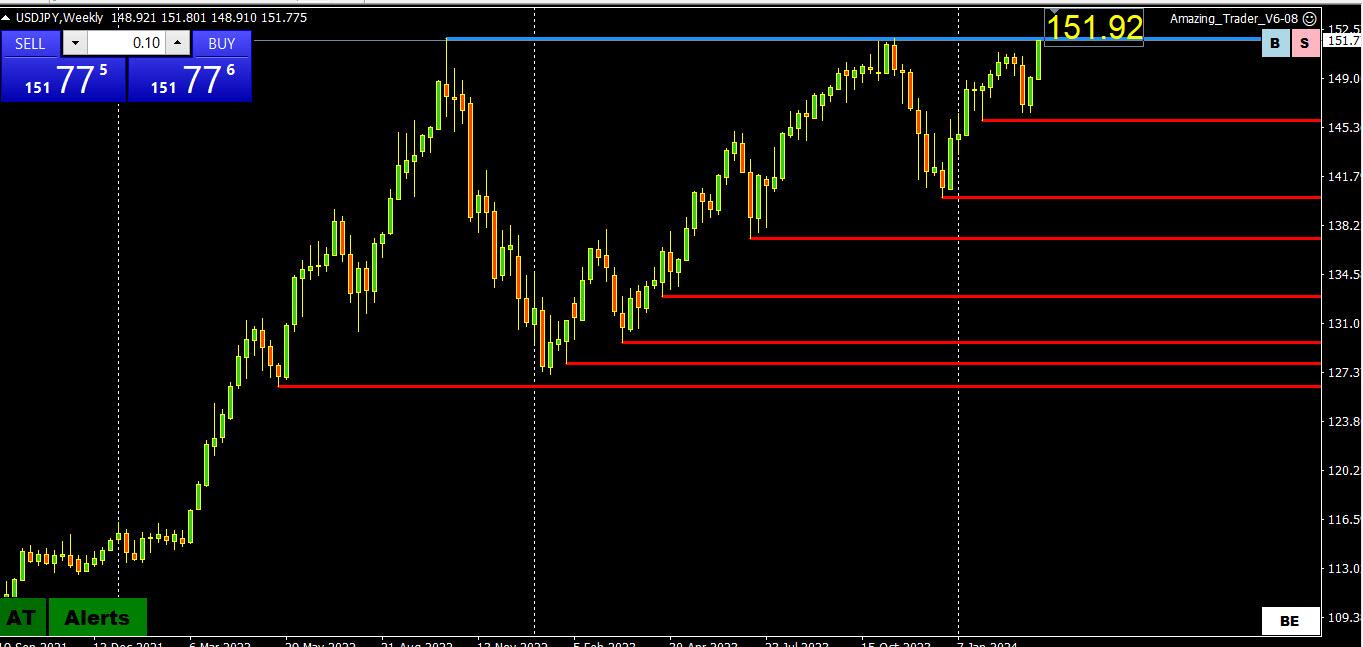
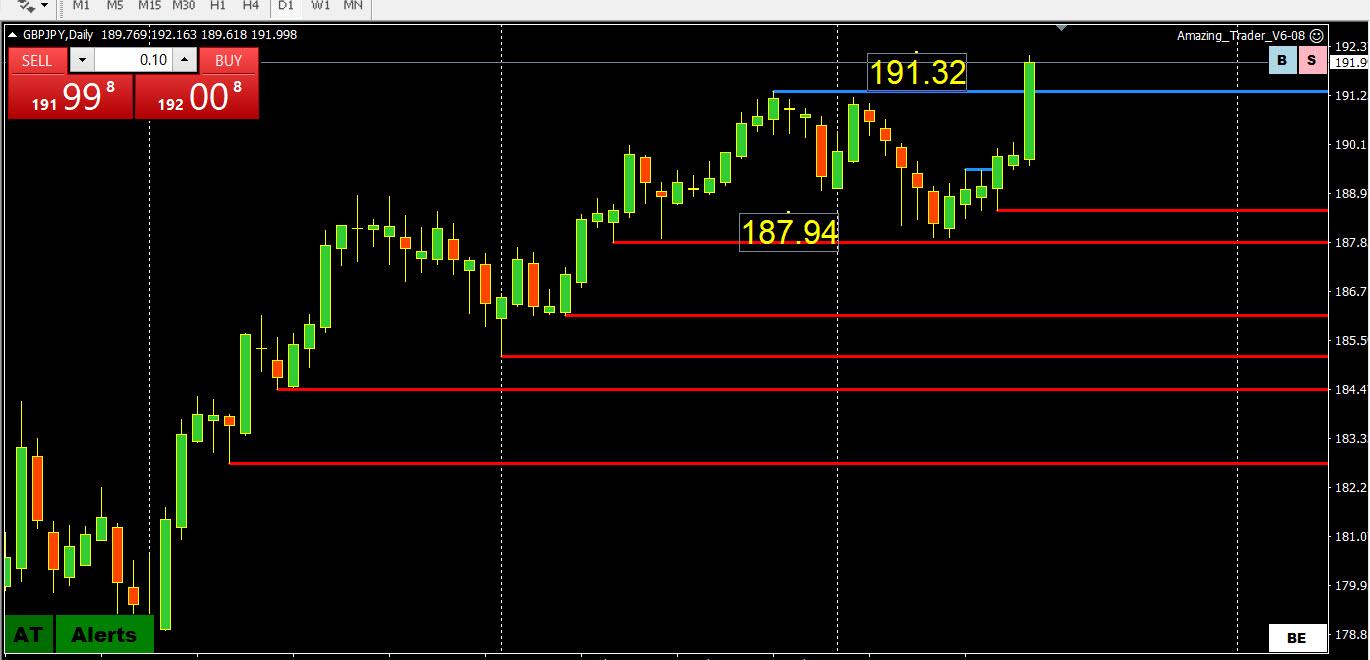
There is only one level worth noting in USDJPY, the major resistance at 151.92
A break above this level would leave a blank on charts so use magic levels (152, 155, etc) as potential targets.
So it is a case of boom or bust at 151.92. If I were in the BoJ’s shoes, I would have 2 choices: defend 151.92 or let it run through 152 and then come in covertly to smack it back down but its shoes are too big for me to fill.
Whatever the case, watch 152 as this will dictate whether there is a run at 153.50 and 155.00 or form a range to 150.00.
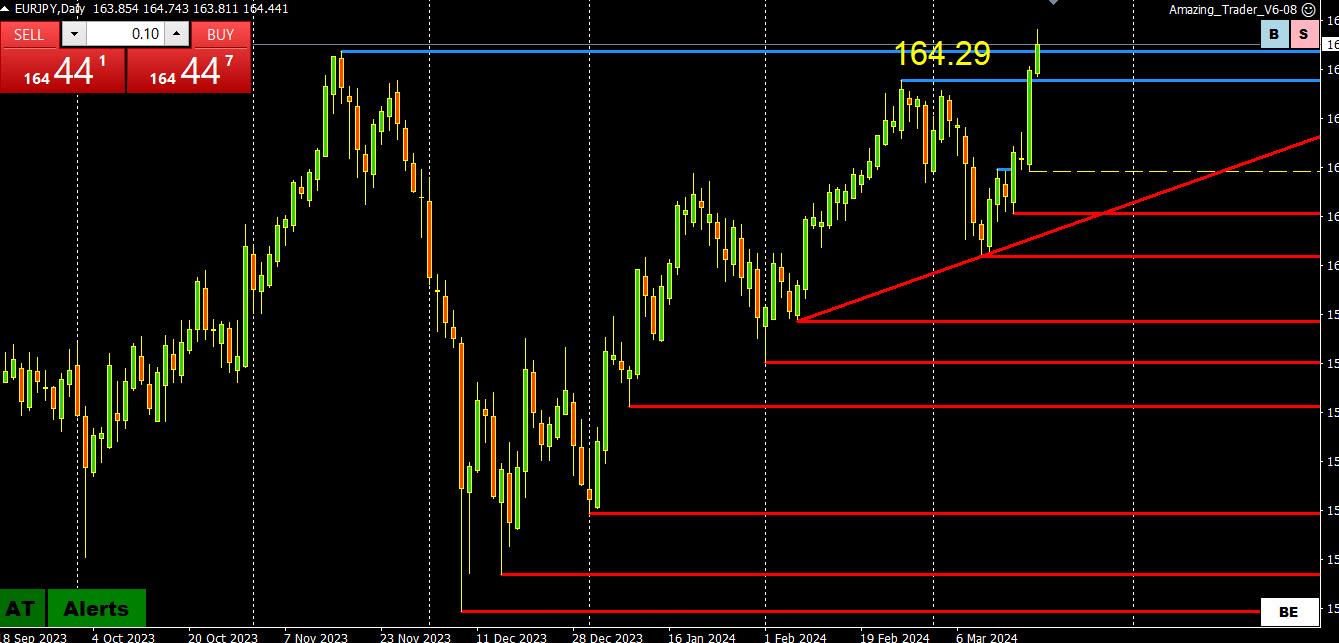
EURJPY is currently an outperformer, following the “path of least resistance:, trading above its major resistance at 164.29. This leaves the next target as guesswork (165 is one of those magic levels). Back below 164.29, at a minimum, would be needed to slow the move up.
Much might depend on whether USDJPY can trade similarly by taking out its major resistance at 151.92.
So far, offsets out of this cross are helping to keep EURUSD above its supports (see prior posts).
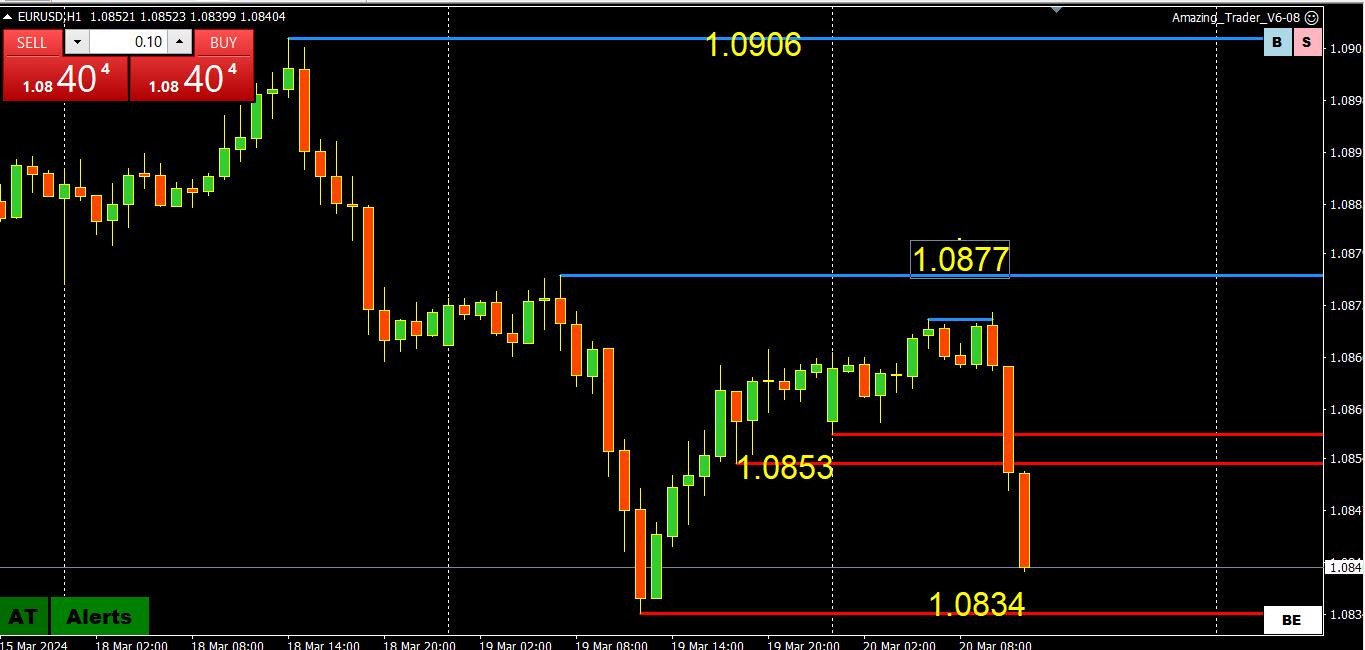
It took 17 1-hour candles to go from 1.0853 to 1.0873 and just 2 to break back below it. This tells you the current risk in a market that has had bouts of what we like to say “trading bid in an offered market” with buying driven more by its crosses (e.g. eurjpy) than outright vs the USD.
I don’t like to draw conclusions from a pair trading in a 43 pip range (1.0834-77) other than to say 1.0887 and 1.0906 would need to be broken to change the picture.
USDJPY Analysis: Breakout and Potential for Further Upside Movement
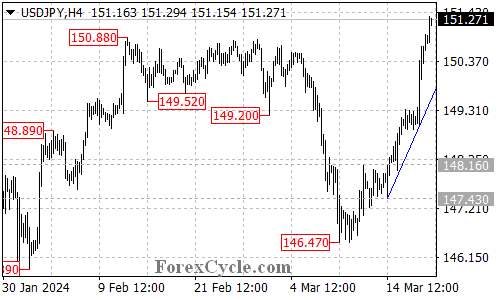
USDJPY has successfully surpassed the 150.88 resistance level, with the upward movement from 146.47 extending to a peak of 151.33.
As long as the price remains above the ascending trend line on the 4-hour chart, there is still potential for additional upward movement in the upcoming days, with the next target estimated around 160.00.
The initial support level to monitor is at 150.35. If the price breaks below this level, it could suggest a period of consolidation for the uptrend starting from 146.47, with the pair likely finding support at the rising trend line.
A decisive break below the support provided by the trend line could indicate the potential completion of the current uptrend.
USDJPY 150.68
–
yen puked ruffly 1% post-boj decision to stop its nega-rate policy in favour of 0 – 0.1% rate.
ueda saying no rush for more hikes. yield down and guarded comments = yen down and dlr up
Just to show you there is a method to my madness when I follow the AT lines
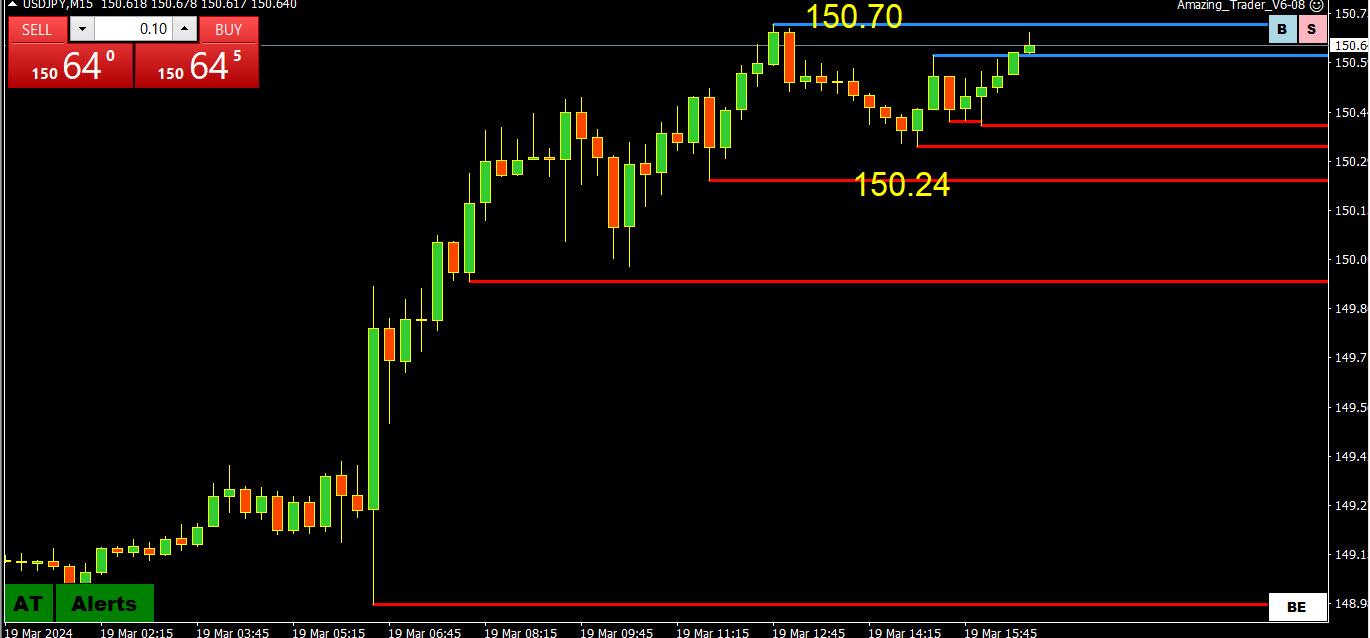
As noted in my earlier post, key levels are at 150.24 and 150.85 (seen on a 4-hour chart) and USDJPY is trading within this range but upper end is exposed while above 150.50
Currently, an invisible hand seems to be back protecting 150.85, at least for now
BoJ’s decision to hike rates and end the era of negative interest rates was not a surprise. Indications of a go-slow approach make this a dovish hike and the JPY has responded accordingly.’
USDJPY targeting 150.85 if it can stay above 150.24-50, with a stronger risk if above 150.57.
If I was in the BoJ’s shoes I would be lurking above 150.50 but only to smooth the move and prevent a full rout by defending 150.85(?).
Note prior USDJPY uodate was deleted in error.
Author
Search Results
Viewing 20 results - 1,321 through 1,340 (of 1,461 total)
 USDJPY 4 Hour Chart