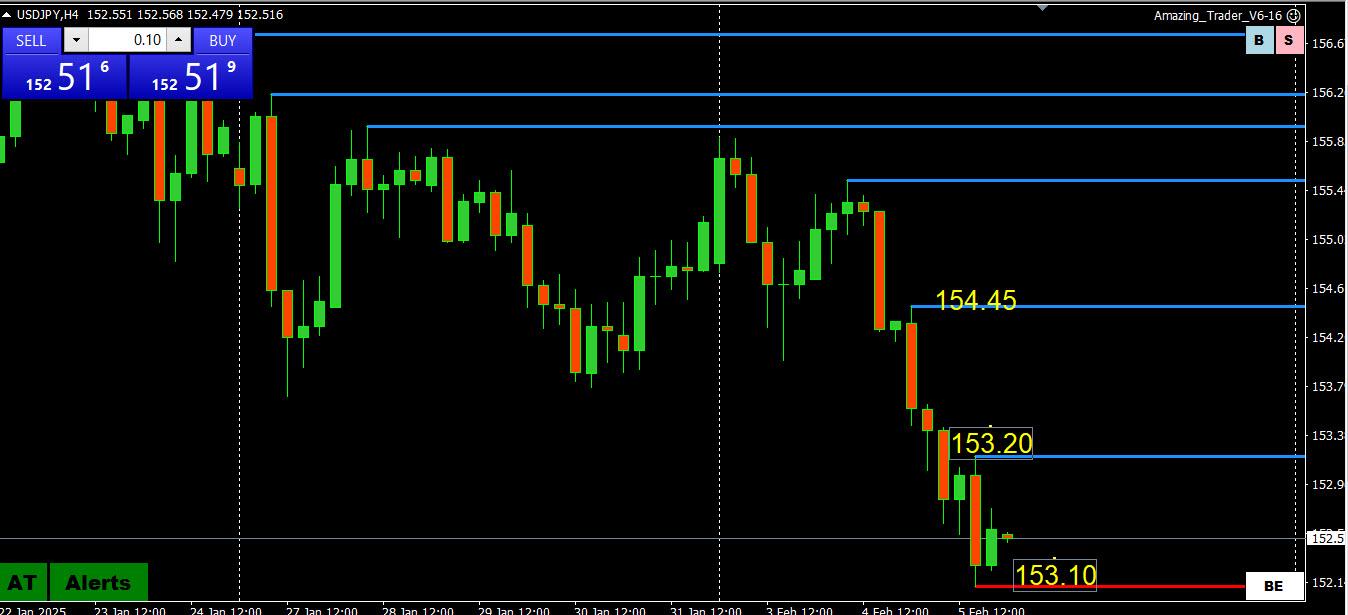
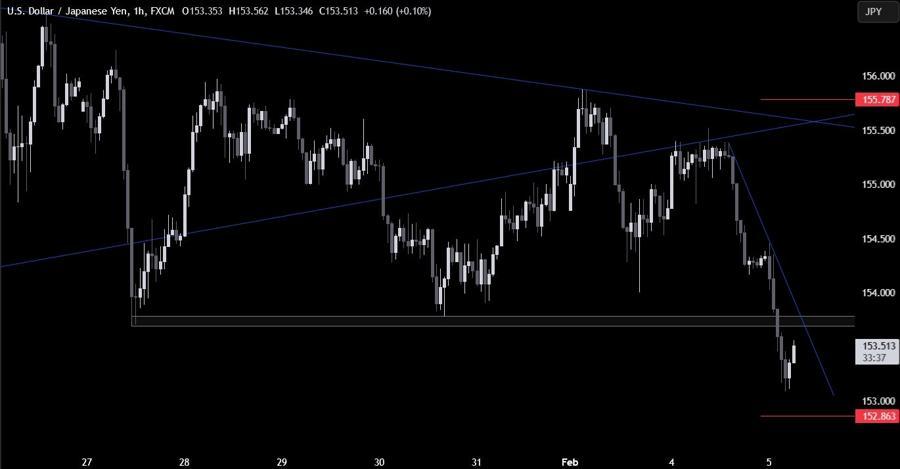
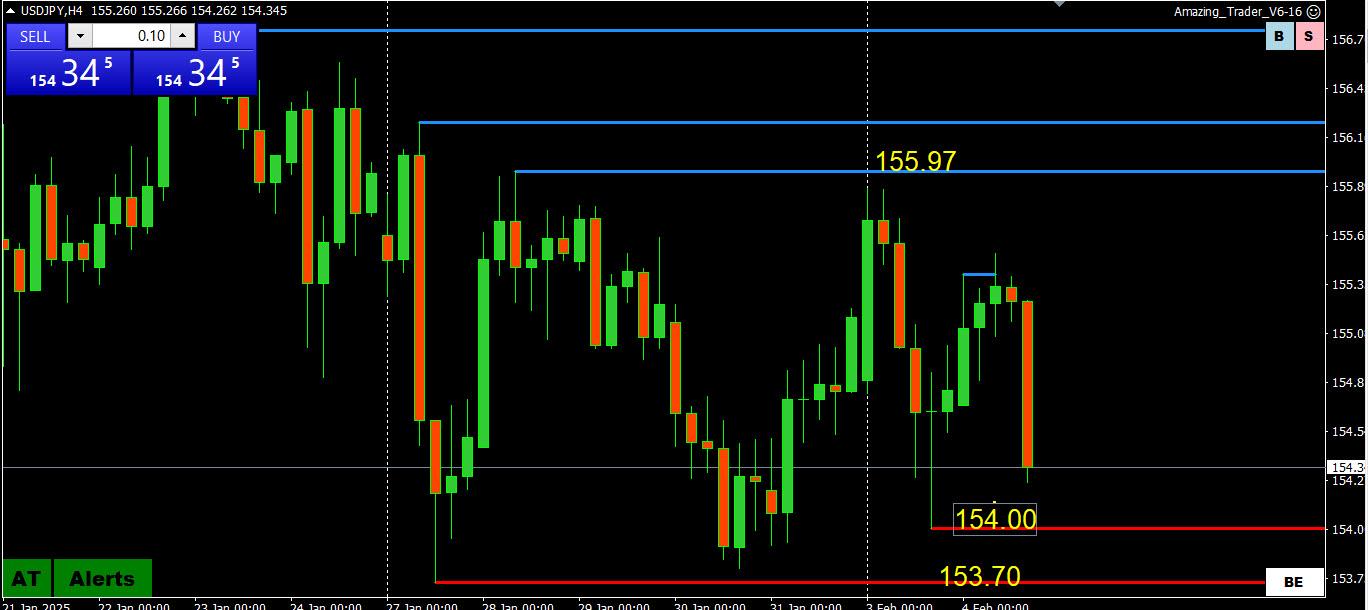
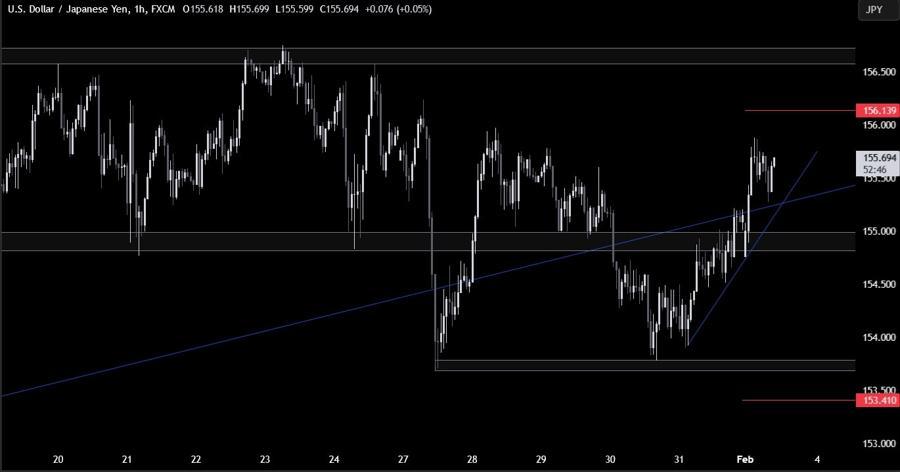
On the 1 hour chart, we can see that we have a minor downward trendline adding confluence to the resistance zone. This should technically strengthen the resistance and give the sellers more conviction to step in there targeting new lows.
The buyers, on the other hand, will look for a break above the resistance and the trendline to position for a pullback into the 155.00 handle. The red lines define the average daily range for today.
US equity futures modestly lower, Crude softer, Bonds and USD await tariff updates
Good morning USA traders, hope your day is off to a great start! Here are the top 5 things you need to know for today’s market.
5 Things You Need to Know
New 10% tariffs on China exports to the US have taken effect; China is to levy countermeasures on some US imported products with 15% tariffs on coal and LNG, as well as 10% tariff on oil, agricultural machines and some autos from the US.
European bourses trade tentatively, Tech buoyed by strength in Infineon; US futures are modestly lower.
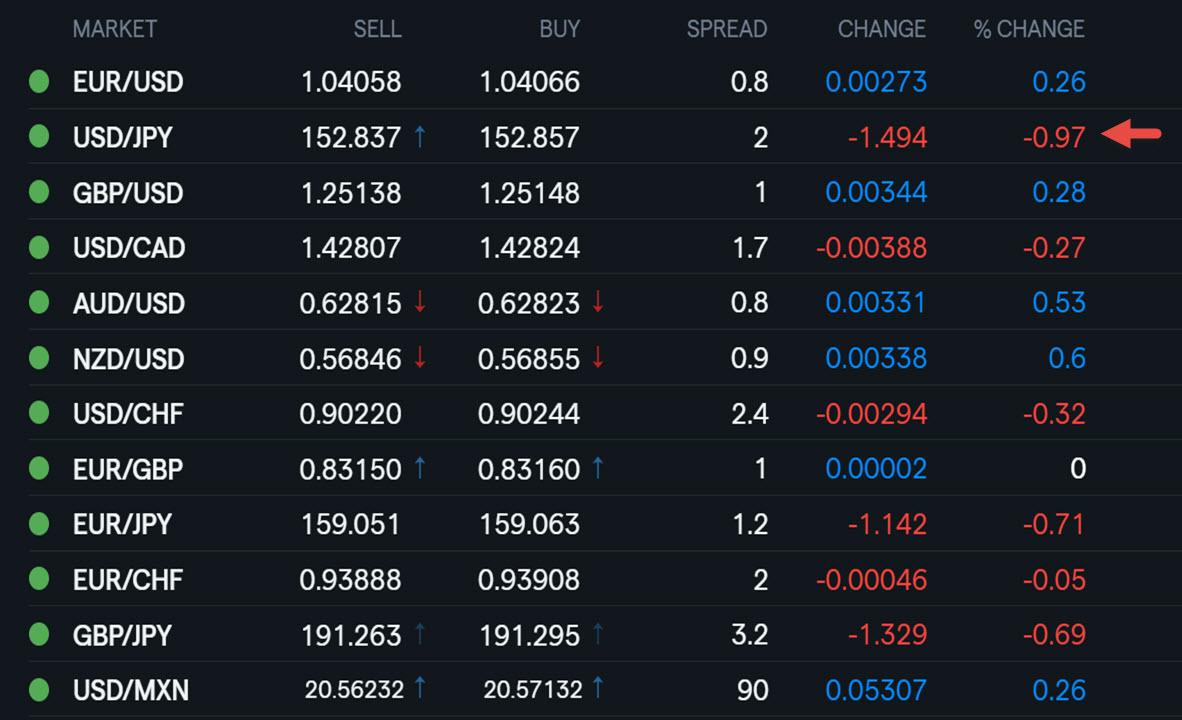
DXY is flat, JPY underperforms, unwinding the prior day’s strength, and Antipodeans lag.
Bonds pullback but remain above Monday’s lows as we await tariff updates from US/China.
Crude softer amid Canada/Mexico tariff delays and China tariff retaliation.
USD surges and stocks dip after post-Trump actions; RTY underperforms
Good morning USA traders, hope your day is off to a great start! Here are the top 5 things you need to know for today’s market.
5 Things You Need to Know
Trump signed a tariff order that confirms 25% tariffs on Mexico and Canada (with the exception of 10% on Canadian energy products) and 10% additional tariffs on top of existing levies for China.
Canada has announced retaliatory action, Mexico is expected to announce its measures later today, China is to challenge tariffs at the WTO.
European bourses sink as markets react to Trump tariffs and threatens the EU; RTY underperforms.
USD surges and Bonds gain post-Trump tariff actions, JPY bolstered by safe-haven appeal, EUR/USD sits on a 1.02 handle.
Crude firmer, precious metals subdued, but base metals slip on tariffs and Chinese PMI miss.
1 hour chart, we can see that we have a minor upward trendline defining the current bullish momentum. The buyers will likely continue to lean on the trendline to push into new highs, while the sellers will want to see the price breaking lower to start targeting new lows. The red lines define the average daily range for today.
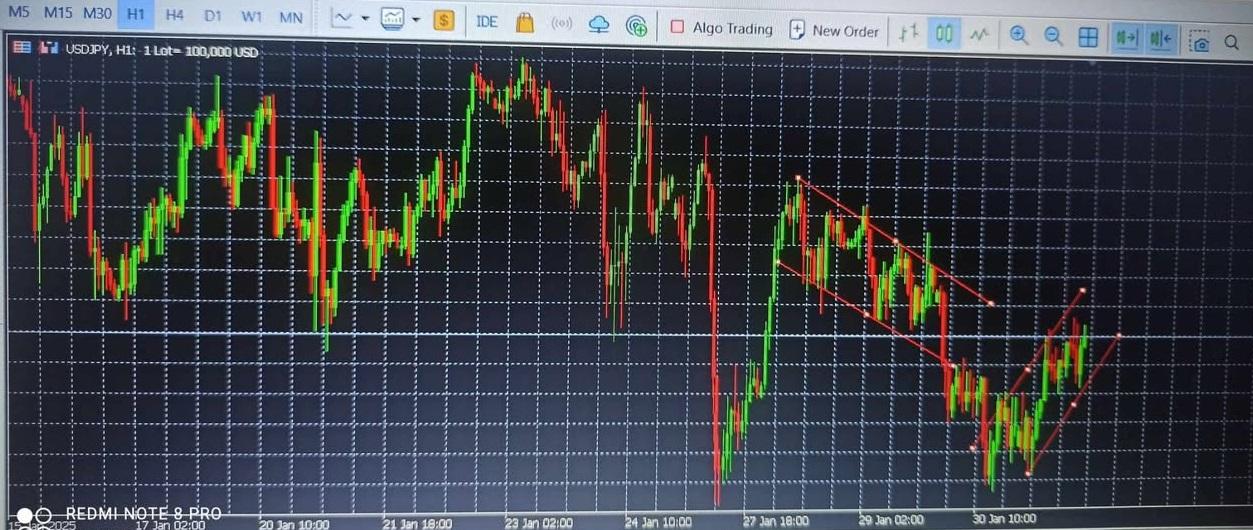
This is about 5pm Nigerian time and the USD/JPY is looking good for a buy. The market went to the lowest point at 154.504which is a support area as there was a previous low at that level a few hours ago. Market has risen ever since and is at 154.813 currently. Identical candles in opposite directions are seen forming at the hourly chart.
This fortells a continuation pattern of a buy. New candles usually follow the last candle and head in same direction.
This is what is currently occuring now and price is going towards 155.040 for a few pips before i relax and see if i will find another opportunity to re enter the market.
As i ussally say, don’t overtrade. Just go in for a 2:1 risk / reward ratio and dont trade more than 2-5% of your Account. Slow and steady wins the race, be careful.
Thanks,
TOPNINE.
Trading Tip 7: Why You Should Drill Down on Your Charts
As I have noted many times, identifying the side to trade is more than half the battle in putting on successful trades. In this regard, one way to do this is by drilling down on your charts as I will explain in the following:
The term “drilling down” means starting at longer time frame charts and then moving down to shorter time frames to find opportunities to trade on what I call the “strong side” of the market.
In this article I will show how I drill down using my Amazing Trader (AT) charting algo
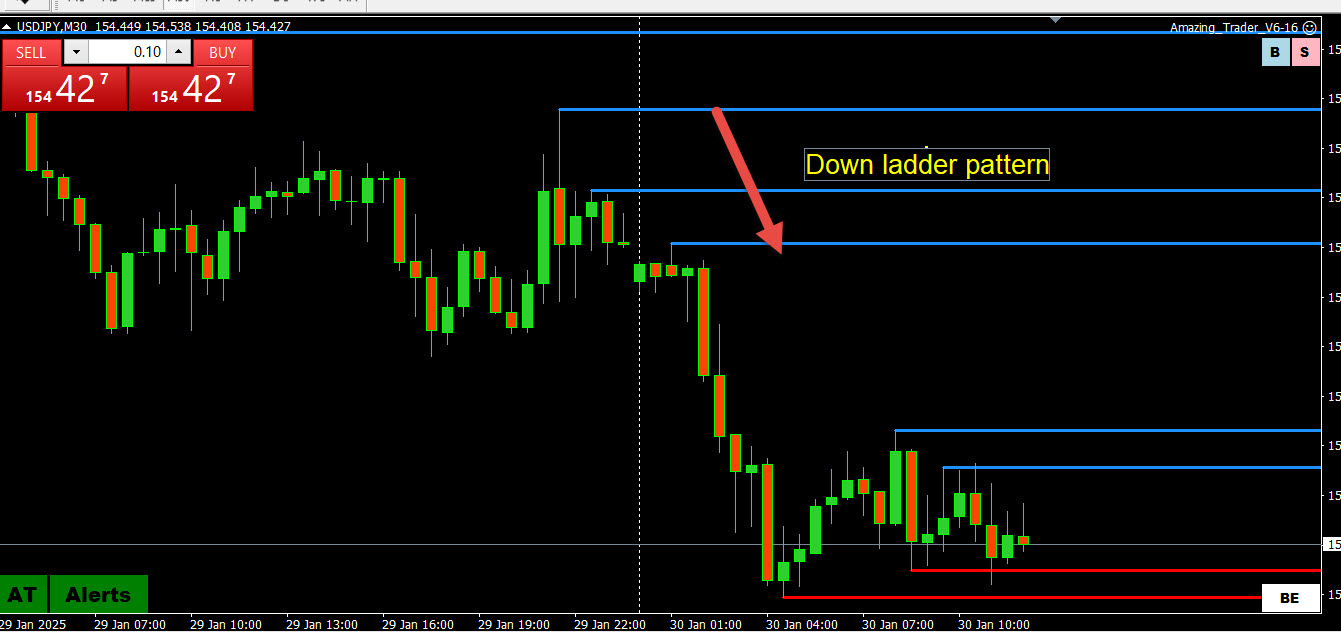
The process is designed to look for confirmation of a trend or episode on multiple time frames, and then find an AT ladder pattern to trade. Note, an AT ladder pattern is characterized by rising red lines (uptrend) or falling blue lines (downtrend)
Down AT Ladder Pattern: USDJPY 30 minite chart
Drilling down time frames:
Daily => 4 hour => 1 hour => 30 minute > 15 minute => 5 minute depending on what time frame you prefer to trade.
If you see AT ladders building in the same direction on say daily, 4 hour and 1 hour charts, you can assume there is an imbalance tilted in that direction
What the means for trading is that the institutional type traders who trade larger size and use longer term time frames will be looking to buy dips (ladder up) or sell blips (ladder down).
What this means for you is when multiple longer-term time frames confirm each other (I.e. AT ladders pointed in the same direction), you can identify the side to trade from, which is where big money traders are looking to do the same.
You then drill down time frames until you see an AT ladder pattern on the time frame you prefer to trade (e.g. 30, 15, 5 minute) and employ the ladder strategy to trade (explained in detail when you subscribe).
Here is an illustration from a video I created awhile ago with insights that have stood the test of time.
NOTE, you don’t trade blindly as you need to be aware of any levels, especially on longer term time frame charts, that would dampen or reverse the current episode.
Get more tips like this when you Join GTA – for FREE – CLICK HERE
Author
Search Results
Viewing 20 results - 201 through 220 (of 1,461 total)