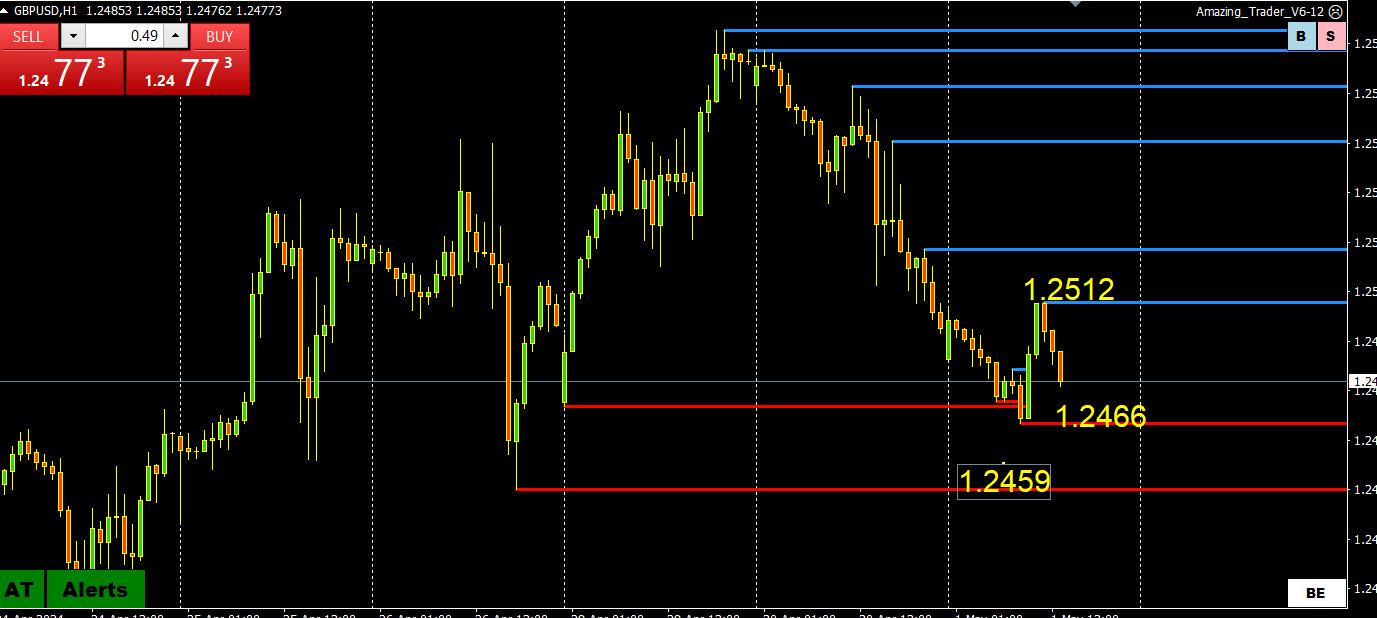
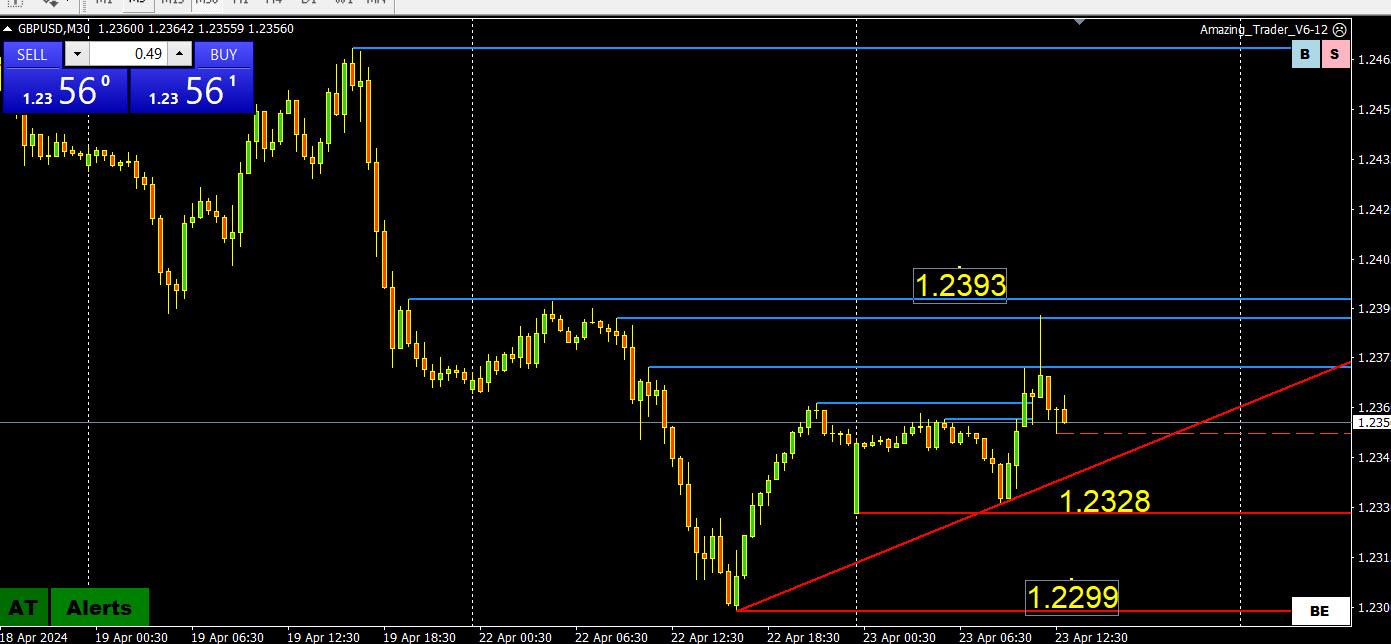
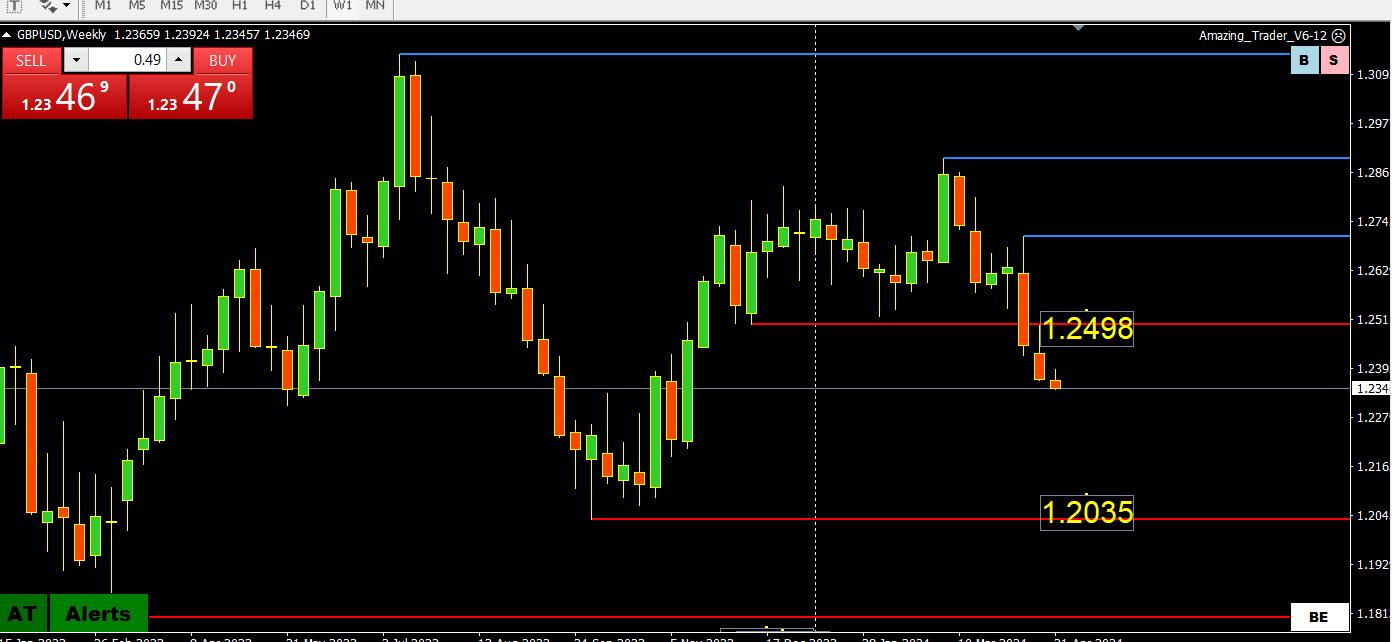
Blue Amazing Trader lines dominating but would need to get through 1.2450 (Power of 50 level) to accelerate the downside and shift the focus from 1.25 but….
only back above 1.25 would slow the risk..
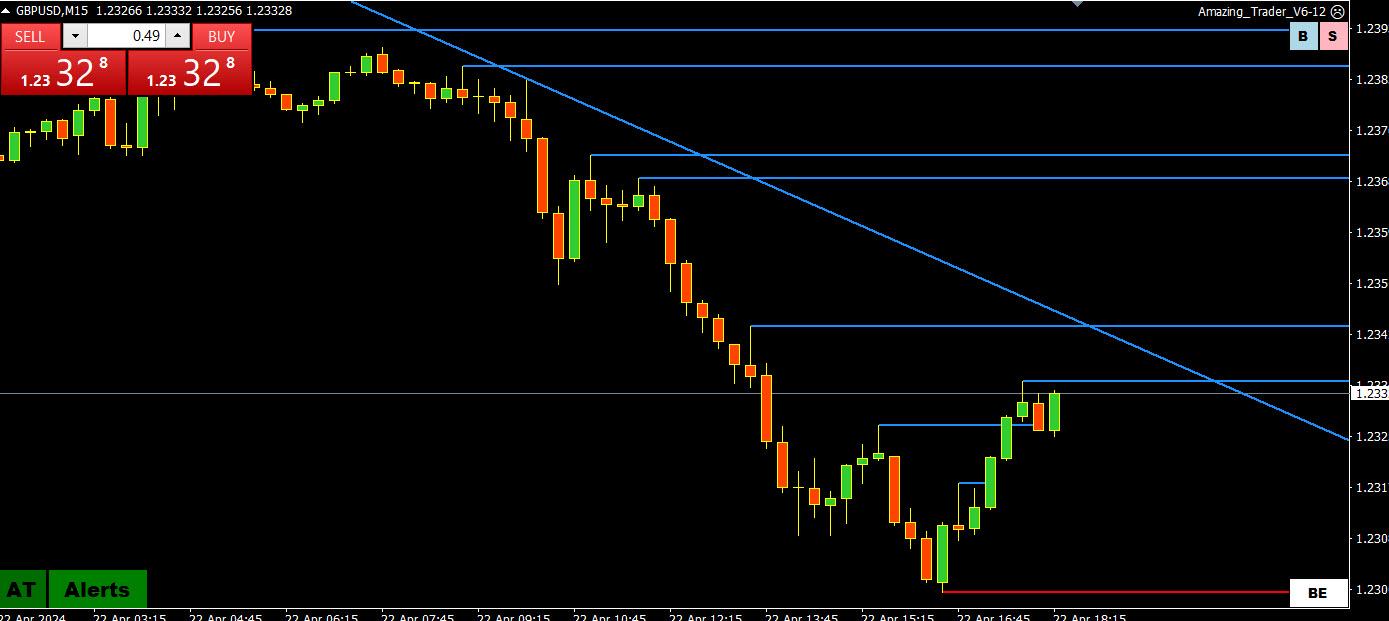
GBPUSD has been an underperformer with some pressure coming from a bounce in EURGBP,which in turn is giving EURUSD some support).
GbpUsd should see the 2420 area again in coming days after oscillating around the mid to high 2550s. Side note that was a really big miss on consumer confidence. Consumer not happy. Wages still rising. Fed must be exasperated.
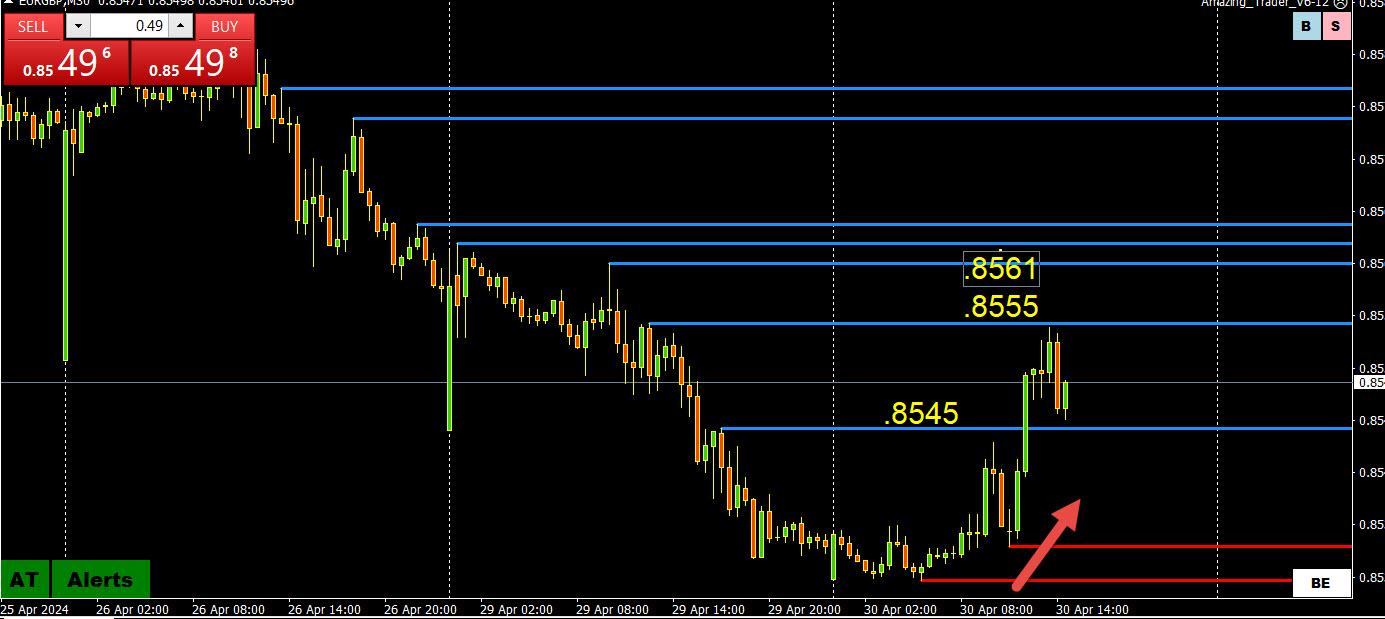
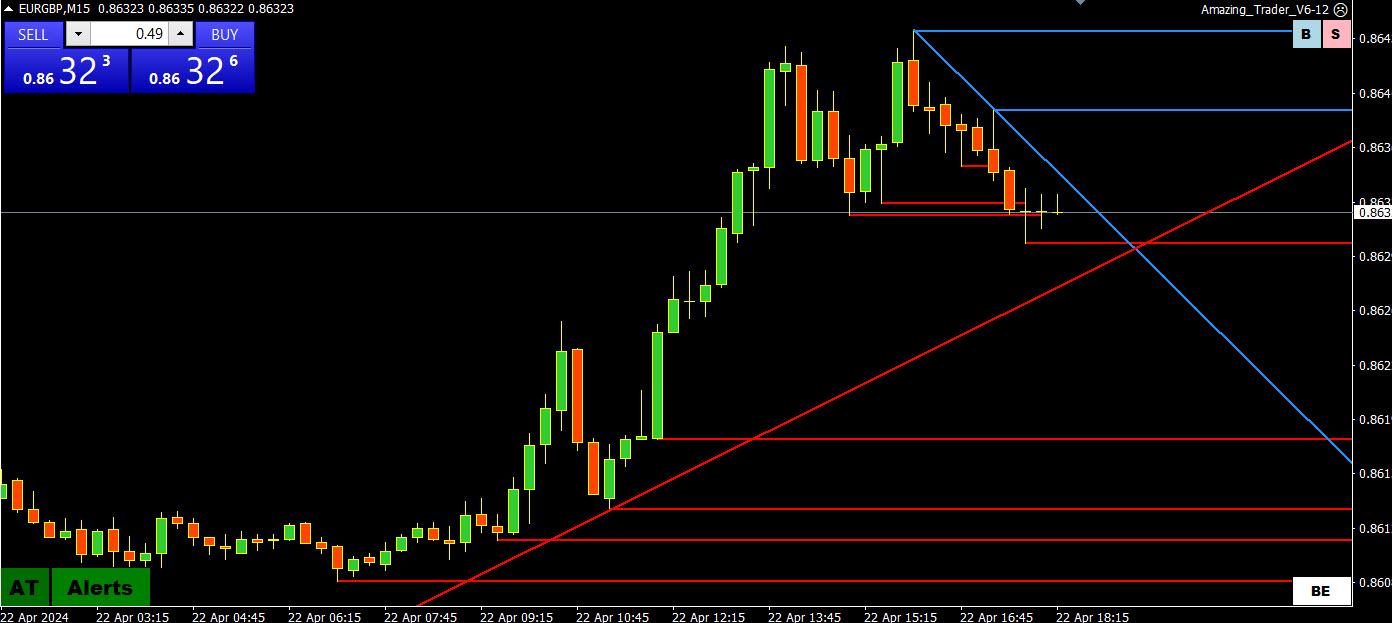
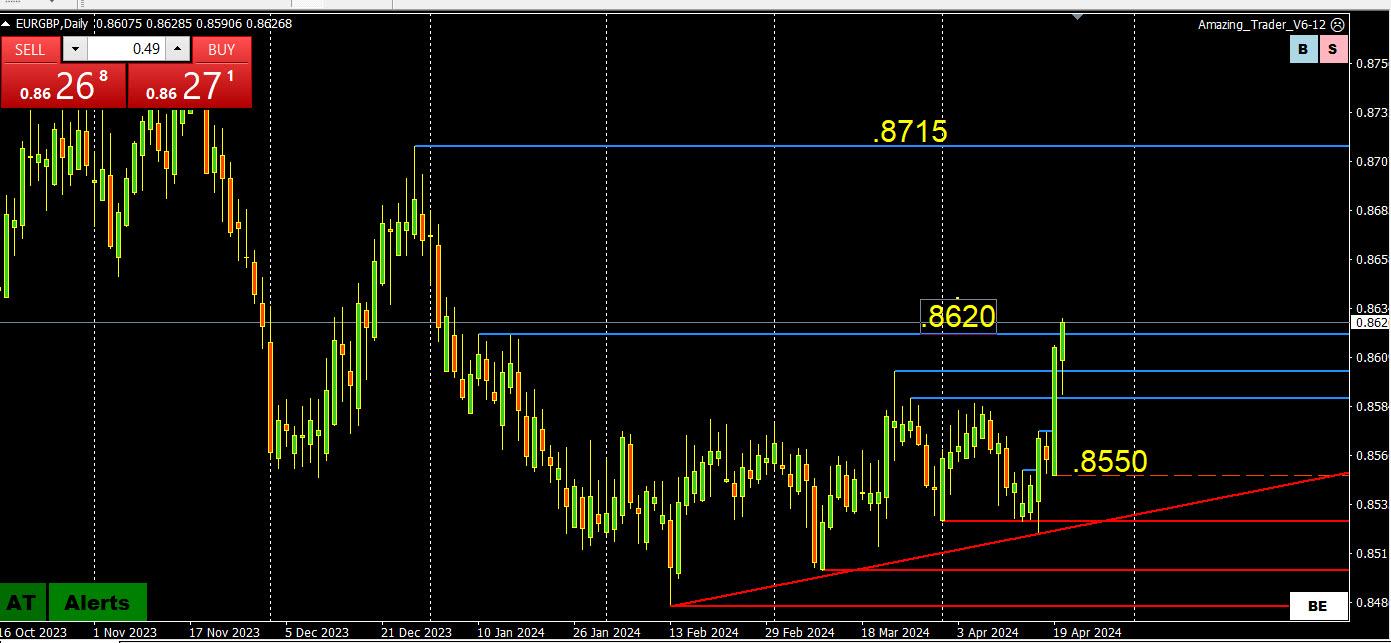
Went long yesterday EurGbp around 8530 but it is having issues around 8550 so cashed in and now flat and looking to be long again and hold on any attempt to go find lower value.
Following up on my earlier post where looming support proved too tough and now EURGBP is facing resistance at the .8561 level cited in that post. So far .8555 resistance is holding, needing to stay above .8545 to keep its bid.
Take note of the two red Amazing Trader (AT) lines highlighted, otherwise known as an AT Directional Indicator, signaling a potential shift in directional risk that played out.
As I noted, there are often some erratic month-end flows in EURGBP, especially around the 4 PM London fixing.
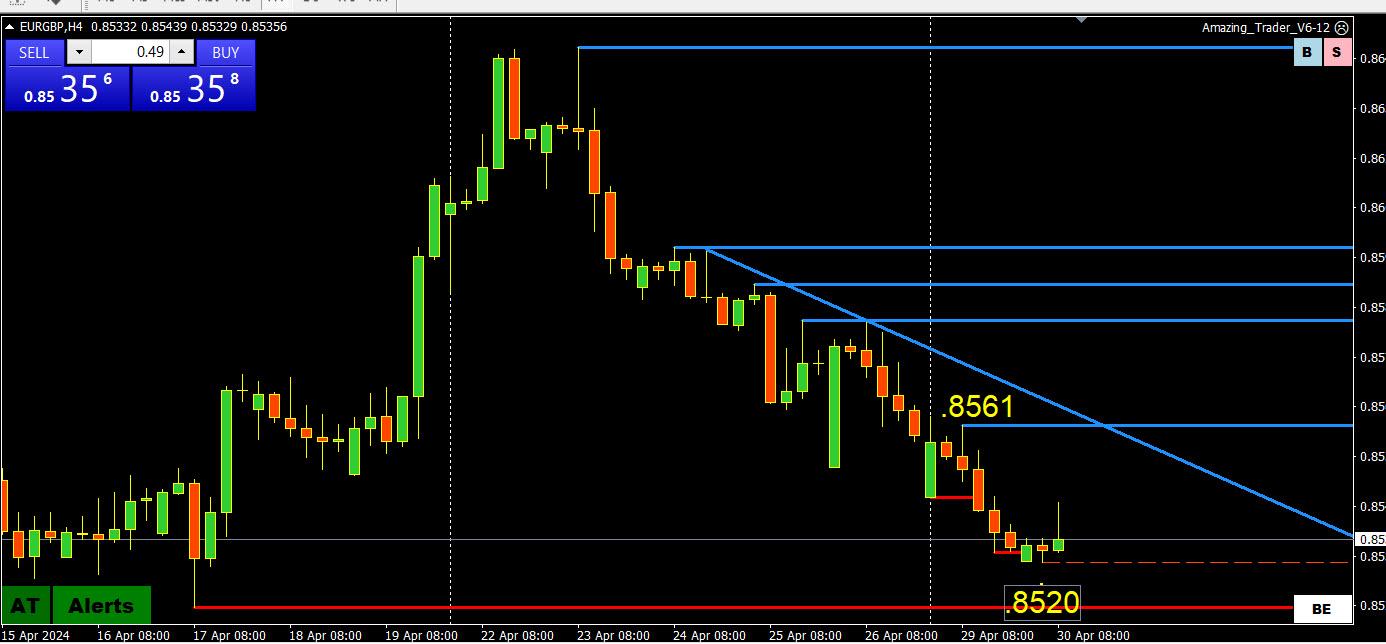
EURGBP has been under downward pressure (note blue AT lines) to start the week with key supports looming below at .8520 and the key .8484-.8502 lows (not shown on this chart).
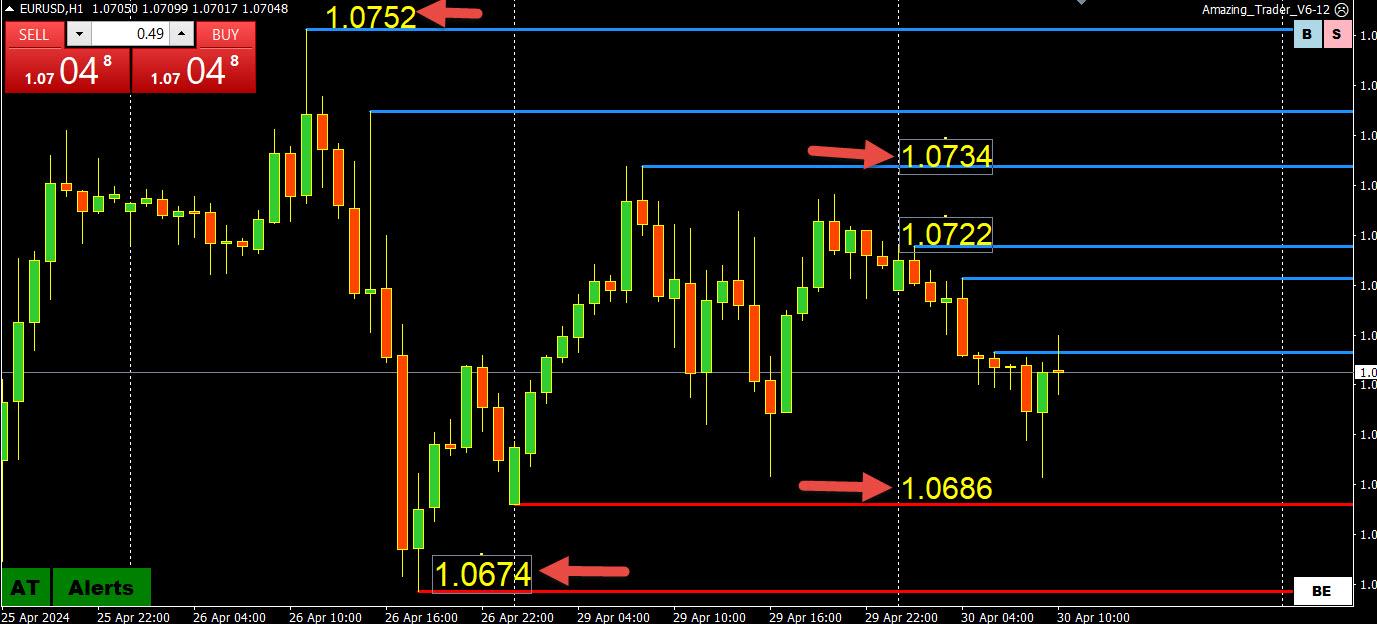
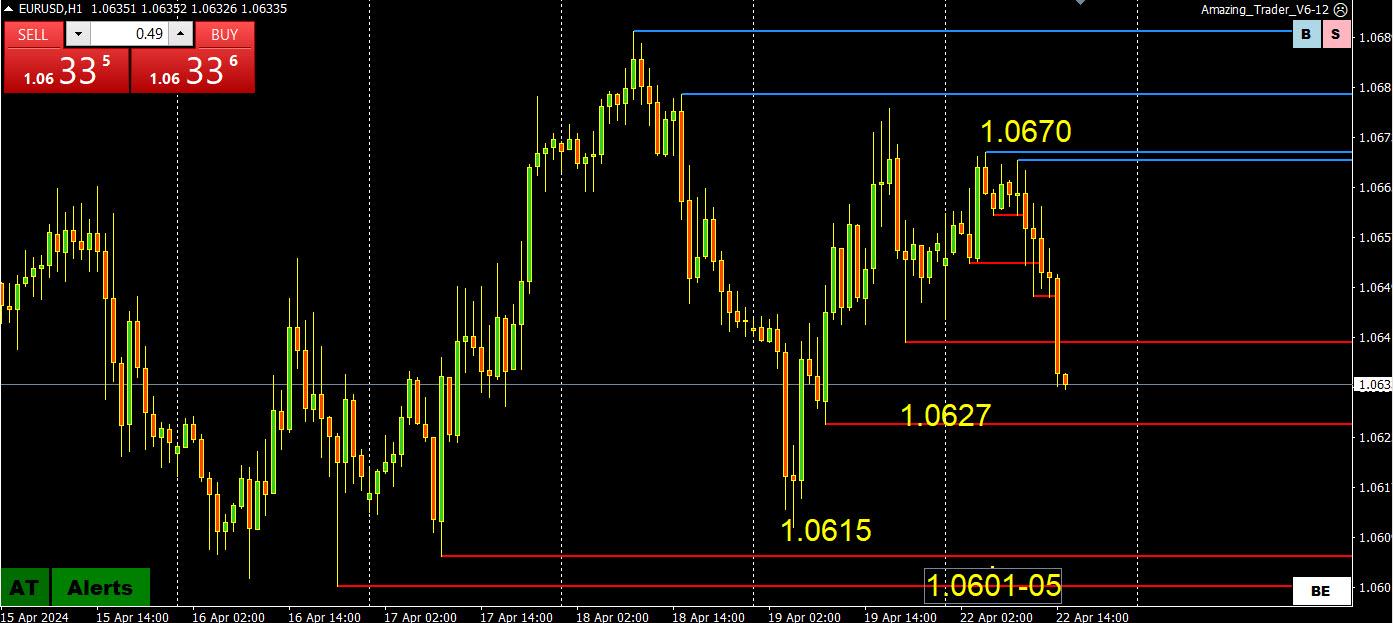
EURUSD has been stuck so far for a second day within a 1.0674-1.0753 range set last Friday with attention mainly on the JPY after BoJ interventions and verbal threats overnight.
Range so far this week 1.0686-1.0734
As I noted yesterday, it is month end, and while not an exact science the theory says if US stocks are lower on the month there is USD buying to adjust forex hedges. As I said this is not an exact science so just something to keep an eye on.
Also, month end often sees EURGBP erratic swings so watch into the 4 PM London fixing as it can impact EURUSD and GBPUSD.
Otherwise, markets seem to be on hold ahead of the FOMC decision tomorrow.
Covered calls are bid for stocks as well as some other facets, but some internals are not solid so it appears to me that the bid in stocks in moderately on the apprehensive side but bid so far. Dxy withstood the overnight selling but has to clear 106.05 and hold to accelerate in my view, otherwise the 105 area might be seen. I’m looking to sell GbpUsd around 2600 but am biased long overall until the tune changes. Staying on the bid in AudUsd and crosses on pullbacks and believe it might temporarily stall around 6600 in both spot and futures.
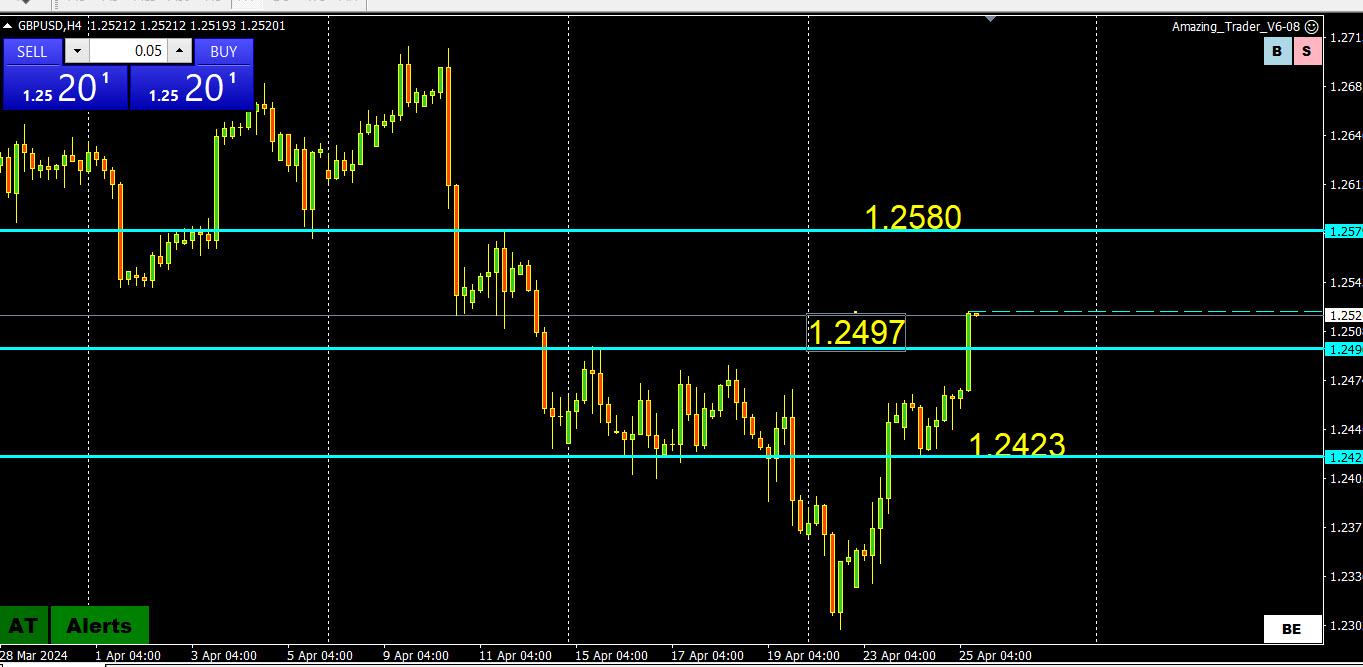
GBPUSD, which fell sharply to end last week on shifting interest rate cut expectations has reversed course as the market reassesses that outlook.’
This saw UK 10-year bond yield rise 9BPS to close yesterday at the highest level for the year.
Combine that with JPY weakness and a sharp GBPJPY rise, you can see why there has been a GBPUSD reversal.
GBP is also firmer on other crosses (e.g. EURGBP is lower as well).
Looking at this chart, it needs to hold 1.2497 *=(suggests 1.25 as well) to maintain a strong bid although support is seen as long as it stays above 1.2423.