This is one of our most popular articles and on a day like this it is worth showing again, for those who have not read it and as a reminder for those who have read it as well.
Here is a test: Check your emotions and see how a currency feels like it is trdoing when it is above/below the “50” level
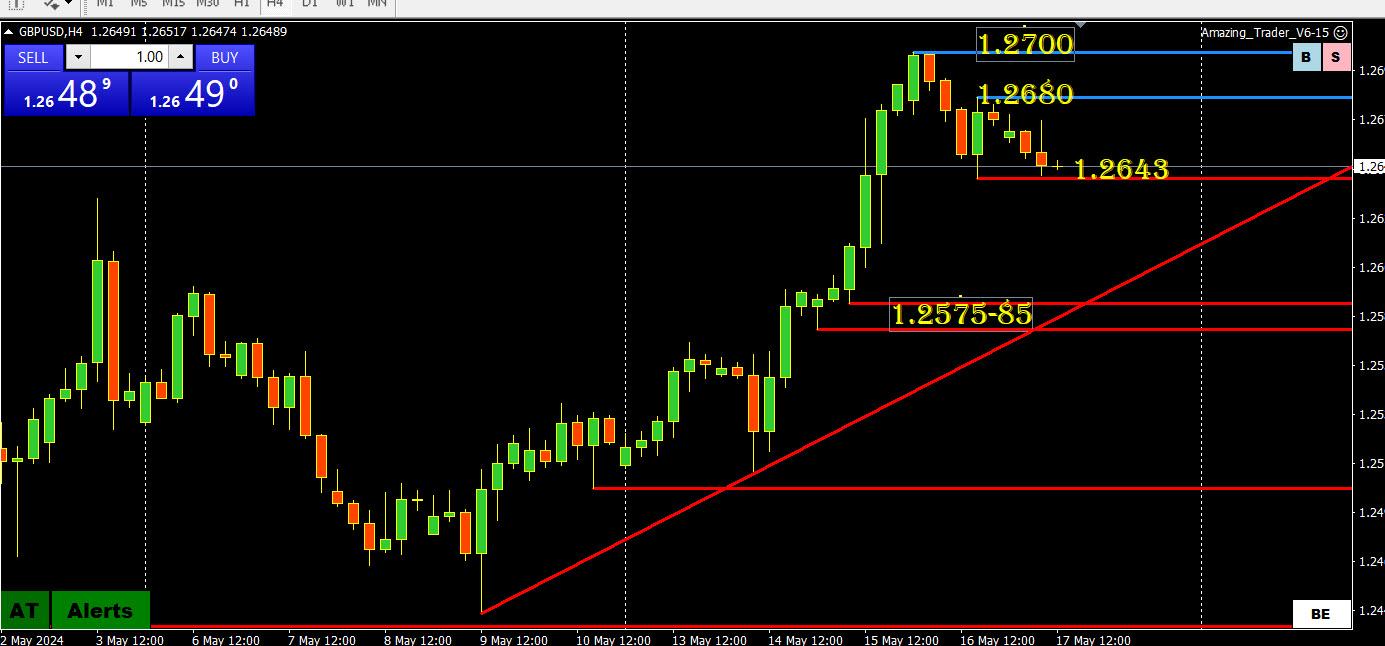
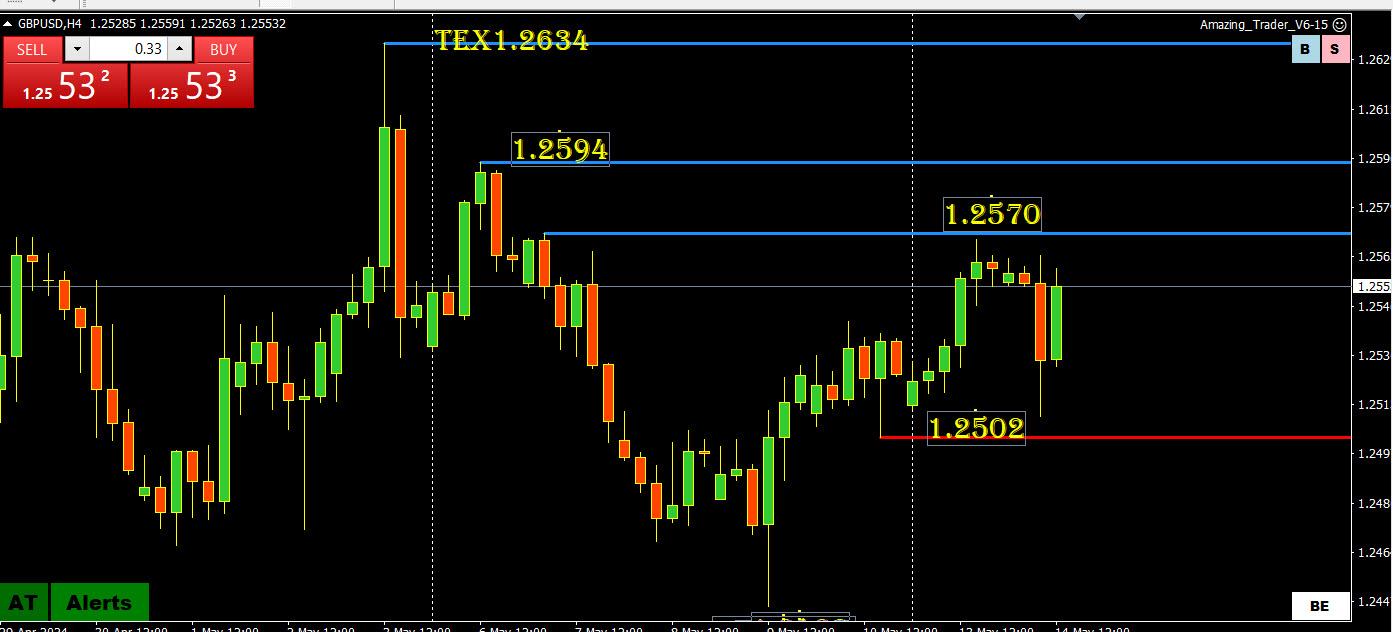
GBPUSD is lower but lagging EURUSD as EURGBP slips.
You can see the importance of 1.2643 as there is a void of supports until 1.2575-85 on this chart. This also means there are no obvious stops to go after until that level.
This suggests using shorter time frame charts to trade this currency.
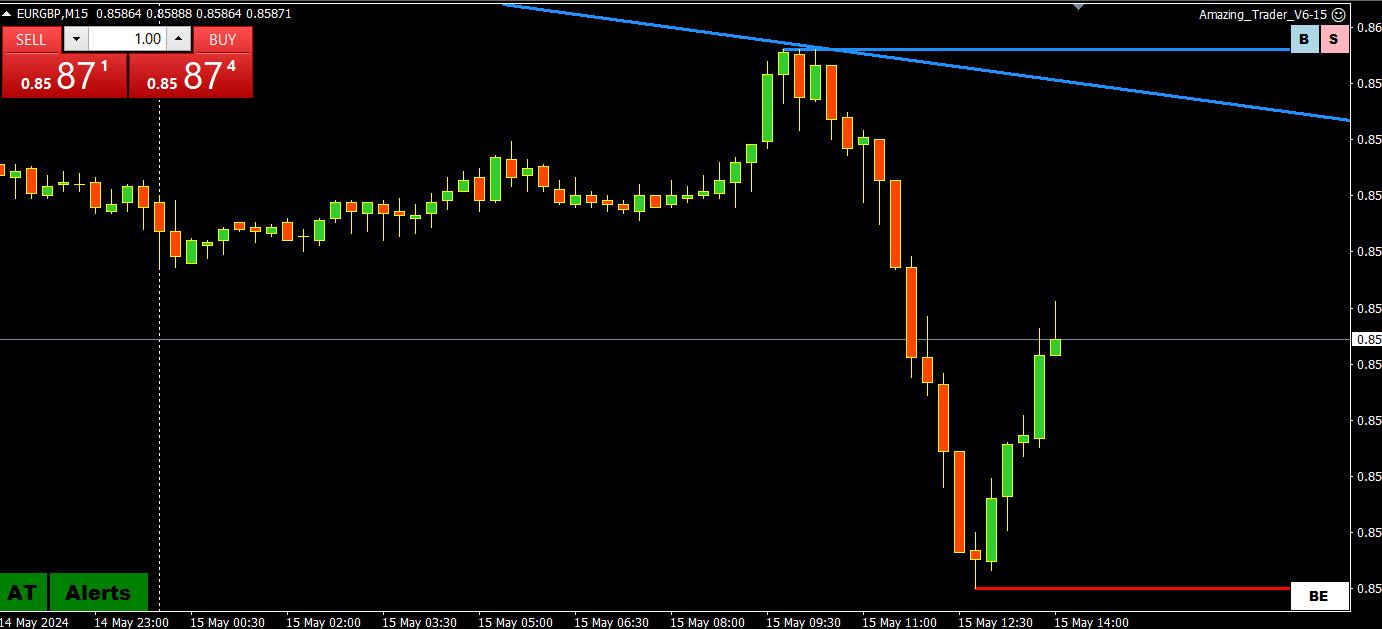
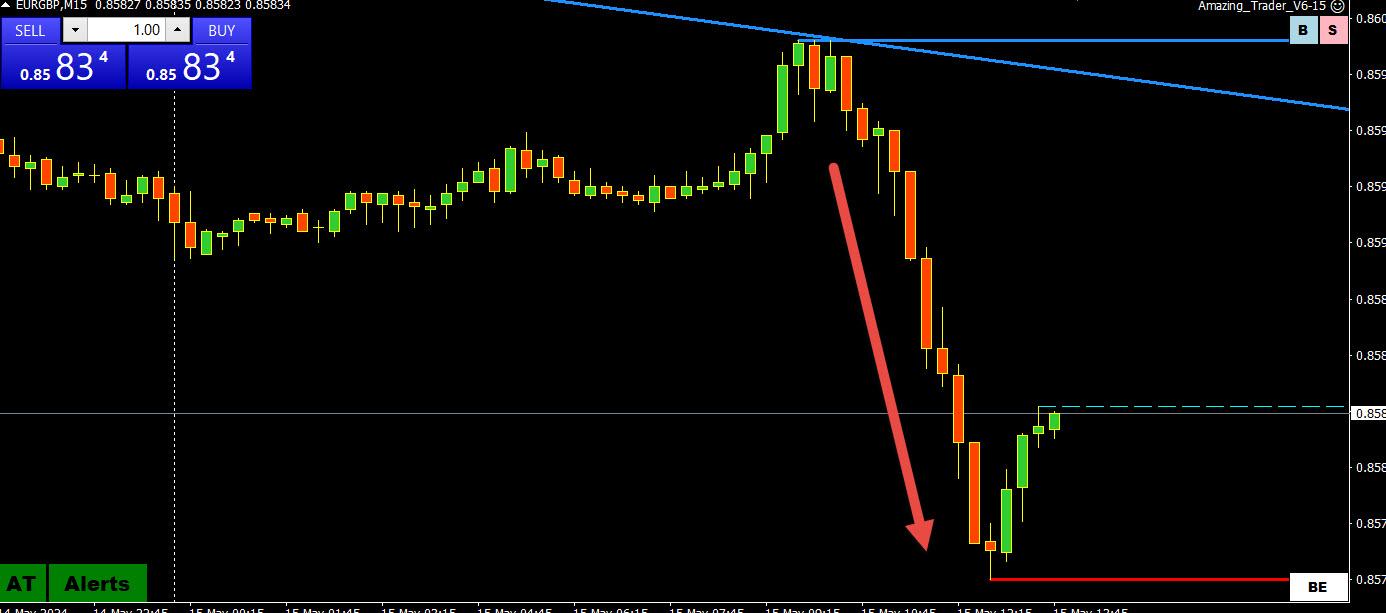
You have seen me talk about the influence of cross on spot trading and this is how I look at it using EURGBP to illustrate:.
– When you see a straight line move down as in this chart (I look at the 15 min chart), it suggests there is a real money flow (order) driving, in this case, EURGBP lower.
– So you know GBPUSD is being bought and EURUSD is being sold.
= During this straight-line move, given the current trend, GBPUSD will be supported.
– Once EURGBP finds support, either GBPUSD will lose its strong bid or EURUSD will play catch-up.
– In this case, GBPUSD has lost its bid and slipped once the EURGBP bounced off its low.
If you ever played the game “Hot Potato” you can go with the flow until the music stops (i.e. order is filled)
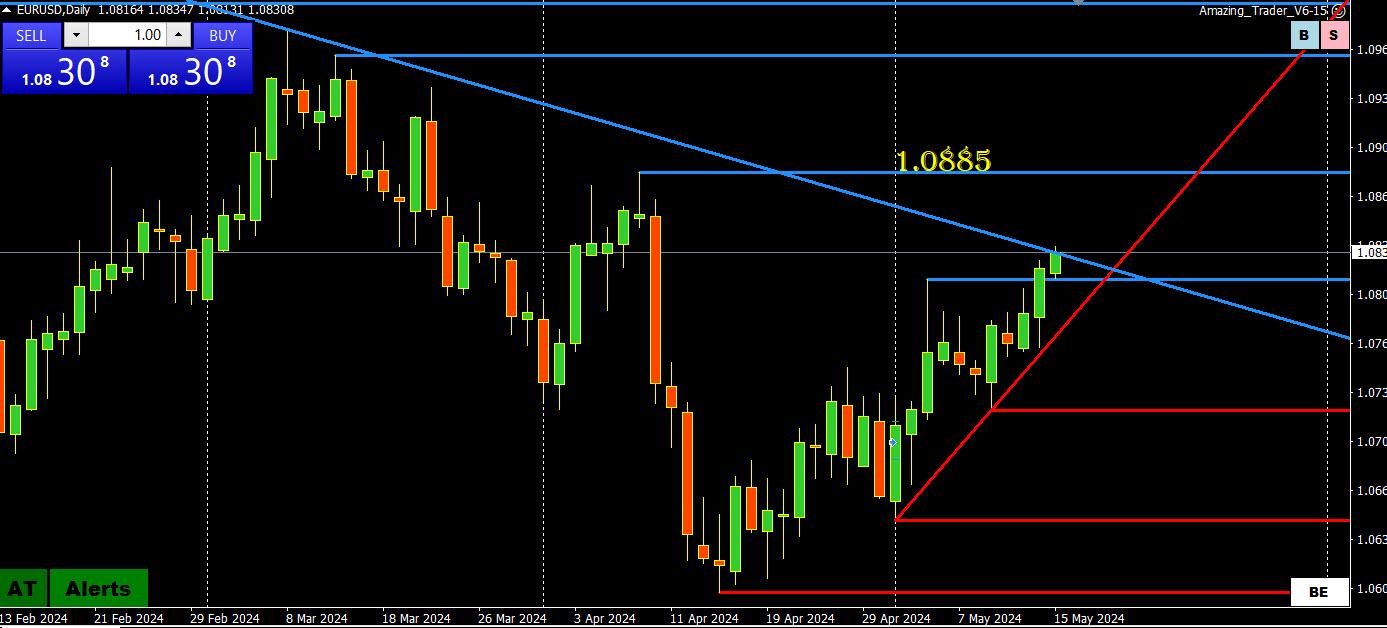
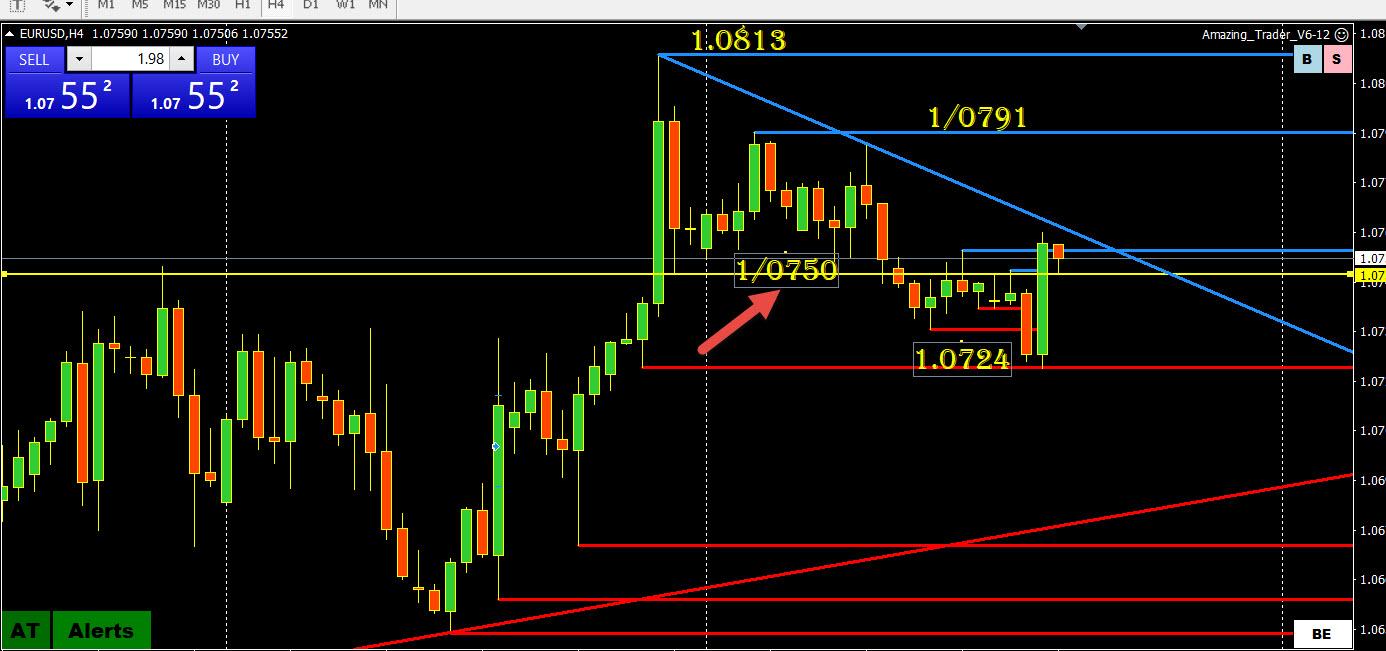
EURUSD: technicals pointing up but so far just nicking its key daily trendline at 1.0831 without a clean break as it lags as it trades softer on various crosses (e.g. EURJPY, EURGBP). A firm break would expose 1.0884 as the next target.
Time now to roll the dice as US data is the next key focus.
The only news I saw other than the UK jobs report, which was not the catalyst for the GBPUSD nosedive, was this that came out within the past hour:
BOE Chief Economic Pill says there is still some work to do on the persistence of inflation; not unreasonable;e to believe that over the summer the BOE will see enough confidence to consider rate cuts….Source; Newsquawk.com
If this was the catalyst for the (over?) reaction down in GBPUSD, it is yet another indication of how hyper-sensitive markets are to any news that might impact interest rate cut expectations.
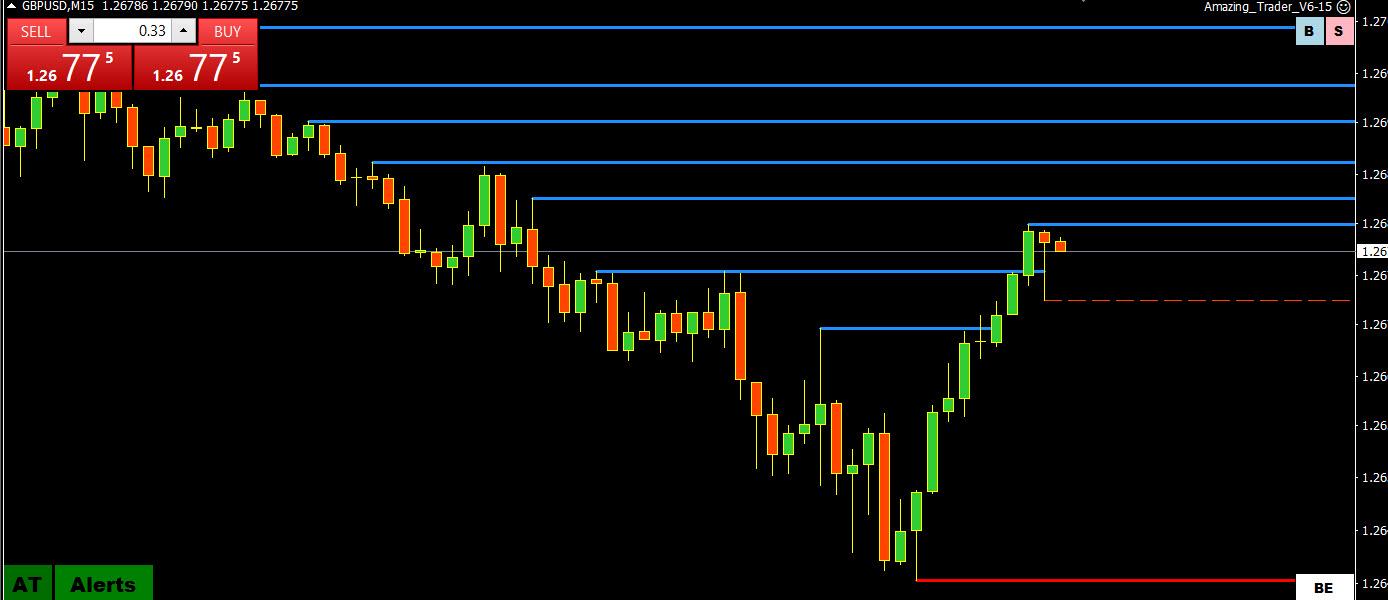
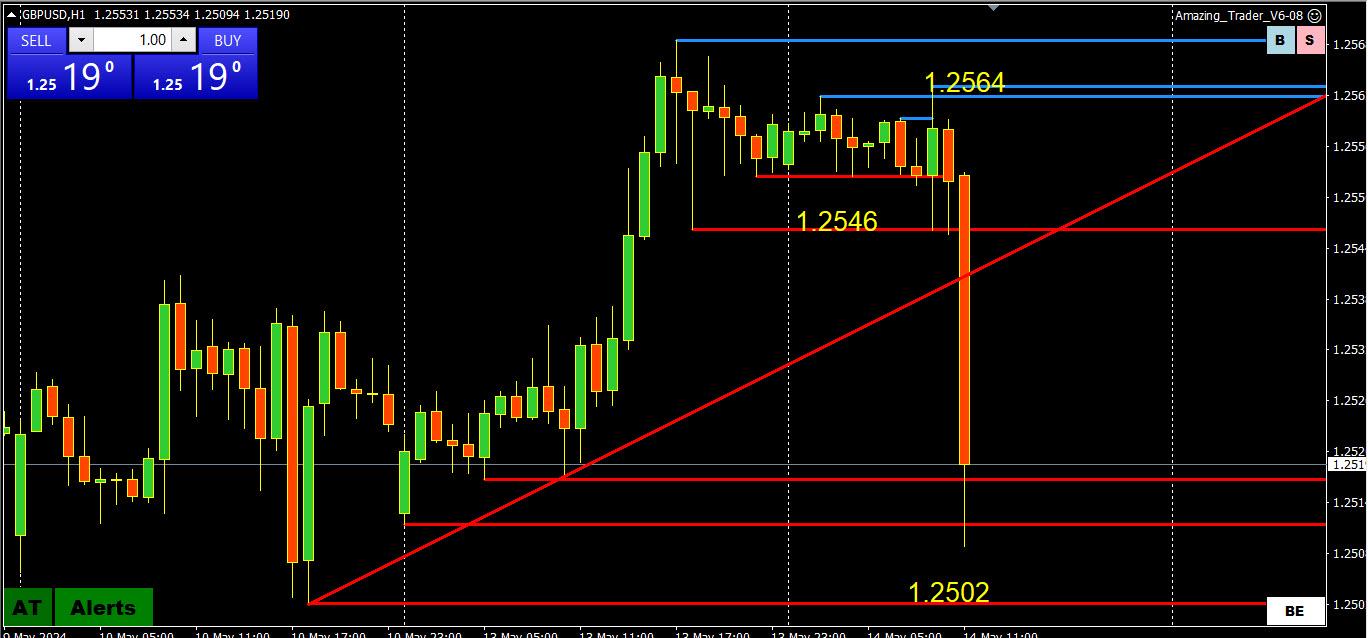
GBPUSD 1-HOUR CHART – LOOKS LIKE IY FELL OFF A CLIFF?
I am using this chart as it looks like GBPUSD fell off a cliff. This may reflect a thin market that has been buying GBPUSD this week.
Whatever the case, the key level on the downside, as pointed out yesterday, is 1.2502 as there is a void of key levels below it. So far, GBPUSD has paused above it.
On the upside, back above 1.2546, at a minimum, would be needed to ease the risk on the downside.
All Treasuries have flatlined in the sell cycle. 20yr has to eclipse and hold 91.70 to support Eur appreciation. Eur-Aud-Gbp all bid overall albeit lacking drive at the moment.
EURUSD minor 4-hour down trendline at 1.0764 has been broken. One look at EURGBP will tell you where some of the demand is coming from. although the USD is softer in general despite a bounce back in bond yields. (4.502%)
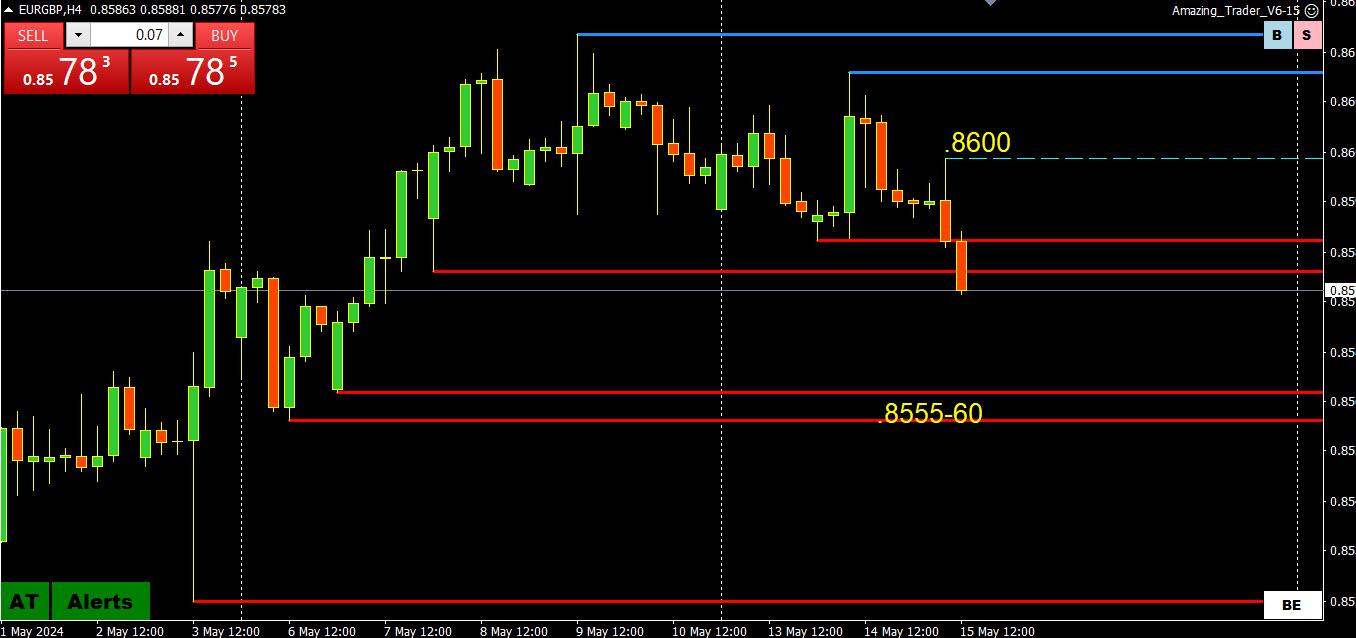
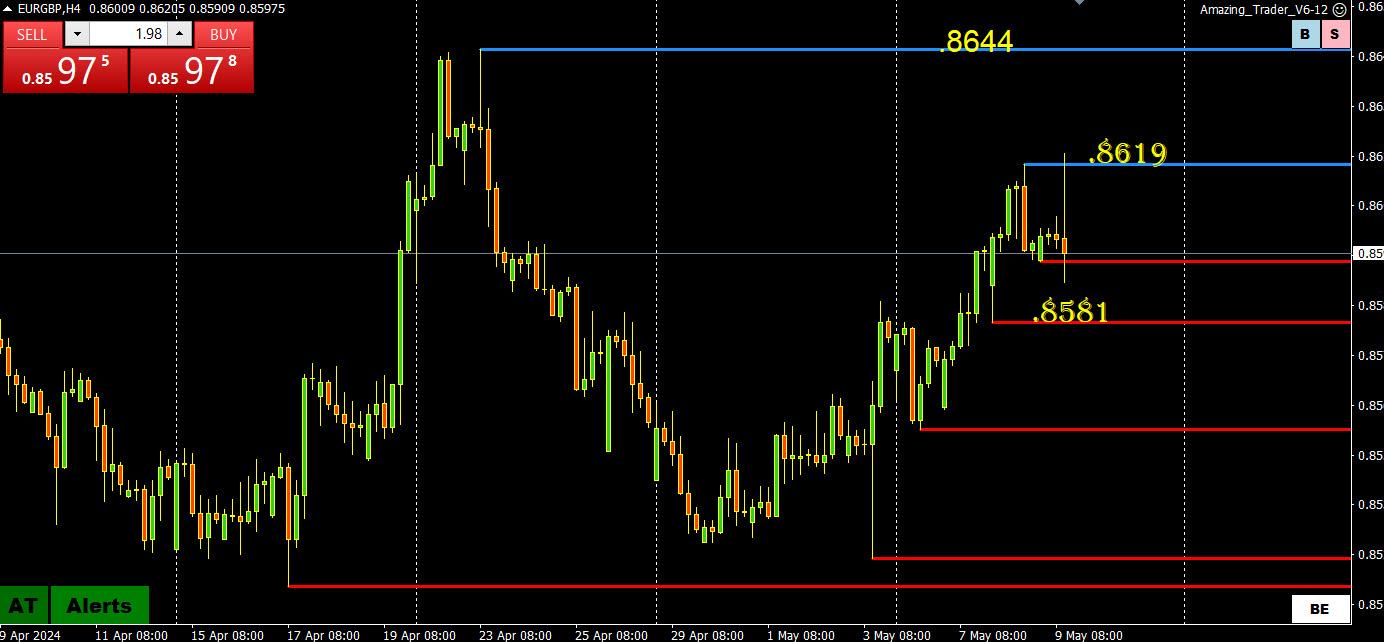
Looking at this chart, technicals are still pointed up but the range is .8581-.8619, with .8600 as the midpoint.
For me this suggests using .8600 as a barometer of GBP strength (relative term) or weakness.
On the upside, a firm break above .8620 would put the major,8744 level in play.
On the downside, a firm break of .8580 would suggest the high is in for now and cooling pressure on GBPUSD.
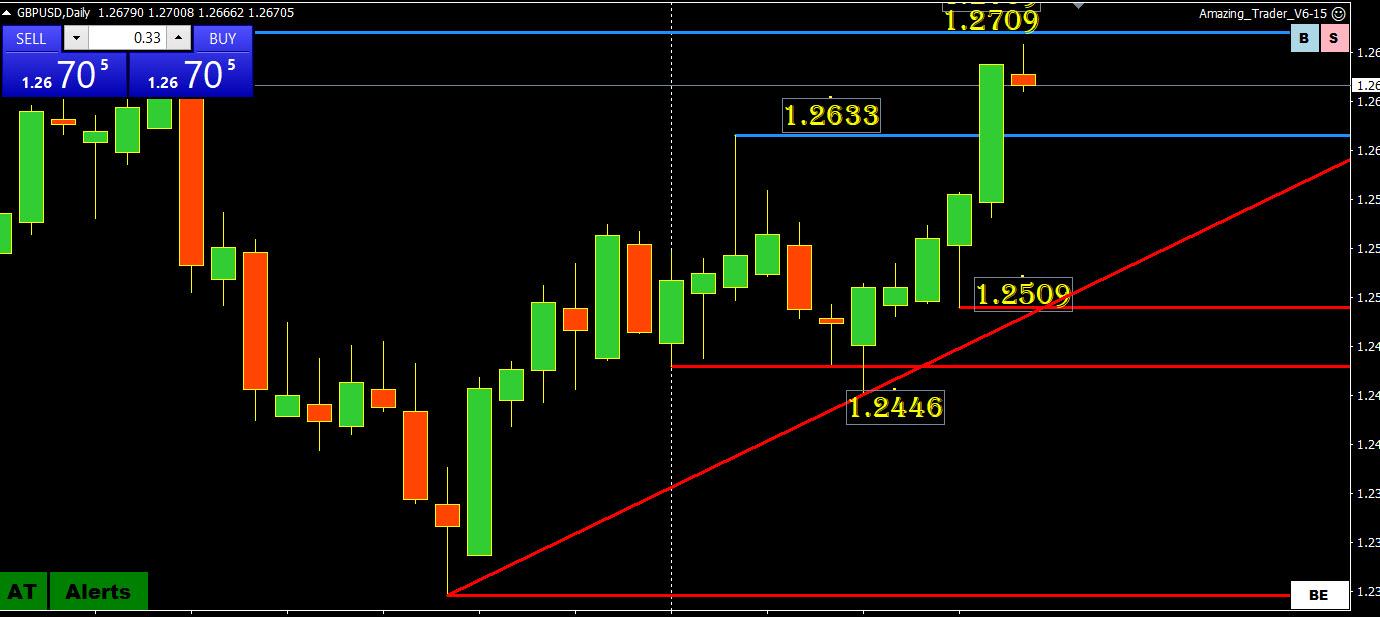
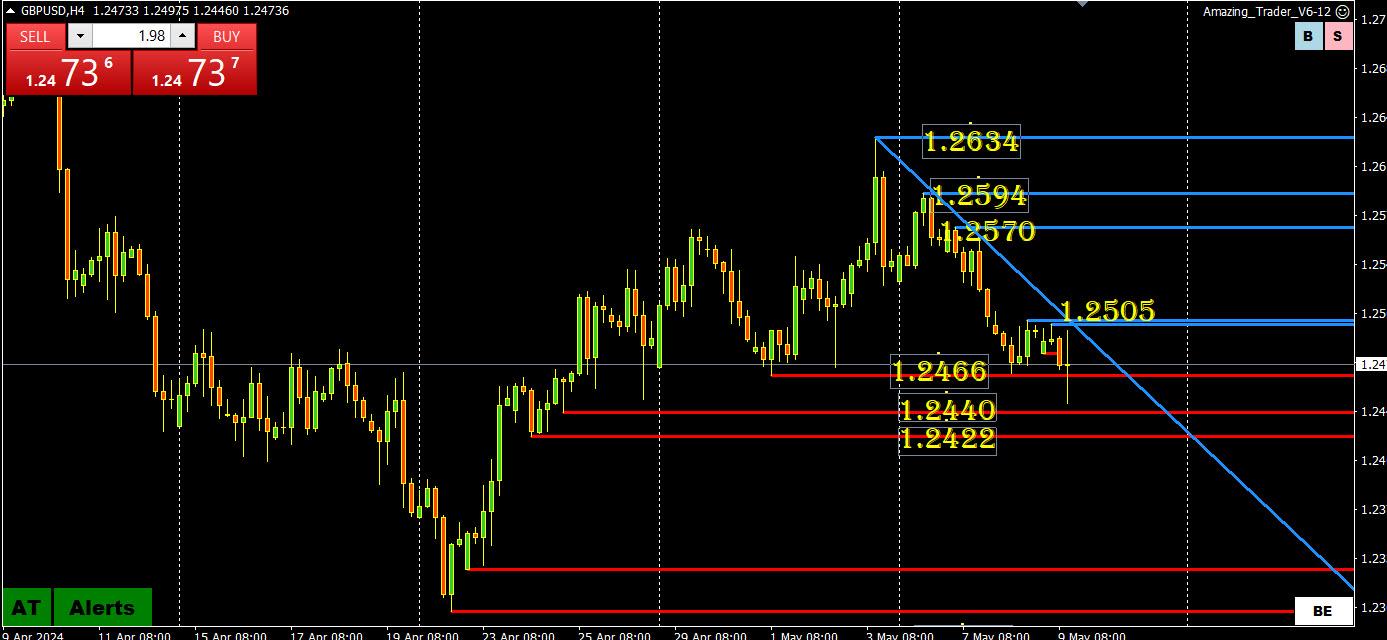
Break off 1.2466 has so far been unable to reach 1.2422-40. The significance of these levels is below it would open the floodgates on the downside (major support is at 1.2298).
Otherwise, there are two pivotal levels
1.2500-05 on top
and
1.2450 (Power of 50 level) for intra-day trading bias (currently back above it)
As I noted, also loom at EURGBP as an indicator of GBP weakness or noit.
Author
Search Results
Viewing 20 results - 681 through 700 (of 851 total)