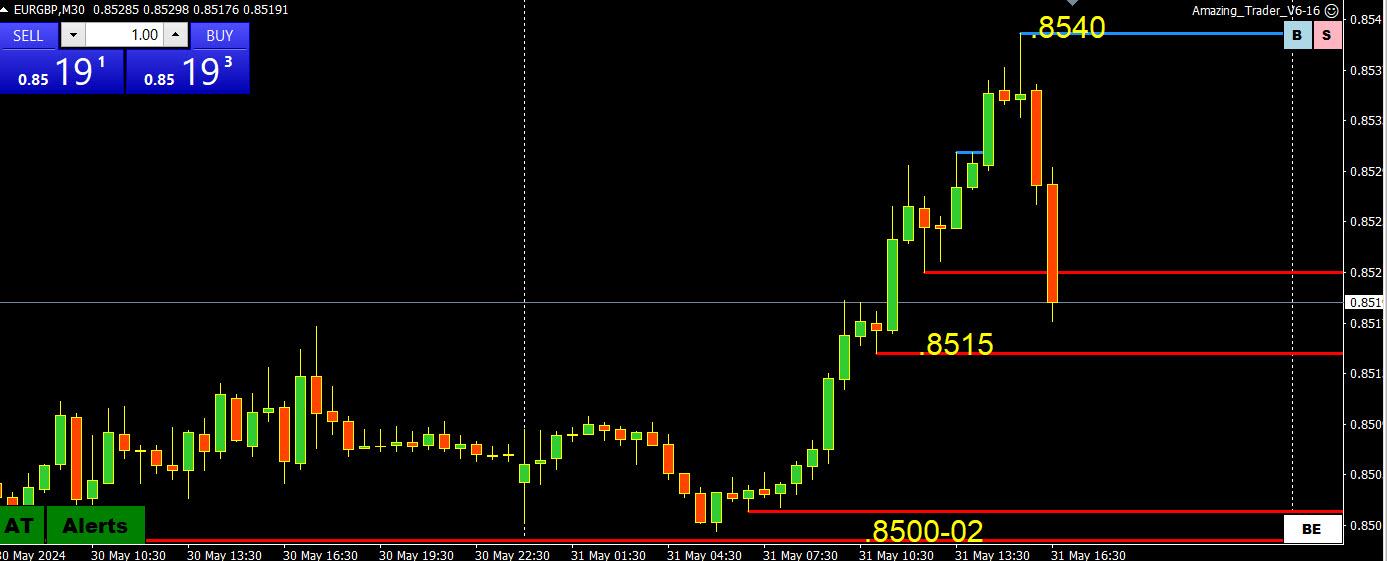
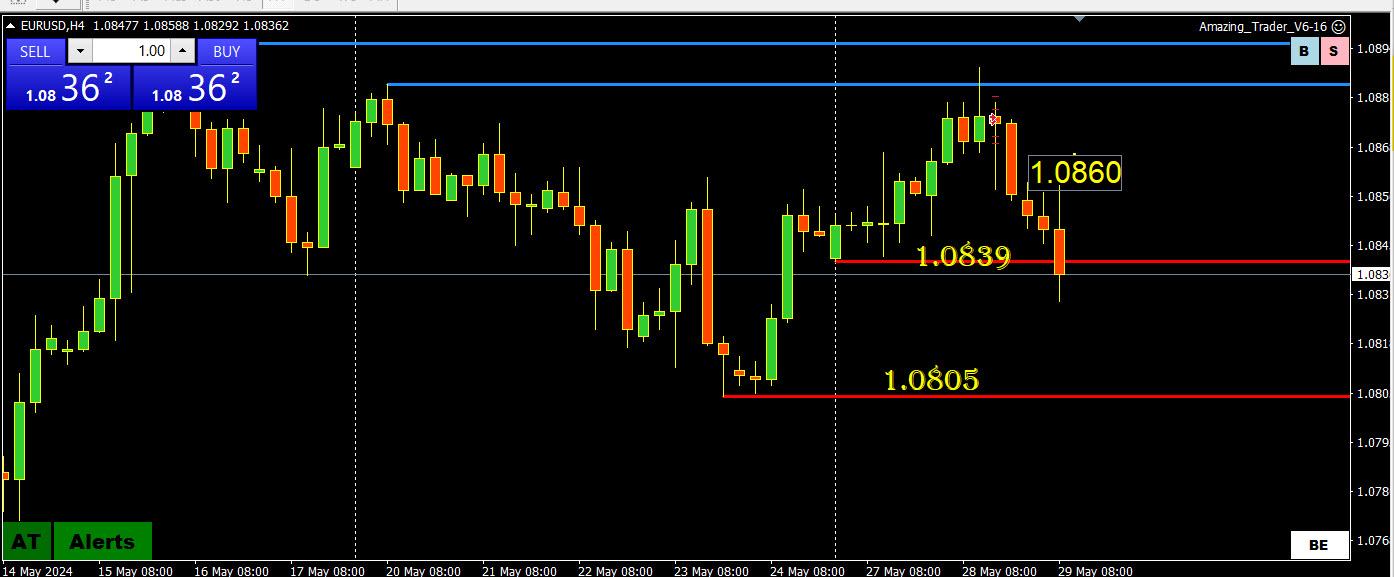
EURGBP 30 MINUTE CHART – MONTH END?
As I posted earlier,
As I noted, month-end flows can be a factor, especially in EURGBP, which is firmer.
Note, I have seen month-end flows reverse during the day so keep an eye on your charts
To suggest an order the other way, .8515 would need to be broken.
In any case, keep an eye on this cross as the 4 PM London fix approaches.
GBPUSD, meanwhile, has regained a bid after EURGBP came oiff its high.
EURUSD 4 HOUR CHART – MONTH END OR MORE?
EURUSD getting a boost out of its crosses (EURGBP, EURJPY) after holding above 1.08 earlier today.
On the upside, 1.0851 = 61.8% FIBO and 1.0859 is the key level as only above it would confirm the low is in.
As I noted, month-end flows can be a factor, especially in EURGBP, which is firmer.
How do we know there is a cross-flow?
EURUSD is a touch firmer and GBPUSD is a touch weaker.
Note, I have seen month-end flows reverse during the day so keep an eye on your charts
The key focus is on US PCE but expect month-end flows to take over on the approach to the 4 PM London fixing.
GBPUSD 4 HOUR CHART – A retracement or more?-
The failure to test 1.28 and a generally firmer dollar has GBPUSD retracing, breaking a minor 4-hour trendline.
Key support levels are below 1.27, most important for me is 1.2674.
On the upside, back above 1.2725, at a minimum, would be needed to slow the risk but only back aboe 1.2750 would neutralize it.
EURUSD 4-HOUR CHART – UNDERPERFORMER
EURUSD has been the underperformer so far today, losing both cs. the dollar and on its crosses (e.g. eurgbp, eurjpy)_
Attention has now shifted to the bottom of the current 1.0805-95 range, a reversal of what was seen at this time yesterday.
To keep it exposed. the break of 1.0839 needs to hold although 1.0850 will likely set its intra-day tone.
GBPUSD DAILY CHART – 1.28?
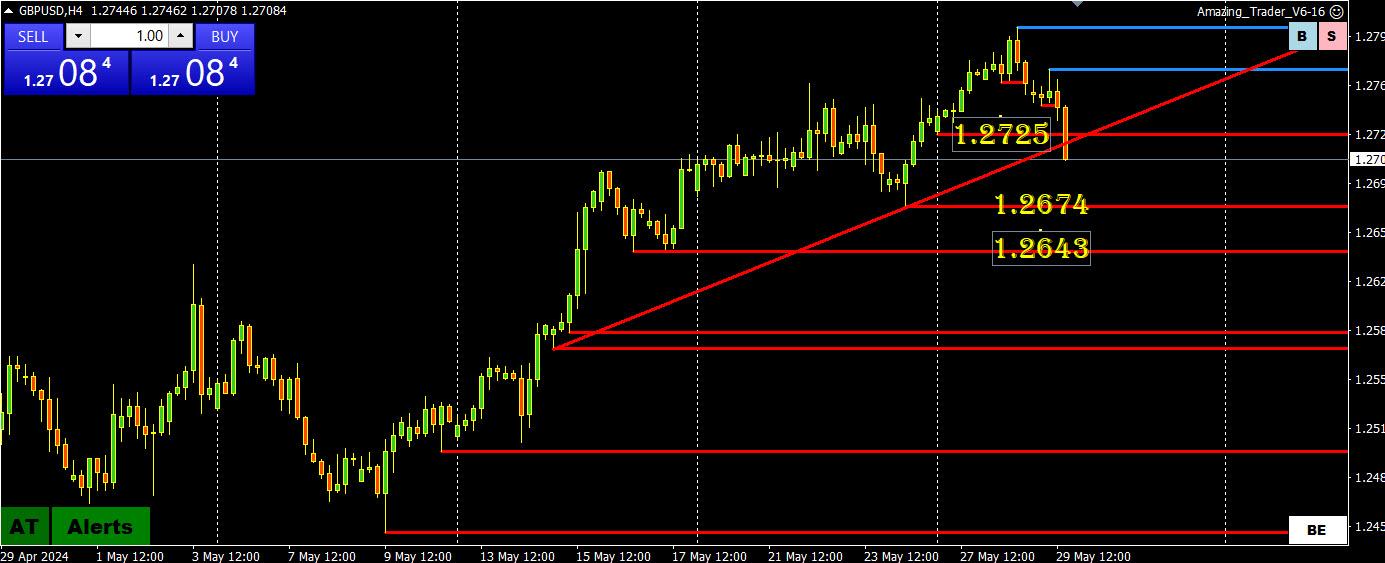
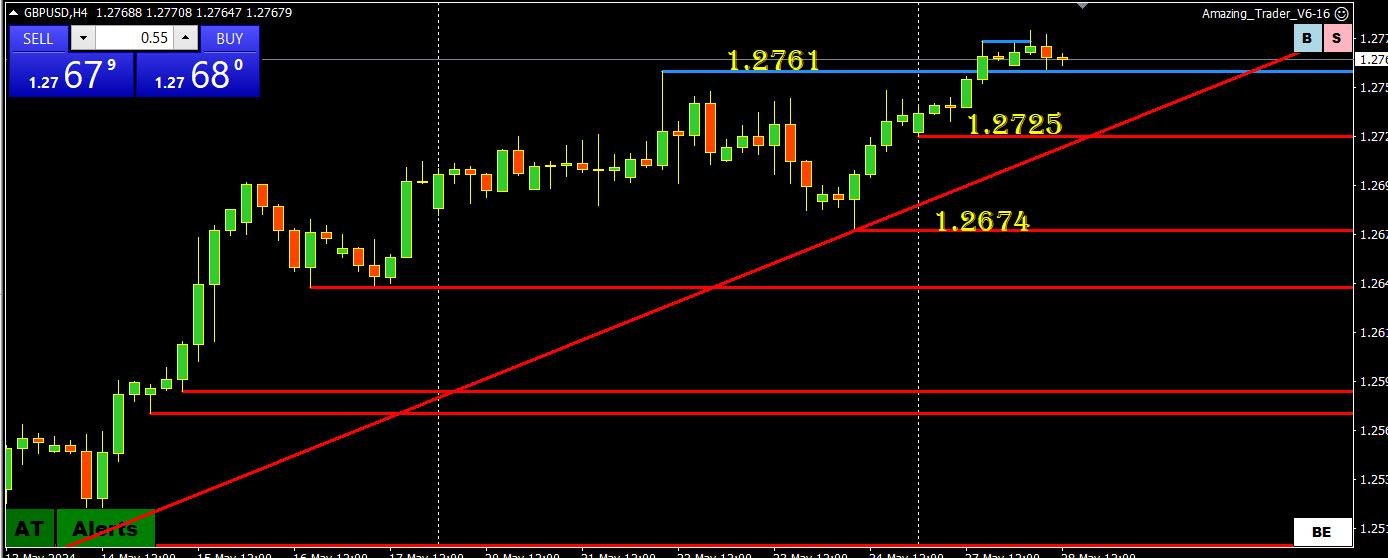
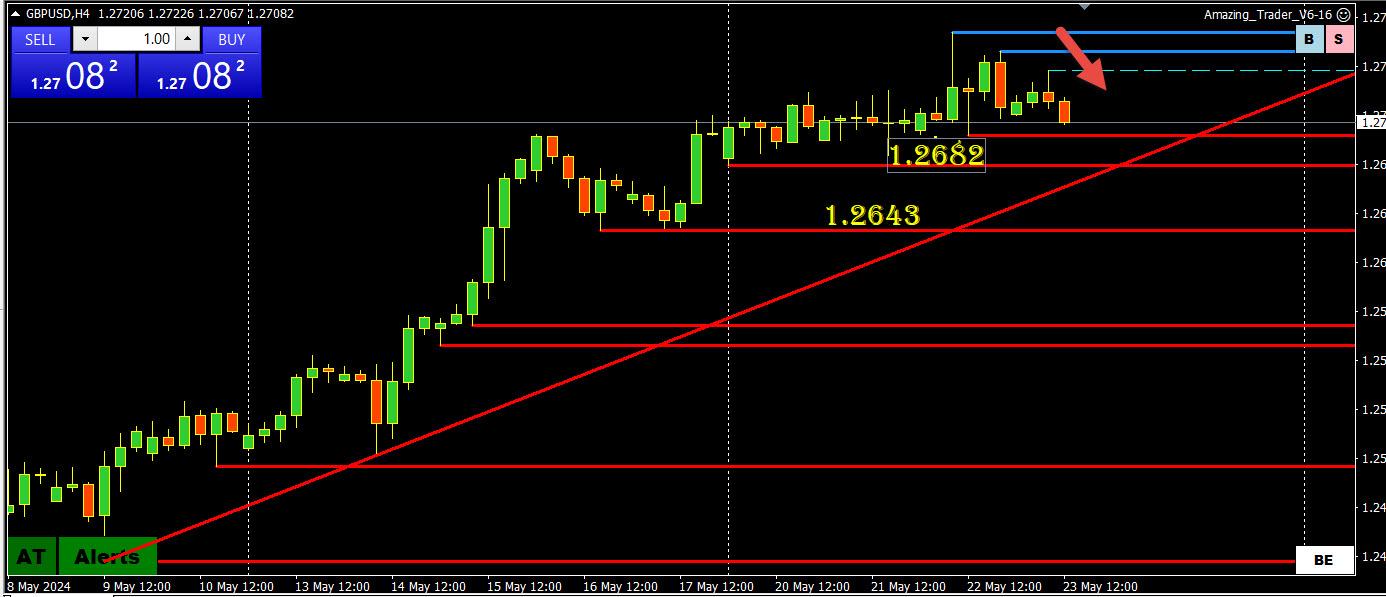
I posted a 4-hour GBPUSD chart earlier (scroll down to see levels) hat showed it lagging but has since shrugged that off (note EURGBP has dipped vs, an earlier bounce).
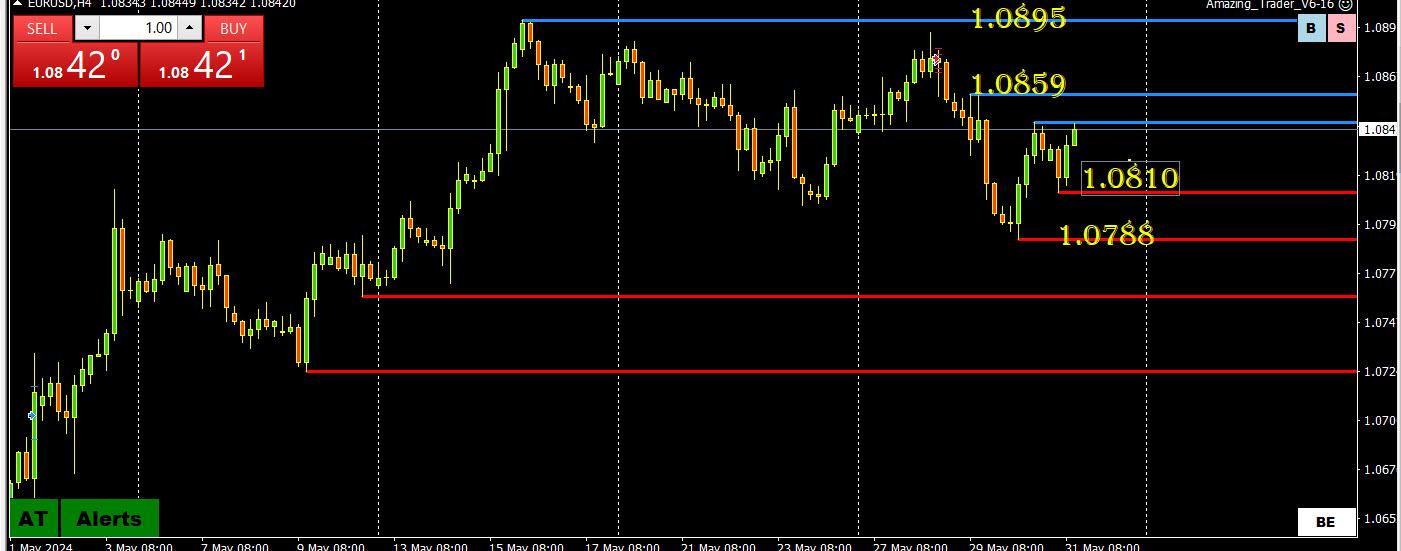
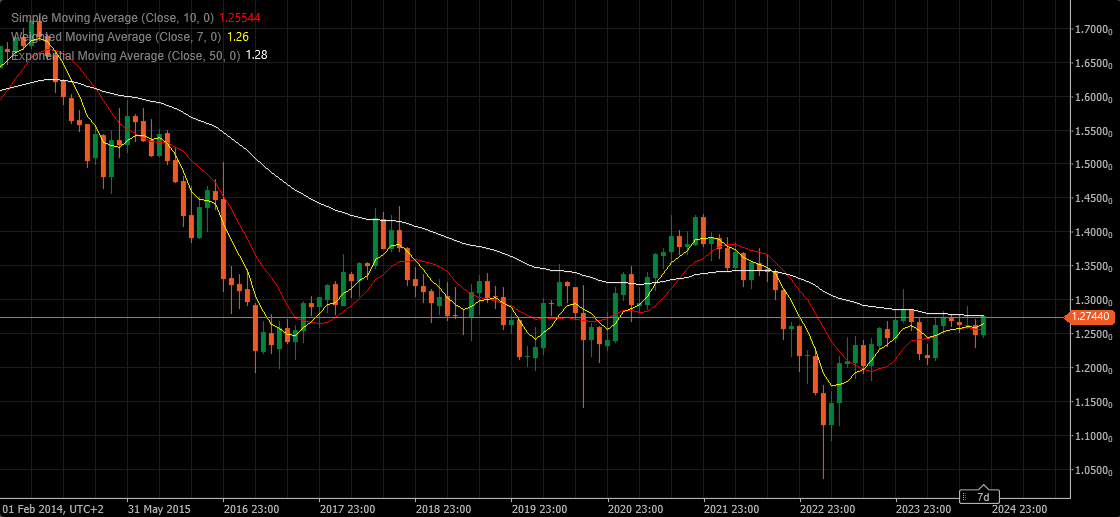
The daily chart, meanwhile, continues to show upside targets but 1.28 is one of those pivotal, some say psychological, other say options barrier levels that are so far causing a pause.
The key time on this chart is next month when support and the key trendline intersect.
USDJPY 4 HOUR CHART – PATH PF LEAST RESISTANCE
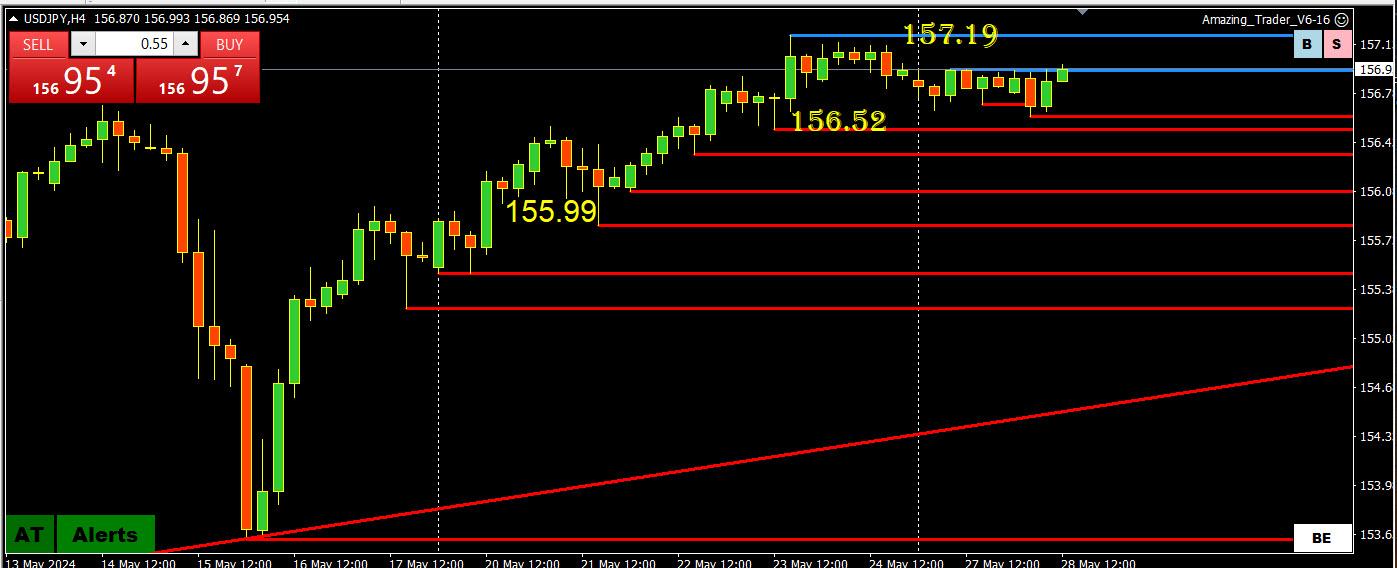
With the market seemingly not ready to push the upside too hard and prompt intervention, it seems to be following the path of least resistance by selling JPY on its crosses.
Offsets may be one source of demand for currencies like the AUD, EUR and GBP.
For USDJPY, the current range is around 156.50-157.20.
A key focus this week will be on Japan CPI with some seeing the window closing on rate hikes as inflation is cookling.
Suggested reading: Jay Meisler’s Common Sense Trading: How You Can Identify the Path of Least Resistance?
GBPUSD 4 HOUR CHART – LAGGING?
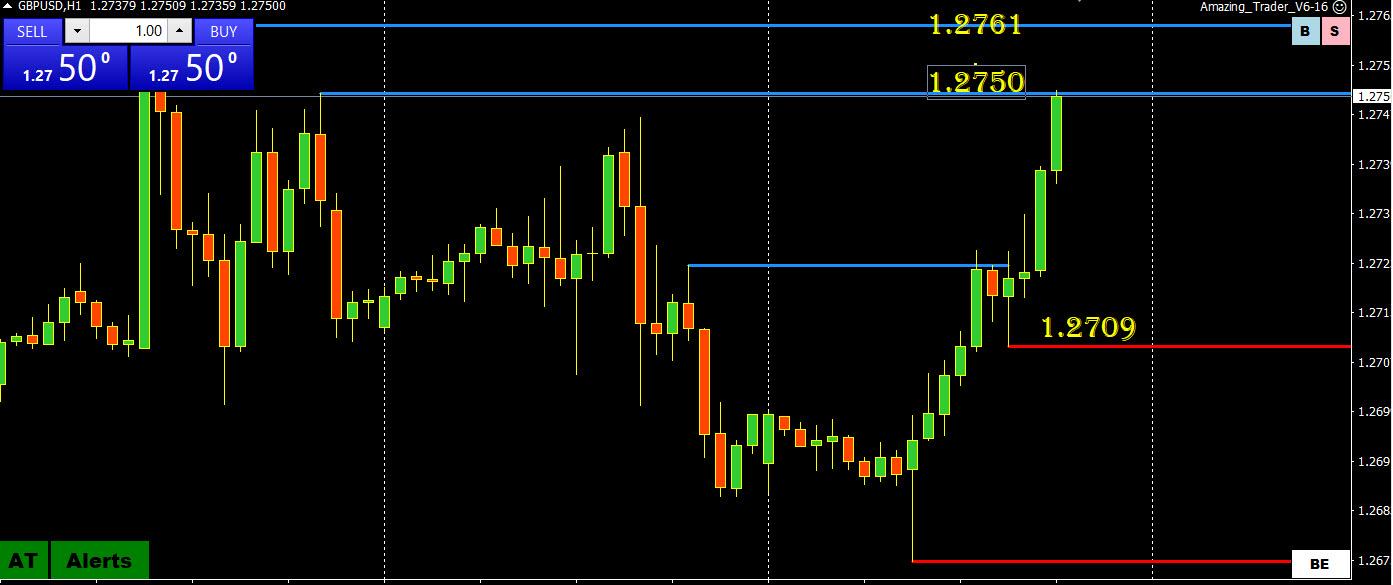
GBPUSD break of 1.2761 so far not going far and is dependent on 1.2761+ to keep a strong bid and then 1.2725 and the trendline holding below it to keep a focus on 1.28+
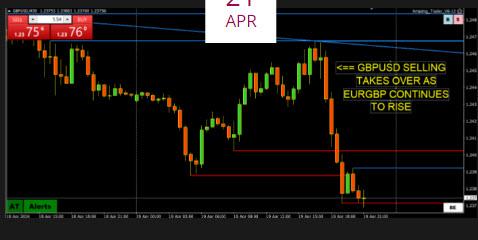
If you look at GBP crosses you will see where some of the demand is coming from… in this regard, EURGBP bounce from .85 today has seen GBPUSD lag today.
Next up is Weekly Jobless Claims, which have taken on greater importance.(see our Economic Calendar)
Risk on after Nividia but US yields ticking lower
EURUSD testing 1.0850 (sets day tone) after a PMI whipsaw, down on weaker French, up on better Germany
EURGBP, my focus earlier, is off its high, cutting short GBPUSD dip which held above 1.27.
USDJPY backing off toward 156.40 after failing to reach 156.98
Disappointing on no follow-through from yesterday but typical of this market of late.
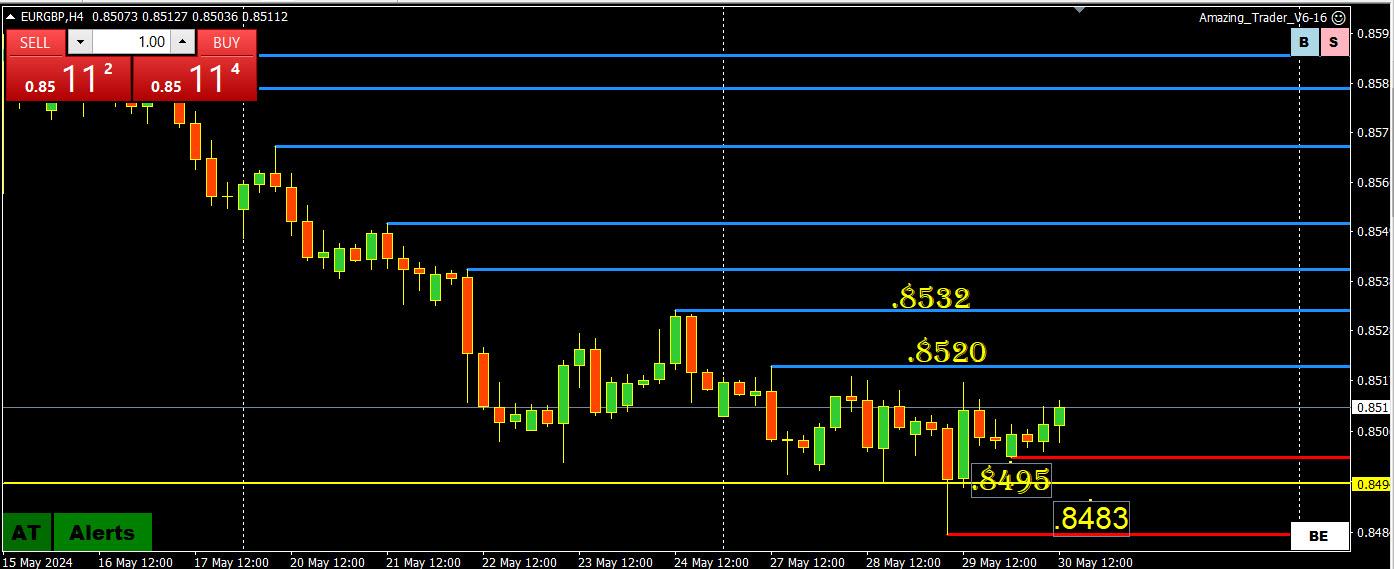
As outsiders, we need as much information as possible to get in sync with what flows are driving the FX market at any point in time. This is one reason why I posted the series of charts to show the influence of EURGBP on EURUSD and GBPUSD. It creates sort of a tug-of-war to see which side (in this case EURUSD buying or GBPUSD selling) the market would have more difficulty absorbing. It is explained in more detail in the following:
How You Can Use Currency Crosses to Trade Spot Forex
GBPUSD 4 HOUR CHART – EURGBP GIVING A CLUE
The bounce in EURGBP (last .8526) has put some downward pressure on GBPUSD, as also indicated by the 2 blue AT lines drawn off the high on this chart, which shows the potential for a shift in directional risk.
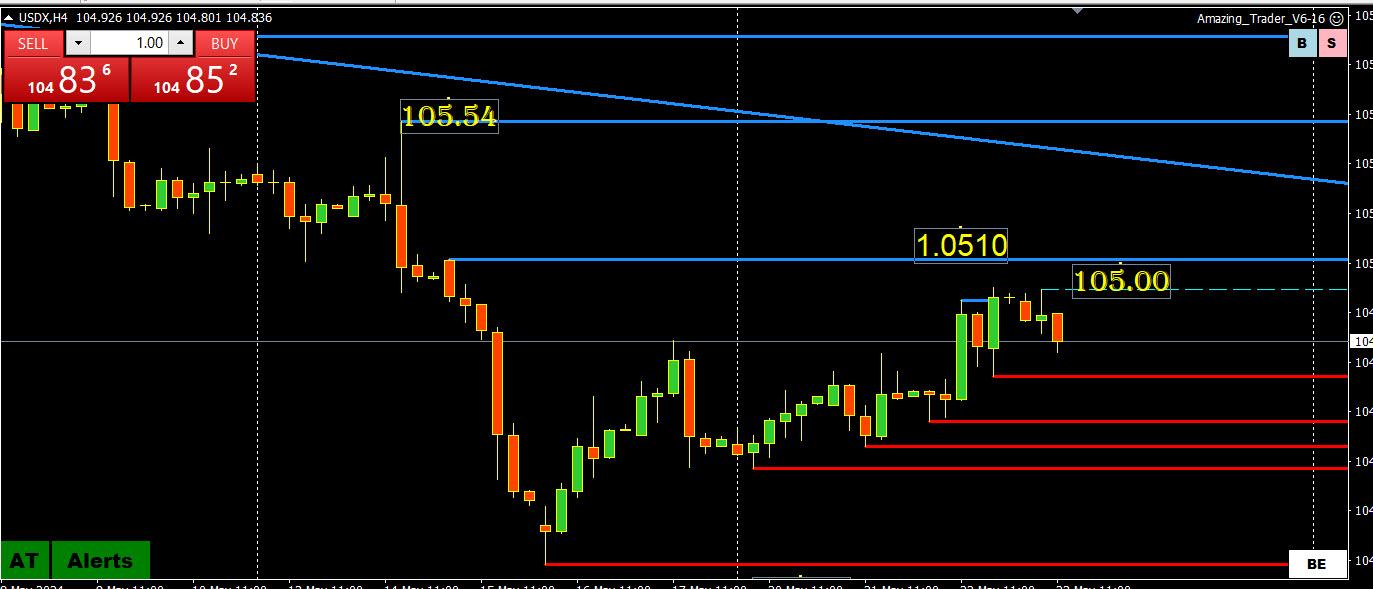
With EURUSD unable to test 1.0847, offsets have taken over and this has seen GBPUSD dip. This is what I refer to as Using Crosses to Trade Spot FX.
With that said, at a minimum, 1.2682 and then 1.2643 would need to be broken to confirm a high is in for now. For that to occur, 1.27 would need to be broken. Low so far has been 1.2705.
USDX 4 HOUR CHART – 3-PART CHECKLIST
While I do not trade USDX, it is part of my 3-part checklist if I am trading the EURUSD (note EURUSD is 57.6% of the index). I look at the following:
1) EURUSD
2) EURGBP (cross influence of EURUSD)
3) USDX (often a proxy for the EURUSD)
Looking at this chart, USDX paused below 105.10, which suggests EURUSD might pause as well.
EURGBP 4 HOUR CHART – BOUNCED OFF PIVOTAL LEVEL
Certain pivotal levels can have a greater impact than a technical chart point.
I call them “magic” levels.
One of these would be .8500, which was nicked on the EZ PMI volatility.
The bounce from it suggests the potential for a low or at least a pause but would need to get back above .8541-51 to confirm the bottom is in.
Note, UK flash PMI just came out, mixed bag but above 60.
© 2024 Global View